Nestle - Supply Chain & Strategy
VerifiedAdded on 2024/01/17
|35
|11764
|119
AI Summary
This report provides an in-depth analysis of Nestle's global supply chain and business strategy. It covers various aspects such as planning, procurement, logistics, operations, and market channels. The report also highlights the contribution of Nestle's supply chain management to its overall business strategy implementation. The study is based on the course Advanced International Business 61B at Đại học Kinh tế Quốc dân.
Contribute Materials
Your contribution can guide someone’s learning journey. Share your
documents today.
Studocu is not sponsored or endorsed by any college or university
GSCM Group 7 Nestle Report
International Supply chain management (Đại học Kinh tế Quốc dân)
Studocu is not sponsored or endorsed by any college or university
GSCM Group 7 Nestle Report
International Supply chain management (Đại học Kinh tế Quốc dân)
Downloaded by Ph??ng Lê (levanphuong2003@gmail.com)
lOMoARcPSD|13574233
GSCM Group 7 Nestle Report
International Supply chain management (Đại học Kinh tế Quốc dân)
Studocu is not sponsored or endorsed by any college or university
GSCM Group 7 Nestle Report
International Supply chain management (Đại học Kinh tế Quốc dân)
Downloaded by Ph??ng Lê (levanphuong2003@gmail.com)
lOMoARcPSD|13574233
Secure Best Marks with AI Grader
Need help grading? Try our AI Grader for instant feedback on your assignments.
NATIONAL ECONOMICS UNIVERSITY
SCHOOL OF ADVANCED EDUCATION PROGRAMS
***
GLOBAL SUPPLY CHAIN MANAGEMENT
Topic: Nestle – Supply Chain & Strategy
Class: Advanced International Business 61B
Lecturer: Dr. Nguyen Bich Ngoc
Group 7: Phan Duc Hieu 11196244
Tran Huong Giang 11196415
Nguyen Thuy Duong 11191276
Vu Minh Huyen 11196225
Dang Thu Trang 11196163
HANOI 2022
Downloaded by Ph??ng Lê (levanphuong2003@gmail.com)
lOMoARcPSD|13574233
TABLE OF CONTENTS
TABLE OF FIGURES i
I. INTRODUCTION OF NESTLE 1
1.1. History 1
1.2. Business scale 3
1.3. Main competitors 3
1.4. Vision and mission 5
1.5. Business segment 5
II. DESCRIPTION OF NESTLE’S GLOBAL SUPPLY CHAIN 6
2.1. Planning 6
2.1.1. Overview of Nestle planning 6
2.1.2. Demand planning 7
2.1.3. Supplier planning 8
2.2. Procurement 9
2.2.1. Raw material sourcing 9
2.2.2. Supplier selection 9
2.3. Logistics 10
2.3.1. In-house logistics 10
2.3.2. Reverse logistics 11
2.4. Operations 11
2.4.1. Supply chain management 11
2.4.2. Quality management 12
2.4.3. Inventory management 12
2.5. Market channels 13
2.5.1. Marketing 13
2.5.2. Distribution 14
2.5.3. Customer service 15
III. DESCRIPTION OF NESTLE’S GLOBAL BUSINESS STRATEGY 15
3.1. Business strategy 15
3.1.1. Cost leadership 15
3.1.2. Differentiation 16
3.1.3. Focus strategy 17
Downloaded by Ph??ng Lê (levanphuong2003@gmail.com)
lOMoARcPSD|13574233
3.2. Intensive Strategy 18
3.3. Sustainable Strategy 20
IV. CONTRIBUTION OF NESTLE’S SUPPLY CHAIN MANAGEMENT TO ITS
GLOBAL BUSINESS STRATEGY IMPLEMENTATION 20
4.1. Planning 20
4.1.1. Demand Planning 20
4.1.2. Supplier Planning 21
4.2. Procurement 22
4.2.1. E-procurement 22
4.2.2. Sustainable procurement 22
4.2.3. Advancing production and sourcing of raw materials 23
4.3. Logistics 23
4.4. Operations 24
4.4.1. Supply chain management 24
4.4.3. Inventory Management 25
4.4.4. Sustainability in Nestle Operations 25
4.5. Market channels 26
4.5.1. Marketing 26
4.5.2. Distribution 26
4.5.3. Innovation 27
REFERENCE 28
Downloaded by Ph??ng Lê (levanphuong2003@gmail.com)
lOMoARcPSD|13574233
Secure Best Marks with AI Grader
Need help grading? Try our AI Grader for instant feedback on your assignments.
TABLE OF FIGUR
Figure 2. 1. SAS demand-driven planning categories................................................7
Figure 2. 2. Supply chain disclosure for Cereals (corn and wheat)............................9
Figure 2. 3. SAP Business One Modules.................................................................12
Figure 2. 4. Nestle social media overview...............................................................13
Figure 2. 5. Nestle distribution channel................................................................14Y
Figure 3. 1. Porter’s generic strategies.....................................................................17
Downloaded by Ph??ng Lê (levanphuong2003@gmail.com)
lOMoARcPSD|13574233
I. INTRODUCTION OF NESTLE
1.1. History
1866-1905
In 1866, the Anglo-Swiss Condensed Milk Company opened the first
condensed milk factory in Europe. Separately, in 1867 Henri Nestlé developed a
breakthrough infant food to tackle high mortality rates because of infants’
intolerance of breastfeeding.
In 1905, Nestle was established as a result of the merger between the Anglo-
Swiss Milk Company Farine Lactée Henri Nestlé.
1906-1938
Following the World War I outbreak and the rocketing demand for condensed
milk yet plummeting supplies, Nestlé turned to the U.S. and Australia for new
establishments of factories. This change was highly fruitful considering the double-
increase in production by the end of the war.
In the 1920s, Nestlé purchased Peter-Cailler-Kohler, the oldest chocolate
company in Switzerland. The following decade witnessed the success of Nestle with
the arrival of the malt chocolate drink Milo in Australia. Soon after, in 1938, the
first mass-market instant coffee, was launched after the Brazilian government’s call
for Nestlé to deal with the excessively produced coffee.
1938-1944
Nestlé felt the effects of World War II immediately. Profits dropped from
$20million in 1938 to $6 million in 1939. Factories were established in developing
countries, particularly Latin America. Ironically, the war helped with the
introduction of the Company’s newest product, Nescafe, which was a staple drink of
the US military. Nestlé’s production and sales rose in the wartime economy.
1944-1975
The end of World War II was the beginning of a dynamic phase for Nestlé.
Growth accelerated and companies were acquired. In 1947 came the mergerwith
Maggi seasonings and soups. Crosse & Blackwell followed in 1960, as didFindus
(1963), Libby’s (1971) and Stouffer’s (1973). Diversification came with a
shareholding in L’Oréal in 1974.
1975-1995
The year 1977 saw the boycott against Nestlé due to the company’s
‘aggressive’ marketing of its breast milk substitutes. The boycott led to the World
Health Assembly adopting the International Code of Marketing of Breast-milk
1
Downloaded by Ph??ng Lê (levanphuong2003@gmail.com)
lOMoARcPSD|13574233
Substitutes, which Nestlé signed on to in 1984, bringing an end to the boycott.
Nestlé made its second venture outside the food industry by acquiring Alcon
Laboratories Inc.
1996-2002
The first half of the 1990s proved to be favorable for Nestlé: trade barriers
crumbled and world markets developed into more or less integrated trading areas.
Since 1996, there have been acquisitions including San Pellegrino (1997), Spillers
Pet foods (1998) and Ralston Purina (2002). There were two major acquisitions in
North America, both in 2002: in July, Nestlé merged its U.S. ice cream business into
Dreyer’s, and in August, a USD 2.6bn acquisition was announced of Chef America,
Inc.
2003 +
The year 2003 started well with the acquisition of Mövenpick Ice Cream,
enhancing Nestlé’s position as one of the world market leaders in this product
category. In 2006, Jenny Craig and Uncle Toby were added to the Nestlé portfolio
and 2007 saw Novartis Medical Nutrition, Gerber and Henniez join the company
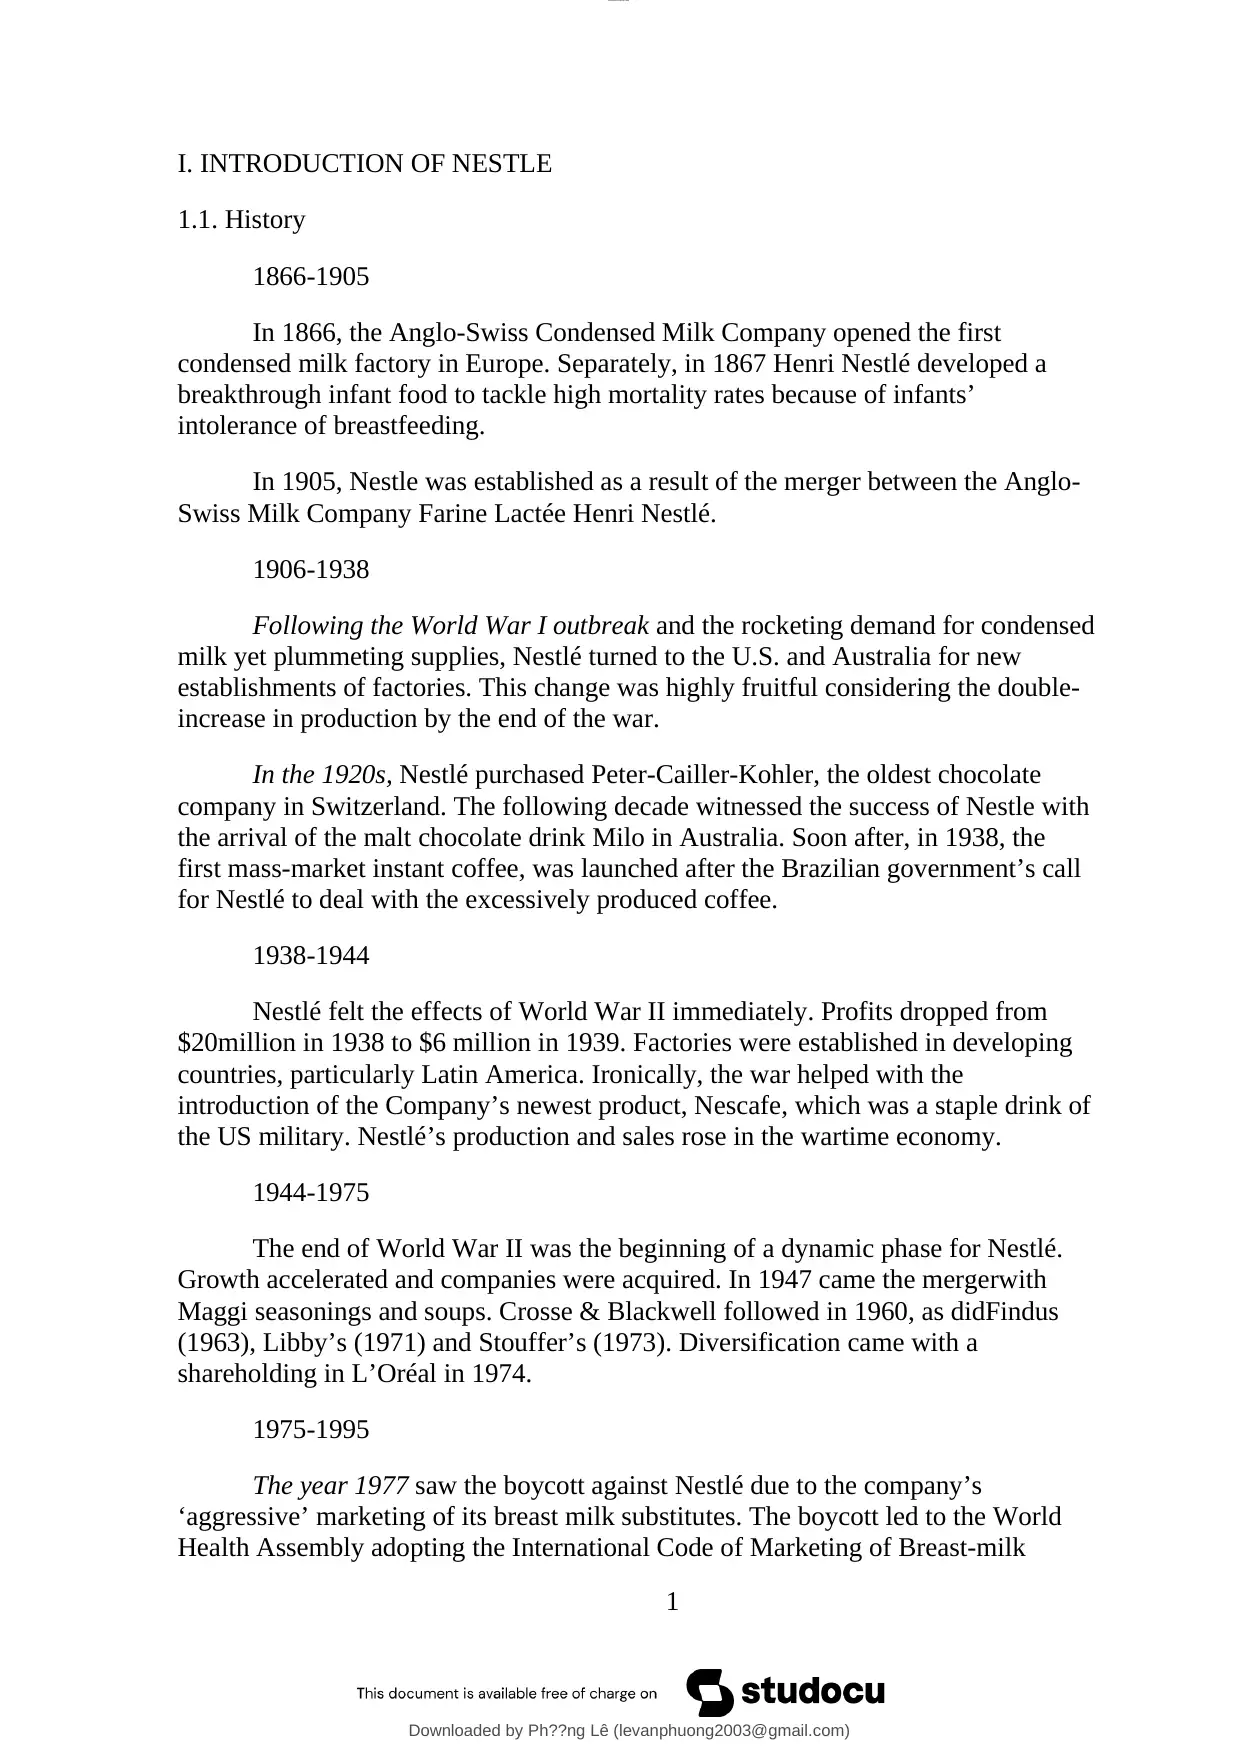
Nestle is the leading food manufacturing company in the world, with its
presence being felt all over the globe and its products sitting comfortably at the
dining table of almost every homestead around the world.
Figure 1. 1. History of Nestle
2
Downloaded by Ph??ng Lê (levanphuong2003@gmail.com)
lOMoARcPSD|13574233
Nestlé made its second venture outside the food industry by acquiring Alcon
Laboratories Inc.
1996-2002
The first half of the 1990s proved to be favorable for Nestlé: trade barriers
crumbled and world markets developed into more or less integrated trading areas.
Since 1996, there have been acquisitions including San Pellegrino (1997), Spillers
Pet foods (1998) and Ralston Purina (2002). There were two major acquisitions in
North America, both in 2002: in July, Nestlé merged its U.S. ice cream business into
Dreyer’s, and in August, a USD 2.6bn acquisition was announced of Chef America,
Inc.
2003 +
The year 2003 started well with the acquisition of Mövenpick Ice Cream,
enhancing Nestlé’s position as one of the world market leaders in this product
category. In 2006, Jenny Craig and Uncle Toby were added to the Nestlé portfolio
and 2007 saw Novartis Medical Nutrition, Gerber and Henniez join the company
Nestle is the leading food manufacturing company in the world, with its
presence being felt all over the globe and its products sitting comfortably at the
dining table of almost every homestead around the world.
Figure 1. 1. History of Nestle
2
Downloaded by Ph??ng Lê (levanphuong2003@gmail.com)
lOMoARcPSD|13574233
Paraphrase This Document
Need a fresh take? Get an instant paraphrase of this document with our AI Paraphraser
1.2. Business scale
In 2021, Nestle was the world’s largest, most diversified food and beverages
company. This company has a unique global footprint and sells its products in 186
countries worldwide. Nestle is the employer of 276,000 workers and has established
354 factories in 70 nations.
In total, the company reached sales of CHF 87.1 billion in the year 2021. The
majority of its sales were contributed by the American market, with CHF 39.1
billion, accounting for 45% of Nestle’s sales. The figures for Europe, Middle East
and North Africa were lower CHF 25.8 billion (30%) and Asia, Oceania and sub-
Saharan Africa: CHF 22.2 billion (25%).
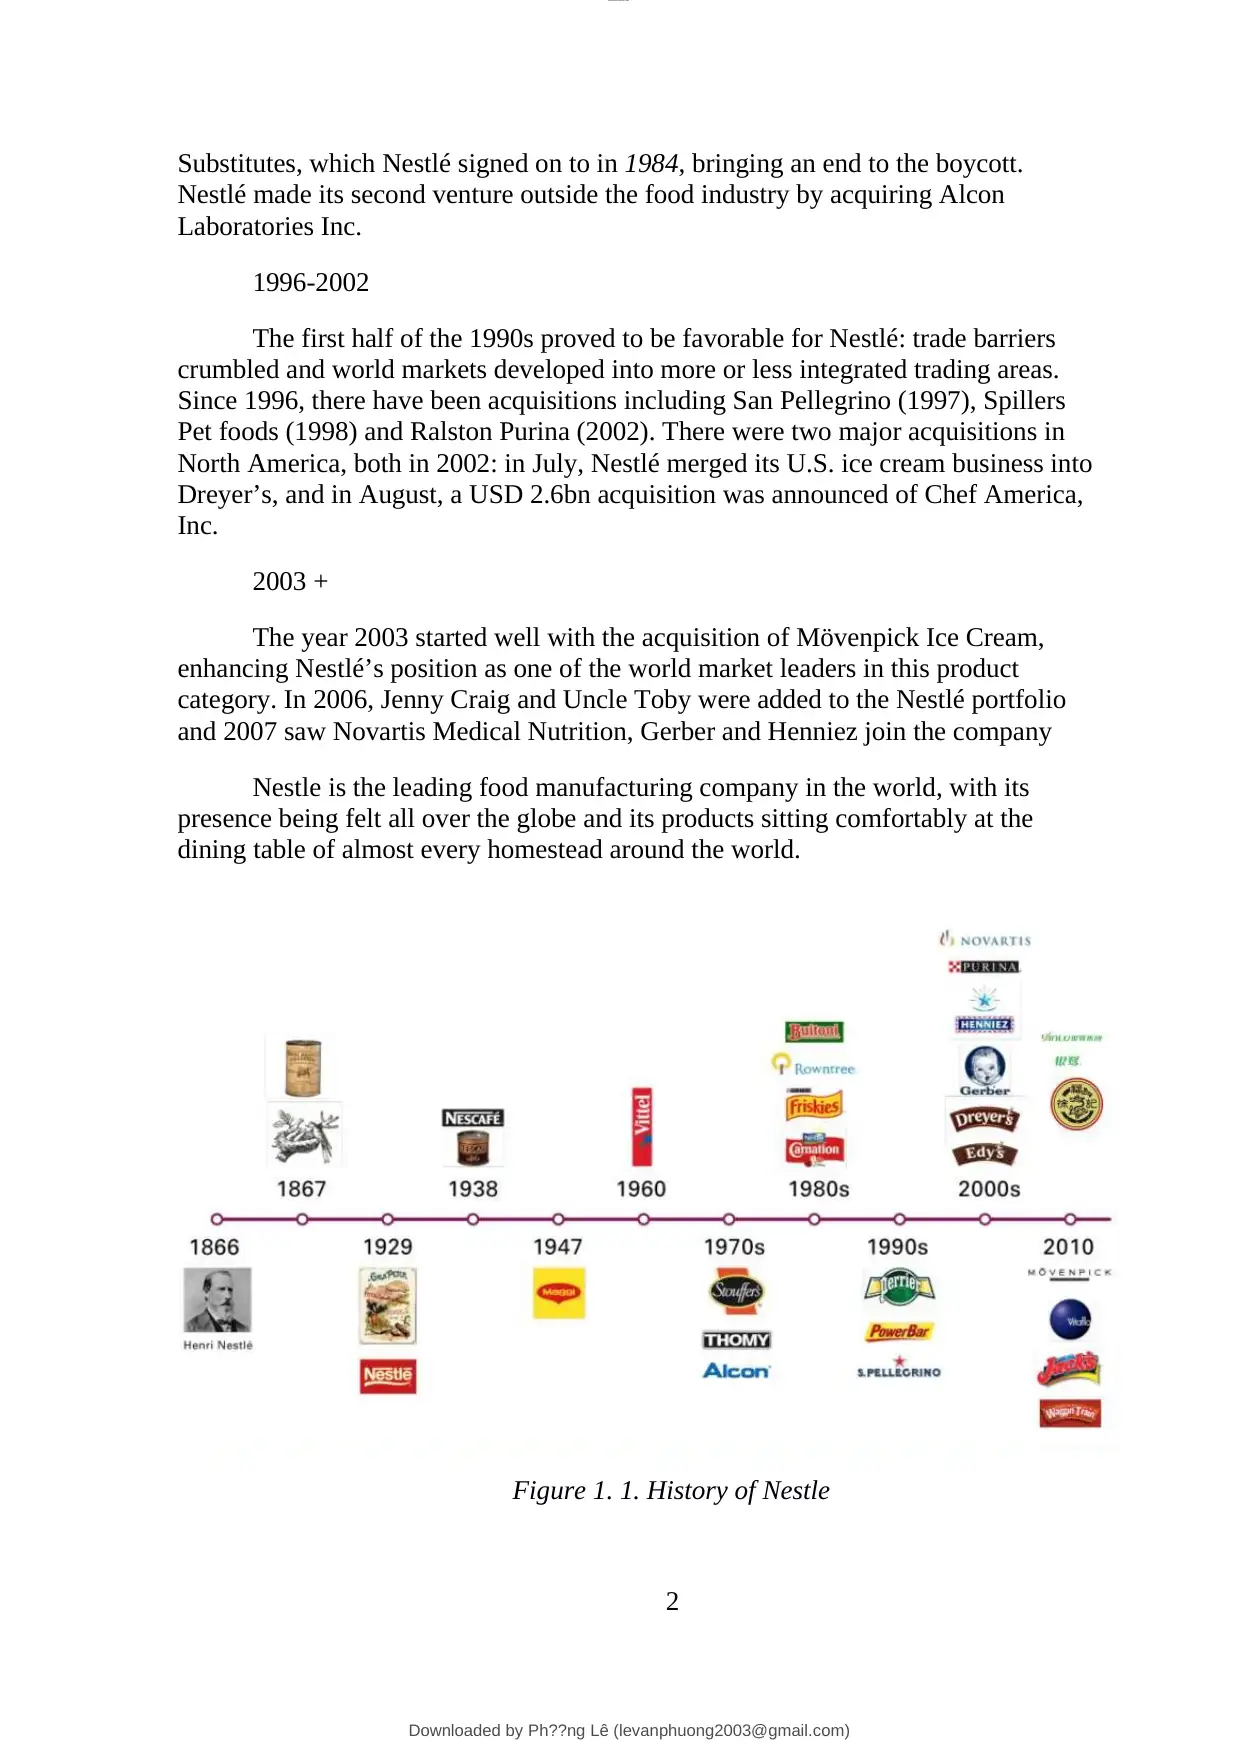
1.3. Main competitors
According to Food Engineering (2021), the most notable change is at the top,
where PepsiCo claimed the No. 1 ranking from Nestlé. PepsiCo saw its food
revenue increase from about $67.2 billion in 2019 to about $70.4 billion. Nestlé saw
its food revenue decline from $76.8 billion in 2019 to $67.7 billion in 2020. Other
notable competitors include Pladis Ltd., a global biscuit, chocolate and
confectionery company. Mars is a famous food industry and is the topmost producer
of confectionery products, while the production of Danone focuses on the
production and sale of healthy and delicious food that is custom-made for the
requirements of people of all ages (Clara et al., 2018).
Table 1. 1. Top 10 Food & Beverage Companies in 2021
Source: Food Engineering (2021)
Rank Company Currency Total
Sales
Food
Sales
Total Sales
($m)
Food Sales
($m)
1 PepsiCo, Inc. $ 70,372 70,372 70,372 70,372
2 Nestle SwF 84,343 72,183 79,114 67,708
3 JBS R$ 270,204 261,050 52,467 50,690
3
Downloaded by Ph??ng Lê (levanphuong2003@gmail.com)
lOMoARcPSD|13574233
In 2021, Nestle was the world’s largest, most diversified food and beverages
company. This company has a unique global footprint and sells its products in 186
countries worldwide. Nestle is the employer of 276,000 workers and has established
354 factories in 70 nations.
In total, the company reached sales of CHF 87.1 billion in the year 2021. The
majority of its sales were contributed by the American market, with CHF 39.1
billion, accounting for 45% of Nestle’s sales. The figures for Europe, Middle East
and North Africa were lower CHF 25.8 billion (30%) and Asia, Oceania and sub-
Saharan Africa: CHF 22.2 billion (25%).
1.3. Main competitors
According to Food Engineering (2021), the most notable change is at the top,
where PepsiCo claimed the No. 1 ranking from Nestlé. PepsiCo saw its food
revenue increase from about $67.2 billion in 2019 to about $70.4 billion. Nestlé saw
its food revenue decline from $76.8 billion in 2019 to $67.7 billion in 2020. Other
notable competitors include Pladis Ltd., a global biscuit, chocolate and
confectionery company. Mars is a famous food industry and is the topmost producer
of confectionery products, while the production of Danone focuses on the
production and sale of healthy and delicious food that is custom-made for the
requirements of people of all ages (Clara et al., 2018).
Table 1. 1. Top 10 Food & Beverage Companies in 2021
Source: Food Engineering (2021)
Rank Company Currency Total
Sales
Food
Sales
Total Sales
($m)
Food Sales
($m)
1 PepsiCo, Inc. $ 70,372 70,372 70,372 70,372
2 Nestle SwF 84,343 72,183 79,114 67,708
3 JBS R$ 270,204 261,050 52,467 50,690
3
Downloaded by Ph??ng Lê (levanphuong2003@gmail.com)
lOMoARcPSD|13574233
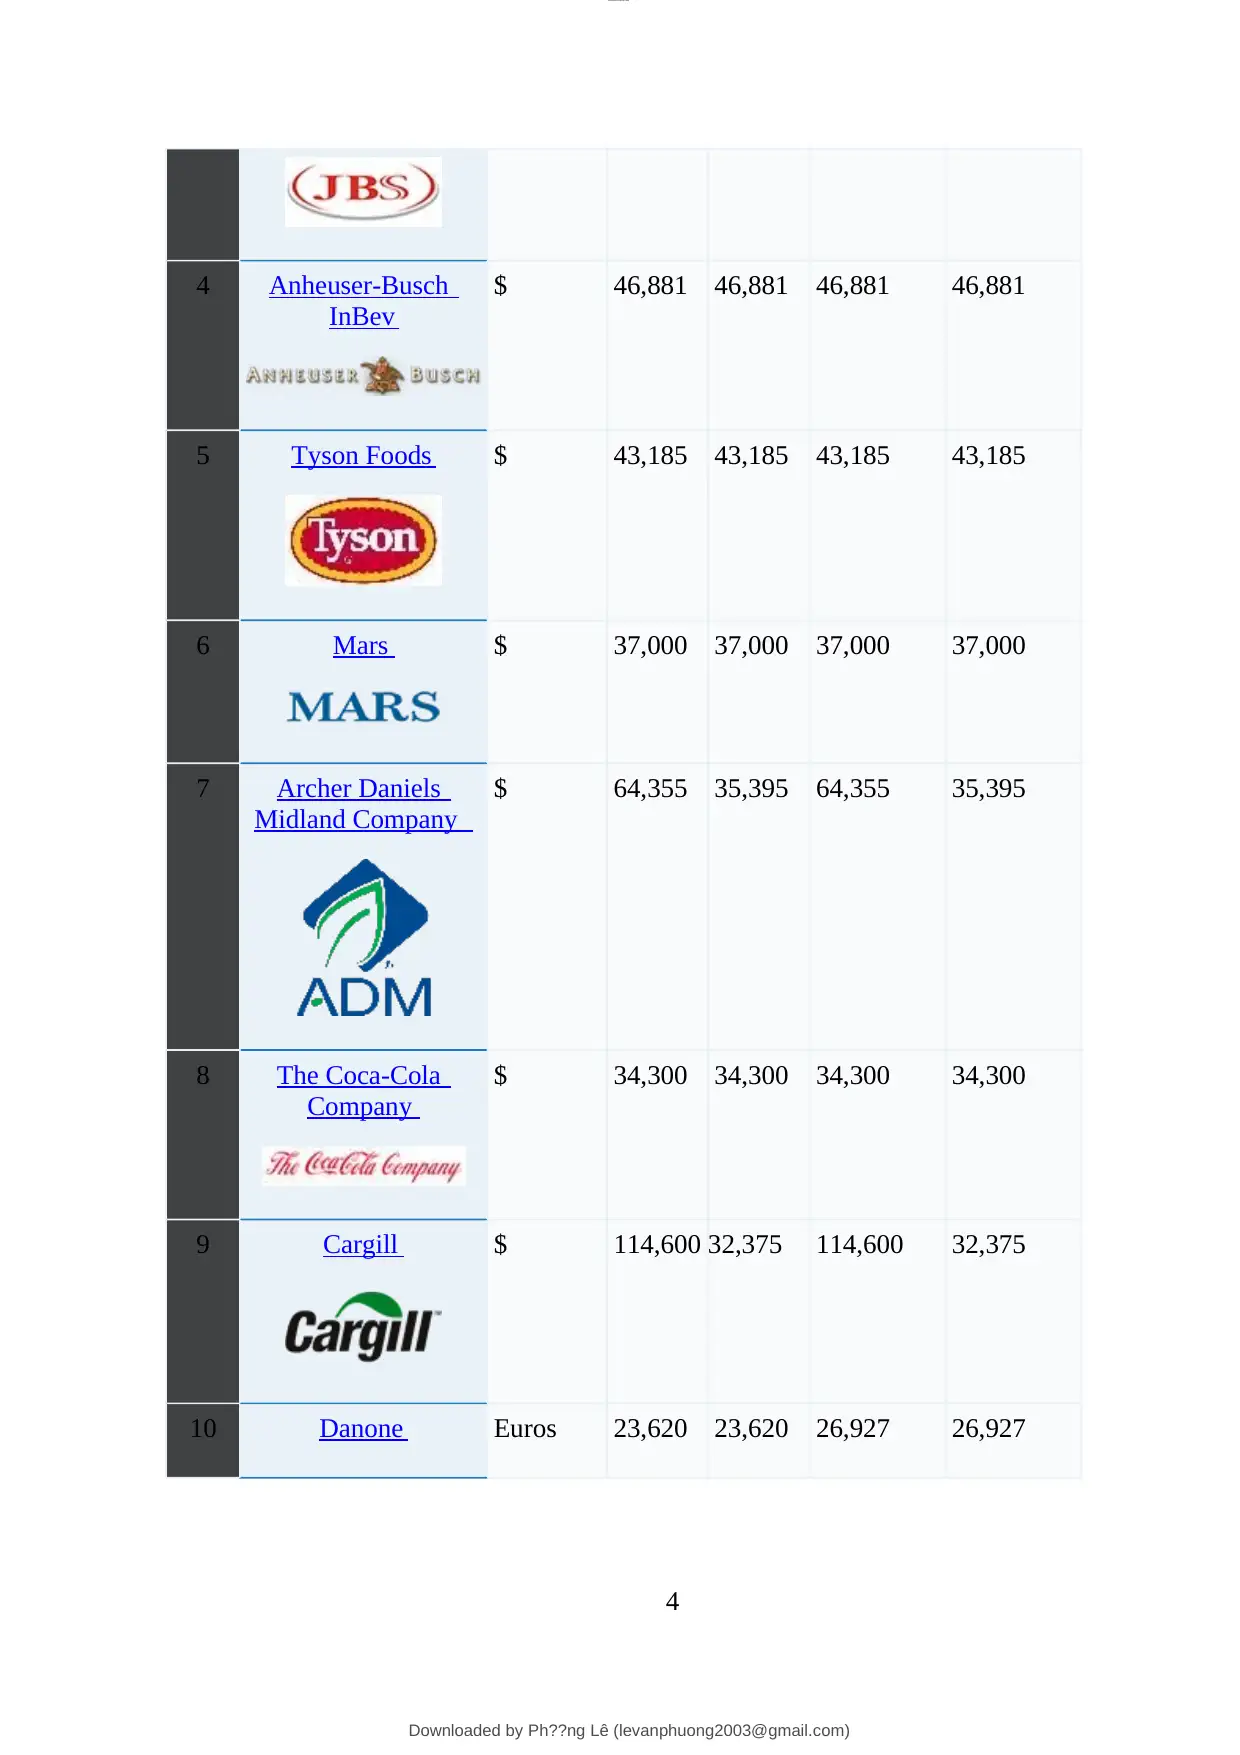
4 Anheuser-Busch
InBev
$ 46,881 46,881 46,881 46,881
5 Tyson Foods $ 43,185 43,185 43,185 43,185
6 Mars $ 37,000 37,000 37,000 37,000
7 Archer Daniels
Midland Company
$ 64,355 35,395 64,355 35,395
8 The Coca-Cola
Company
$ 34,300 34,300 34,300 34,300
9 Cargill $ 114,600 32,375 114,600 32,375
10 Danone Euros 23,620 23,620 26,927 26,927
4
Downloaded by Ph??ng Lê (levanphuong2003@gmail.com)
lOMoARcPSD|13574233
1.4. Vision and mission
Nestlé pursues the mission of being the world’s leading nutrition, health and
wellness company. Its mission of “Good Food, Good Life” is to provide consumers
with the best tasting, most nutritious choices in a wide range of food and beverage
categories and eating occasions, from morning to night.
Nestle follows the vision to be a leading, competitive, Nutrition, Health and
Wellness Company delivering improved shareholder value by being a preferred
corporate citizen, preferred employer, preferred supplier selling preferred products.
1.5. Business segment
Nutrition has been the cornerstone of Nestle Company since its inception in
the year 1867. Therefore, most products and services provided by the company
revolve around nutritional needs. The company strives at providing quality products
and services which will help in promoting the better and healthy well-being of its
consumers. Nestle has gained a world reputation for its consistency in providing
quality and safe products.
Nestle provides a diversified range of products with over 2,000 brands,
which can be classified into 12 categories: (1) Baby food; (2) Bottled water; (3)
Cereals; (4) Chocolate and Confectionery; (5) Coffee; (6) Culinary, chilled & frozen
food; (7) Dairy; (8) Drinks; (9) Food service; (10) Healthcare nutrition; (11) Ice
cream; (12) Pet care (Nestle, 2021). Nestle’s portfolio covers almost every food and
beverage category. This enables the company to serve customers of all age brackets
thereby increasing the opportunities for return and spread the risks of investments.
According to Nils-Gerrit (2021), the primary product segment of Nestle was
chocolate, which generated 5,716 million CHF, about five times as much as the
figure for biscuits. Meanwhile, the sugar confectionery sales were only 651 million
CHF.
5
Downloaded by Ph??ng Lê (levanphuong2003@gmail.com)
lOMoARcPSD|13574233
Secure Best Marks with AI Grader
Need help grading? Try our AI Grader for instant feedback on your assignments.
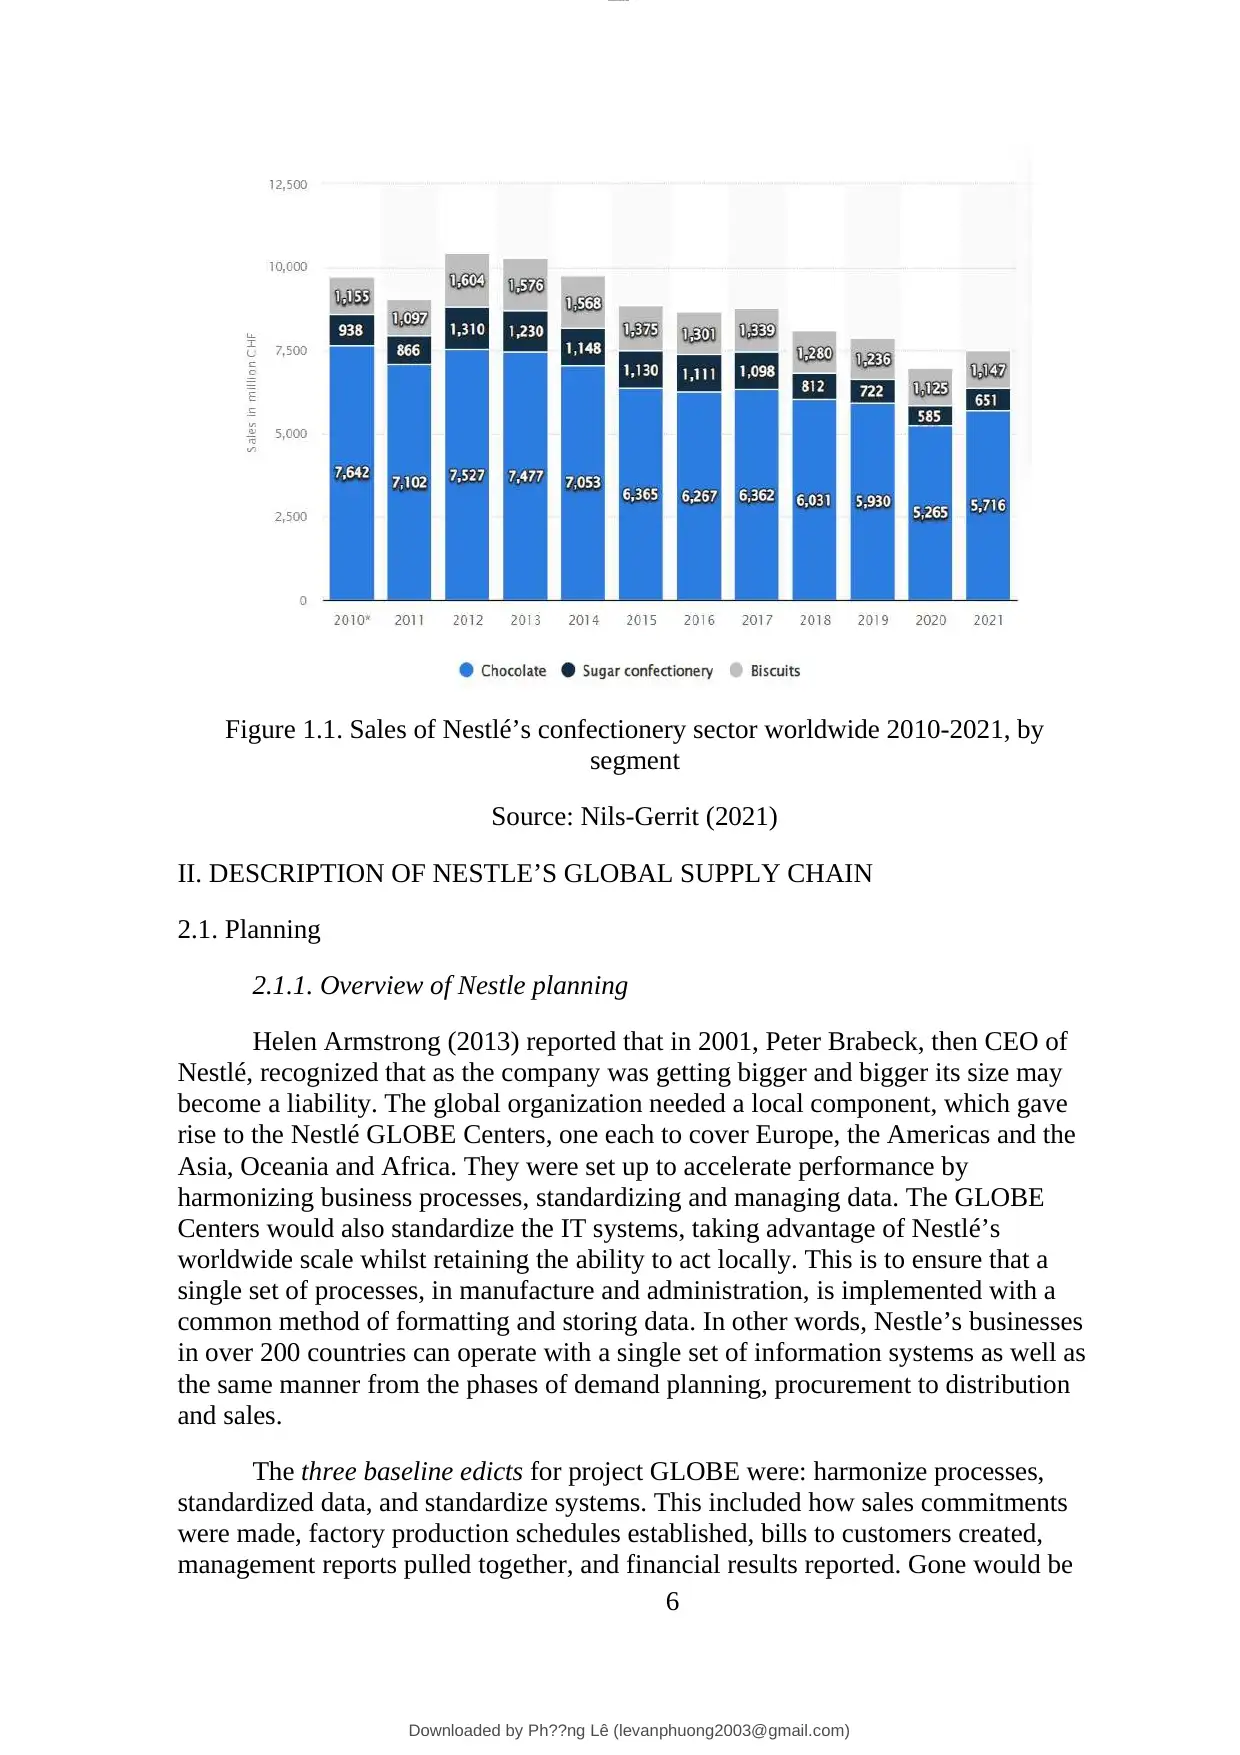
Figure 1.1. Sales of Nestlé’s confectionery sector worldwide 2010-2021, by
segment
Source: Nils-Gerrit (2021)
II. DESCRIPTION OF NESTLE’S GLOBAL SUPPLY CHAIN
2.1. Planning
2.1.1. Overview of Nestle planning
Helen Armstrong (2013) reported that in 2001, Peter Brabeck, then CEO of
Nestlé, recognized that as the company was getting bigger and bigger its size may
become a liability. The global organization needed a local component, which gave
rise to the Nestlé GLOBE Centers, one each to cover Europe, the Americas and the
Asia, Oceania and Africa. They were set up to accelerate performance by
harmonizing business processes, standardizing and managing data. The GLOBE
Centers would also standardize the IT systems, taking advantage of Nestlé’s
worldwide scale whilst retaining the ability to act locally. This is to ensure that a
single set of processes, in manufacture and administration, is implemented with a
common method of formatting and storing data. In other words, Nestle’s businesses
in over 200 countries can operate with a single set of information systems as well as
the same manner from the phases of demand planning, procurement to distribution
and sales.
The three baseline edicts for project GLOBE were: harmonize processes,
standardized data, and standardize systems. This included how sales commitments
were made, factory production schedules established, bills to customers created,
management reports pulled together, and financial results reported. Gone would be
6
Downloaded by Ph??ng Lê (levanphuong2003@gmail.com)
lOMoARcPSD|13574233
local customs, except where legal requirements and exceptional circumstances
mandated an alternative manner of, say, finding a way to pay the suppliers of
perishable products like dairy or produce in a week rather than 30 days.
The adaptation of the GLOBE program into Nestle’s global supply chain
management connects all Nestle departments around the world and makes company
information accessible to all its employees thereby allowing communication flow
between people in the company.
2.1.2. Demand planning
The demand planning is made in tandem with the monthly sales review
meeting. The monthly breakdown then moves to weekly schedule of production and
dispatch planning. For the supply planning the primary objective is material
requirement planning for all direct materials. Nestle also maintains close contact
with inter market subsidiaries to ensure lead time communication for imported
semi-finished bulks.
According to Andreas Gartner (2011), Nestlé adopted state-of-the-art
statistical forecasting and predictive analytics to improve demand planning
efficiency and accuracy by signing a contract with SAS. SAS demand-driven
planning as a high-performance forecasting solution complement well the Nestlé
Demand Planning solution which is based on SAP APO (Advanced Planning and
Optimization).
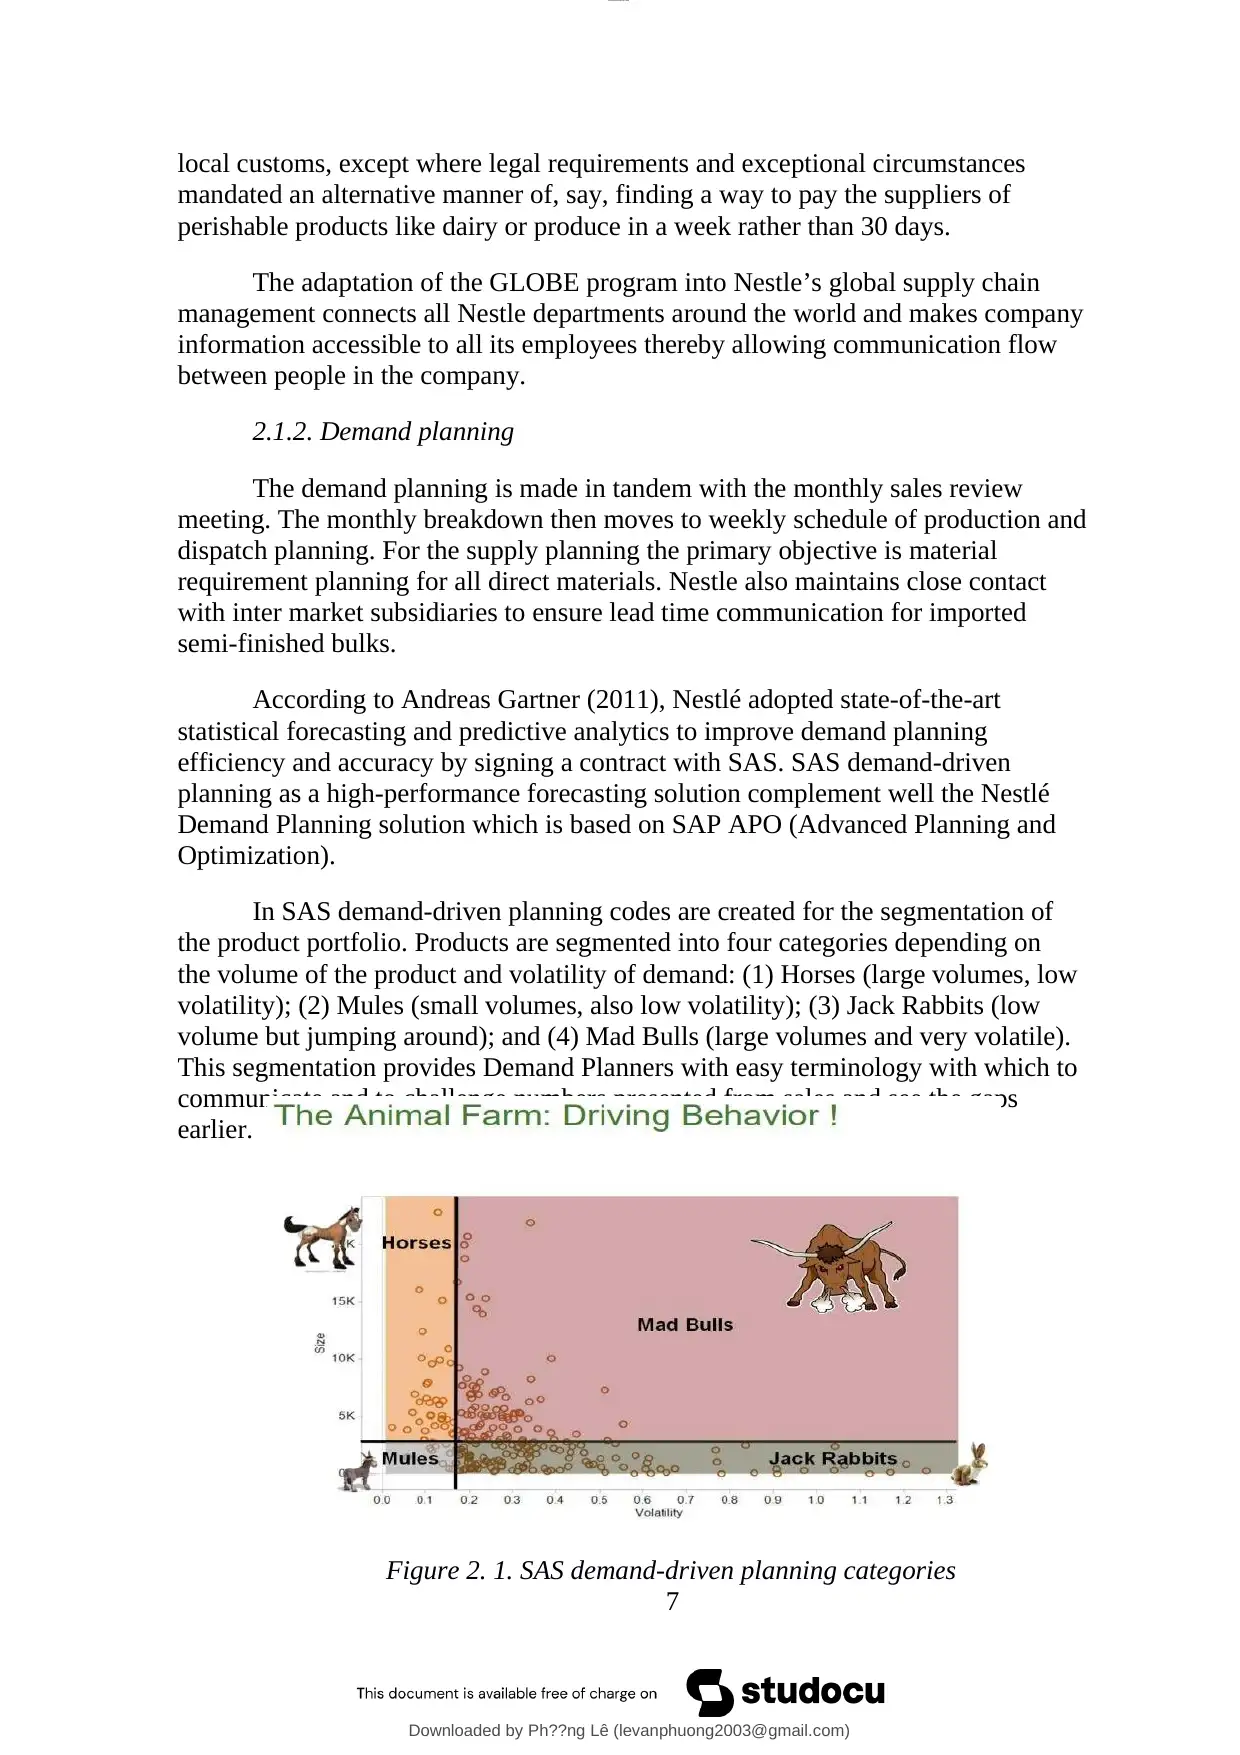
In SAS demand-driven planning codes are created for the segmentation of
the product portfolio. Products are segmented into four categories depending on
the volume of the product and volatility of demand: (1) Horses (large volumes, low
volatility); (2) Mules (small volumes, also low volatility); (3) Jack Rabbits (low
volume but jumping around); and (4) Mad Bulls (large volumes and very volatile).
This segmentation provides Demand Planners with easy terminology with which to
communicate and to challenge numbers presented from sales and see the gaps
earlier.
Figure 2. 1. SAS demand-driven planning categories
7
Downloaded by Ph??ng Lê (levanphuong2003@gmail.com)
lOMoARcPSD|13574233
mandated an alternative manner of, say, finding a way to pay the suppliers of
perishable products like dairy or produce in a week rather than 30 days.
The adaptation of the GLOBE program into Nestle’s global supply chain
management connects all Nestle departments around the world and makes company
information accessible to all its employees thereby allowing communication flow
between people in the company.
2.1.2. Demand planning
The demand planning is made in tandem with the monthly sales review
meeting. The monthly breakdown then moves to weekly schedule of production and
dispatch planning. For the supply planning the primary objective is material
requirement planning for all direct materials. Nestle also maintains close contact
with inter market subsidiaries to ensure lead time communication for imported
semi-finished bulks.
According to Andreas Gartner (2011), Nestlé adopted state-of-the-art
statistical forecasting and predictive analytics to improve demand planning
efficiency and accuracy by signing a contract with SAS. SAS demand-driven
planning as a high-performance forecasting solution complement well the Nestlé
Demand Planning solution which is based on SAP APO (Advanced Planning and
Optimization).
In SAS demand-driven planning codes are created for the segmentation of
the product portfolio. Products are segmented into four categories depending on
the volume of the product and volatility of demand: (1) Horses (large volumes, low
volatility); (2) Mules (small volumes, also low volatility); (3) Jack Rabbits (low
volume but jumping around); and (4) Mad Bulls (large volumes and very volatile).
This segmentation provides Demand Planners with easy terminology with which to
communicate and to challenge numbers presented from sales and see the gaps
earlier.
Figure 2. 1. SAS demand-driven planning categories
7
Downloaded by Ph??ng Lê (levanphuong2003@gmail.com)
lOMoARcPSD|13574233
The animal represents the behavior Demand Planners need to adopt: a Horse can be
trained and is an animal one can rely on, but it is also an animal with a high monetary
volume. Therefore, Demand Planners should rely more on statistical forecasts and not
loose time planning them manually, but naturally keep an eye on them. The Mad Bulls
retain then the strongest attention as they generate significant volume and value for the
company, but are intrinsically difficult to predict, one needs to invest time for these
products. Some of these Mad Bulls can be made predictable. If one can achieve to explain
the volatility in the history by variables like historical and future price discounts. Others
remain unpredictable, and thus therefore need higher safety stocks to cover a larger level of
uncertainty.
The firm uses two types of forecasting techniques- judgmentally (subjectively,
organically) and statistically (Exponential Smoothing Models (ESM) and Auto Regressive
Integrated Moving Average (ARIMA) also known as the Box-Jenkins framework). As
often, neither approach fits all products, therefore it is key when to privilege one approach
to the other. The segmentation strategy in the four quadrants described above is the answer
to this (Alliston Ackerman, 2012).
2.1.3. Supplier planning
The supplier selection process for suppliers who provide raw and packaging
materials, promotional items or other indirect materials that are in contact with food
products is governed by the general instruction GI-31.104-3 Vendor Approval
Process, with the use of the Vendor Approval Compass and for all other suppliers by
the 7 Step Strategic Sourcing Process. Pre-qualification of vendors will be
undertaken to create a supplier shortlist. This ensures that there is an early
understanding of a potential supplier’s capability, readiness and commitment to
comply with Nestlé’s requirements. Only the short-listed suppliers will be invited to
participate in the quotation process or request for proposal.
After having provided their proposals, the short-listed suppliers will be
analyzed against a pre-determined set of evaluation criteria to determine if they
meet all requirements in relation to the goods or services that Nestlé requires. The
evaluation criteria will contain, at a minimum:
• Specification
• Price Conditions
• Service Conditions
• Food / Packaging Safety and Quality
• Technical, R&D and Innovation Capabilities
• Responsible Sourcing
• Financial Stability.
8
Downloaded by Ph??ng Lê (levanphuong2003@gmail.com)
lOMoARcPSD|13574233
Paraphrase This Document
Need a fresh take? Get an instant paraphrase of this document with our AI Paraphraser
Potential suppliers will be chosen based on an objective analysis against the
evaluation criteria. All relevant information regarding a supplier’s proposal and any
risks associated with the supplier or the delivery of materials will be shared between
Procurement and the Business to ensure that informed decisions are made that take
account of all important details.
Supplier development will be undertaken to improve or expand our
suppliers’ capabilities which is necessary for Nestlé to continuously meet
competitive challenges. It will be performed based on the specific and most
appropriate supplier strategy.
Nestle will ensure that our strategic suppliers recognize Nestlé as the first
choice for their innovations and that our Procurement people are continuously
scouting the supply environment for new opportunities.
Nestle will ensure that our suppliers’ capabilities and capacities are matched
to Nestlé’s long-term needs.
To achieve this, Nestle will proactively engage our suppliers together with all
relevant Nestlé functions. Good supplier development ensures that all parties benefit
from agreed and aligned goals with a relationship built on trust.
2.2. Procurement
As one of the world’s largest food raw material buyers, Nestle spends around
60bn (US$71.5bn) a year on central procurement, of which 22bn is spent on
ingredients and 8bn is spent on packaging. The procurement department takes
orders or plans from Demand & Supply Planning department and make sure all raw
materials, packaging materials, and finished goods reach the company in the right
quality, quantity, time, and at the lowest cost to company possible.
2.2.1. Raw material sourcing
Nestles sources directly from more than 626.000 farmers to purchase
agricultural raw materials, principally milk, coffee, cocoa, cereals, vegetables, fruit,
herbs, sugar and spices, either through trade channels or directly from farmers. They
use a wide variety of different suppliers worldwide all of whom must comply with
Nestlé quality standards. Located in hubs in Switzerland, Panama and Malaysia, the
division provides a range of services, including the management of procurement for
specific raw materials, packaging, indirect materials and other services. The hubs
also support markets by managing local spending.
2.2.2. Supplier selection
The Nestlé Supplier Code establishes non-negotiable minimum standards.
They ask their suppliers, their employees, agents and subcontractors to respect and
adhere to at all times when conducting business. The Nestlé Supplier Code helps to
9
Downloaded by Ph??ng Lê (levanphuong2003@gmail.com)
lOMoARcPSD|13574233
implement the commitment. To ensure both responsible sourcing and supplier
relationships that deliver a competitive advantage.
In compliance with Nestlé’s Corporate Business Principles, Nestlé selects
suppliers based on the following criteria: Ability to offer a competitive value
proposition; reputation, financial situation and record with Nestlé; ownership,
management structure and competence; innovation, service level and transparency:
already approved or subject to formal approval prior to first delivery: minimum
corporate social responsibility standards: ability and willingness to work with their
preferred tools: processes and solution providers Sustainable business practices
Potential suppliers will be chosen based on an objective analysis against the
evaluation criteria. All relevant information regarding a supplier’s proposal and any
risks associated with the supplier or the delivery of materials will be shared between
Procurement and the Business to ensure that informed decisions are made that take
account of all important details
2.2.3. Supplier relationship management
Nestle partners with suppliers all over the world to offer their products and
brands in more than 187 countries. Their suppliers are an integral part of the value
chain, Nestle believes that strong relationships with them are critical to business
success. The procurement department takes orders or plans from Demand & Supply
Planning department and make sure all raw materials, packaging materials, and
finished goods reach the company in the right quality, quantity, time, and at the
lowest cost to company possible. The department has two major teams working
namely Direct Materials Procurement and Services & Indirect Materials
Procurement. Direct Material Procurement oversees purchasing all imported and
local raw materials. Their main task is to work closely with suppliers to ensure there
is adequate lead time to prepare and dispatch raw & packaging materials in due
time, to ensure their timely arrival when needed. The Indirect Material Procurement
deals specifically with inputs of any nature that is not part of the core/direct
production process.
Nestle also promotes its supply chain transparency by publicly showing the
lists of suppliers for the company. One example can be seen in the case of cereals.
10
Downloaded by Ph??ng Lê (levanphuong2003@gmail.com)
lOMoARcPSD|13574233
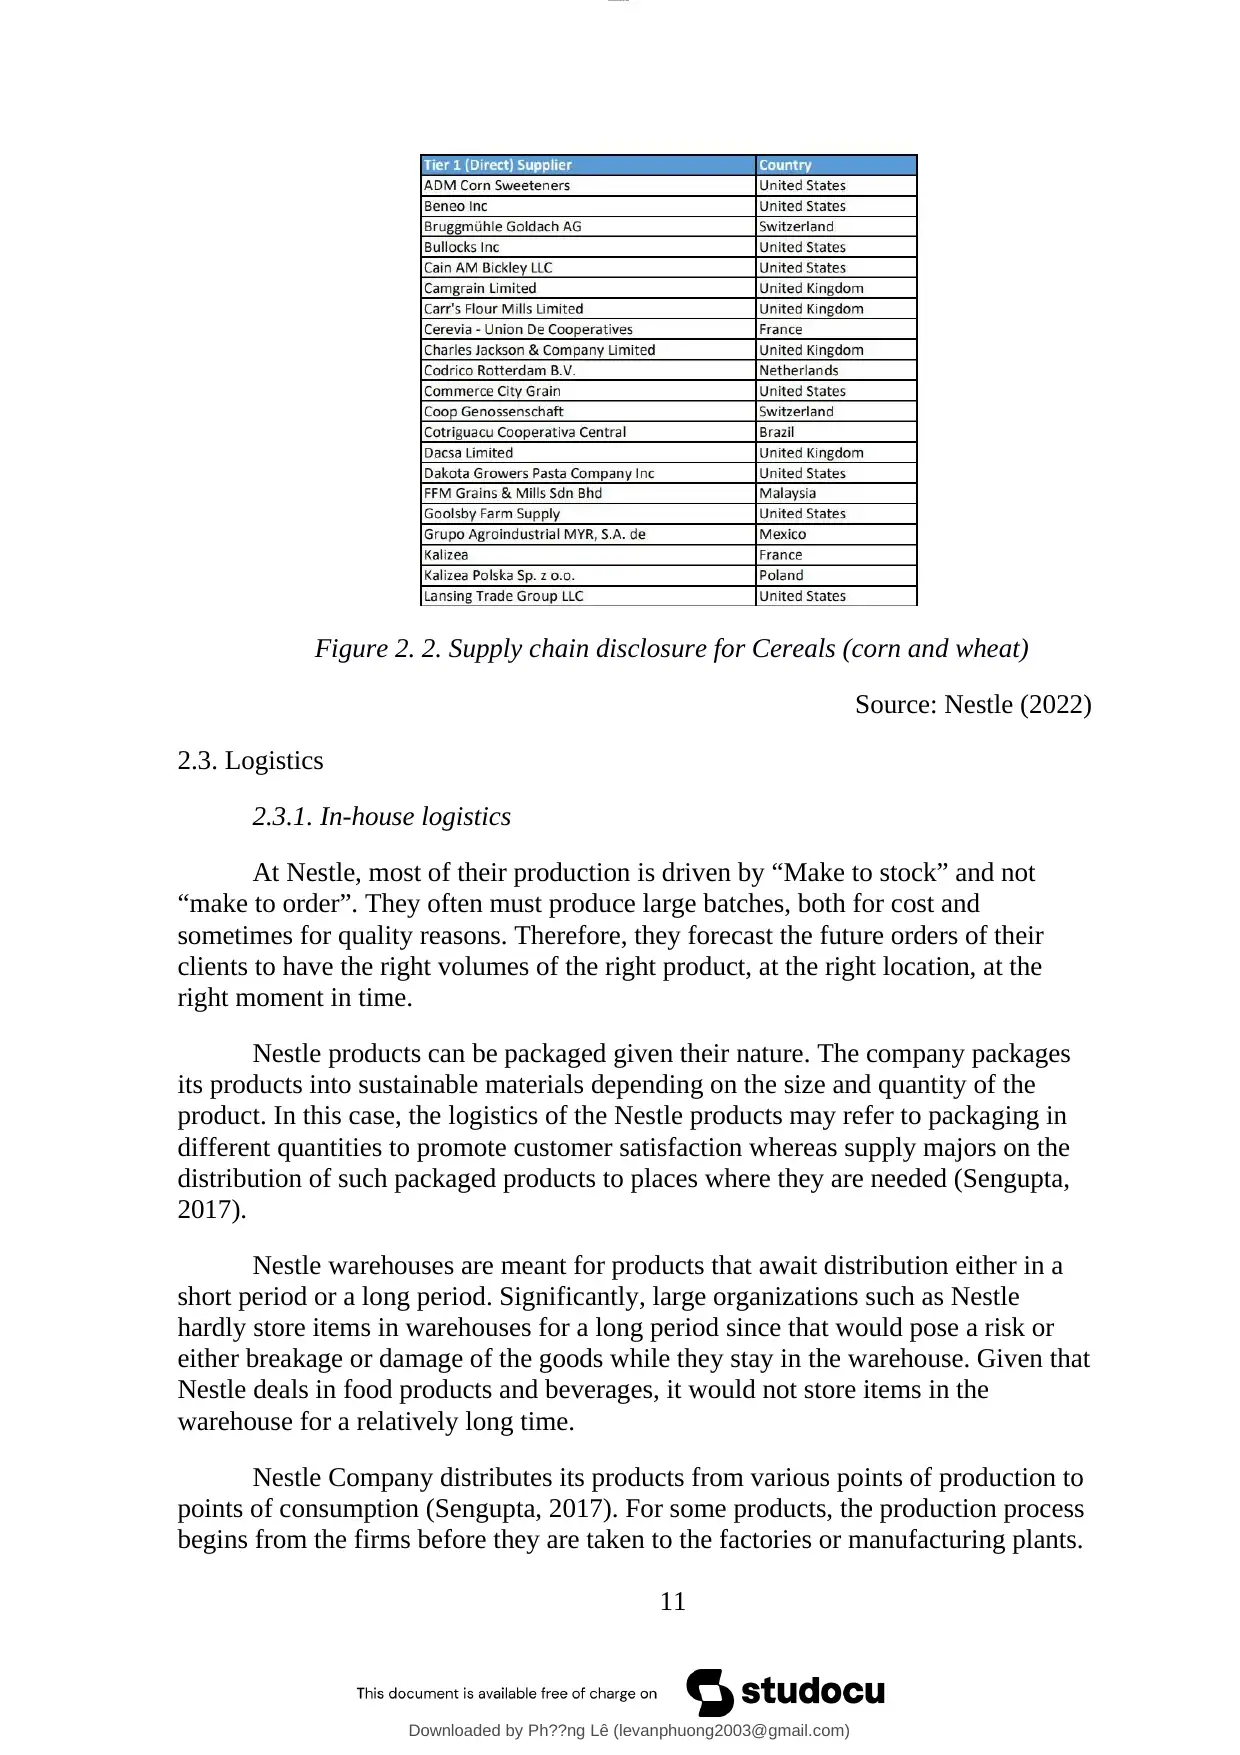
Figure 2. 2. Supply chain disclosure for Cereals (corn and wheat)
Source: Nestle (2022)
2.3. Logistics
2.3.1. In-house logistics
At Nestle, most of their production is driven by “Make to stock” and not
“make to order”. They often must produce large batches, both for cost and
sometimes for quality reasons. Therefore, they forecast the future orders of their
clients to have the right volumes of the right product, at the right location, at the
right moment in time.
Nestle products can be packaged given their nature. The company packages
its products into sustainable materials depending on the size and quantity of the
product. In this case, the logistics of the Nestle products may refer to packaging in
different quantities to promote customer satisfaction whereas supply majors on the
distribution of such packaged products to places where they are needed (Sengupta,
2017).
Nestle warehouses are meant for products that await distribution either in a
short period or a long period. Significantly, large organizations such as Nestle
hardly store items in warehouses for a long period since that would pose a risk or
either breakage or damage of the goods while they stay in the warehouse. Given that
Nestle deals in food products and beverages, it would not store items in the
warehouse for a relatively long time.
Nestle Company distributes its products from various points of production to
points of consumption (Sengupta, 2017). For some products, the production process
begins from the firms before they are taken to the factories or manufacturing plants.
11
Downloaded by Ph??ng Lê (levanphuong2003@gmail.com)
lOMoARcPSD|13574233
Secure Best Marks with AI Grader
Need help grading? Try our AI Grader for instant feedback on your assignments.
After the manufacturing plant, the consumer goods are taken to the warehouse
where the manager ought to monitor how they are sourced out of the facility to the
appropriate target market. A target market is a specific market in which the
customers of a particular product are located or expected to show up for the
purposes of trade.
Nestle focuses on distributing its products to restaurants, supermarkets, small
business owners, and other retailers. Availability of such goods to the
businessperson enables them to reach clients who buy the products and give
feedback. According to Marion, effective logistics management attempts to deliver
services and products to customers at an appropriate time (2013). Moreover,
effective logistics management involves adequate response to the customers’
feedback to further customer satisfaction. For Nestle, some customers make
whereas other customers purchase the goods as they arrive in the market. The
company has an obligation to satisfy both their needs regardless of the different
approaches that they use to access the market and receive the goods.
2.3.2. Reverse logistics
Nestle has managed return avoidance by reducing waste to 3.1% and
increasing reuse or recovery to 4.2% (Nestle, 2011). Nestle encourages customers to
return products for recycling purposes. Reverse logistics for Nestle is mainly used
for customer service reasons and the return flow. This means Nestlé has collected
and co-processed the equivalent amount of plastic as contained in the products sold
and prevented the further flow of plastic into landfills. By the end of 2020, an
estimated 40 tons of plastic waste have been collected, sorted and recycled or
incinerated. Once the plastic waste is collected, it will be sorted, weighed and
thereafter the recyclable plastic will be processed to produce other plastic products
of Nestle, while the non-recyclable plastic waste will be incinerated to release
energy via an environmentally friendly process. Nestle’s plastics waste management
initiative will also create income generating opportunities throughout the value
chain, for instance the local residents and the youth will benefit from the collection,
sorting, weighing and transportation services.
2.4. Operations
2.4.1. Supply chain management
Nestle strives to build a lean supply chain where emphasis is on wastage
reduction. Its subsidiaries can structure or develop their own supply chain within the
company wide policy and guidelines and in accordance with the needs of the
location’s business model, local business practices, market dynamics and business
cycles.
The current management structure at Nestle tends to revolve around GLOBE,
an initiative whose aim is to standardize the operations of all Nestle business units
all over the world. This entails the assurance that management of procurement, sales
12
Downloaded by Ph??ng Lê (levanphuong2003@gmail.com)
lOMoARcPSD|13574233
and distribution, factory operations, and administrative functions are being handled
through a single system.
In addition, a single information system was put in use across all its units by
eliminating the different enterprise planning systems and replacing them with a
single web-based mySAP.com software (Steinert-threlkeld, 2006). Due to its broad
network and product lines, fewer levels of information flow, and a flat and broad
span of control that encourages horizontal communication and accountability have
been favored. Under this management structure, a uniform process in the
manufacturing of Nestle products and a uniform mode of formatting and storing
data have been in place in all of Nestlé’s 200 units spread across all the continents
of the world.
2.4.2. Quality management
Superior quality is a competitive advantage and a joint effort by all parties in
the value chain is needed. Suppliers are therefore considered an important link in
this chain.
To achieve Nestlé’s objective of offering consumers high-quality nutritional
products, Nestle expects suppliers to guarantee the quality of the material/goods
they supply or the service they provide. Whenever possible, Nestlé’s goal is to be
able to rely on their suppliers’ competence and ability to implement jointly defined.
Lean manufacturing focuses on reducing the waste of resources used in the
production process. Therefore, the goal of Lean is to optimize the use of space,
equipment, human resources, materials and time. At Nestlé, this approach is called
Nestlé Continuous Excellence (NCE).
To reduce unwanted lead times and reduce defect rates, the company adopted
“just in time” (JIT) manufacturing as an overall strategy. JIT focuses on continuous
improvement of the manufacturing process, including streamlining the process and
making efficient use of time resources. The JIT concept only allows the firm to
prepare enough materials for each weekend to prepare the input material for the
following production cycle in terms of raw materials inventory control. To minimize
delivery delays, Nestlé built a new storage area adjacent to the completed product
warehouse. Furthermore, after being released from the warehouse, the finished
pallets must be positioned in the proper location before being loaded onto the truck.
2.4.3. Inventory management
The inventory of Nestle is managed by a software called SAP (System
Applications and Products).
A 1997 survey found a series of unnecessary wastes with this inconsistency.
Determined to solve that situation, in March 1998, Nestlé’s leadership came up with
a plan to improve the business’ ability to operate through an information
13
Downloaded by Ph??ng Lê (levanphuong2003@gmail.com)
lOMoARcPSD|13574233
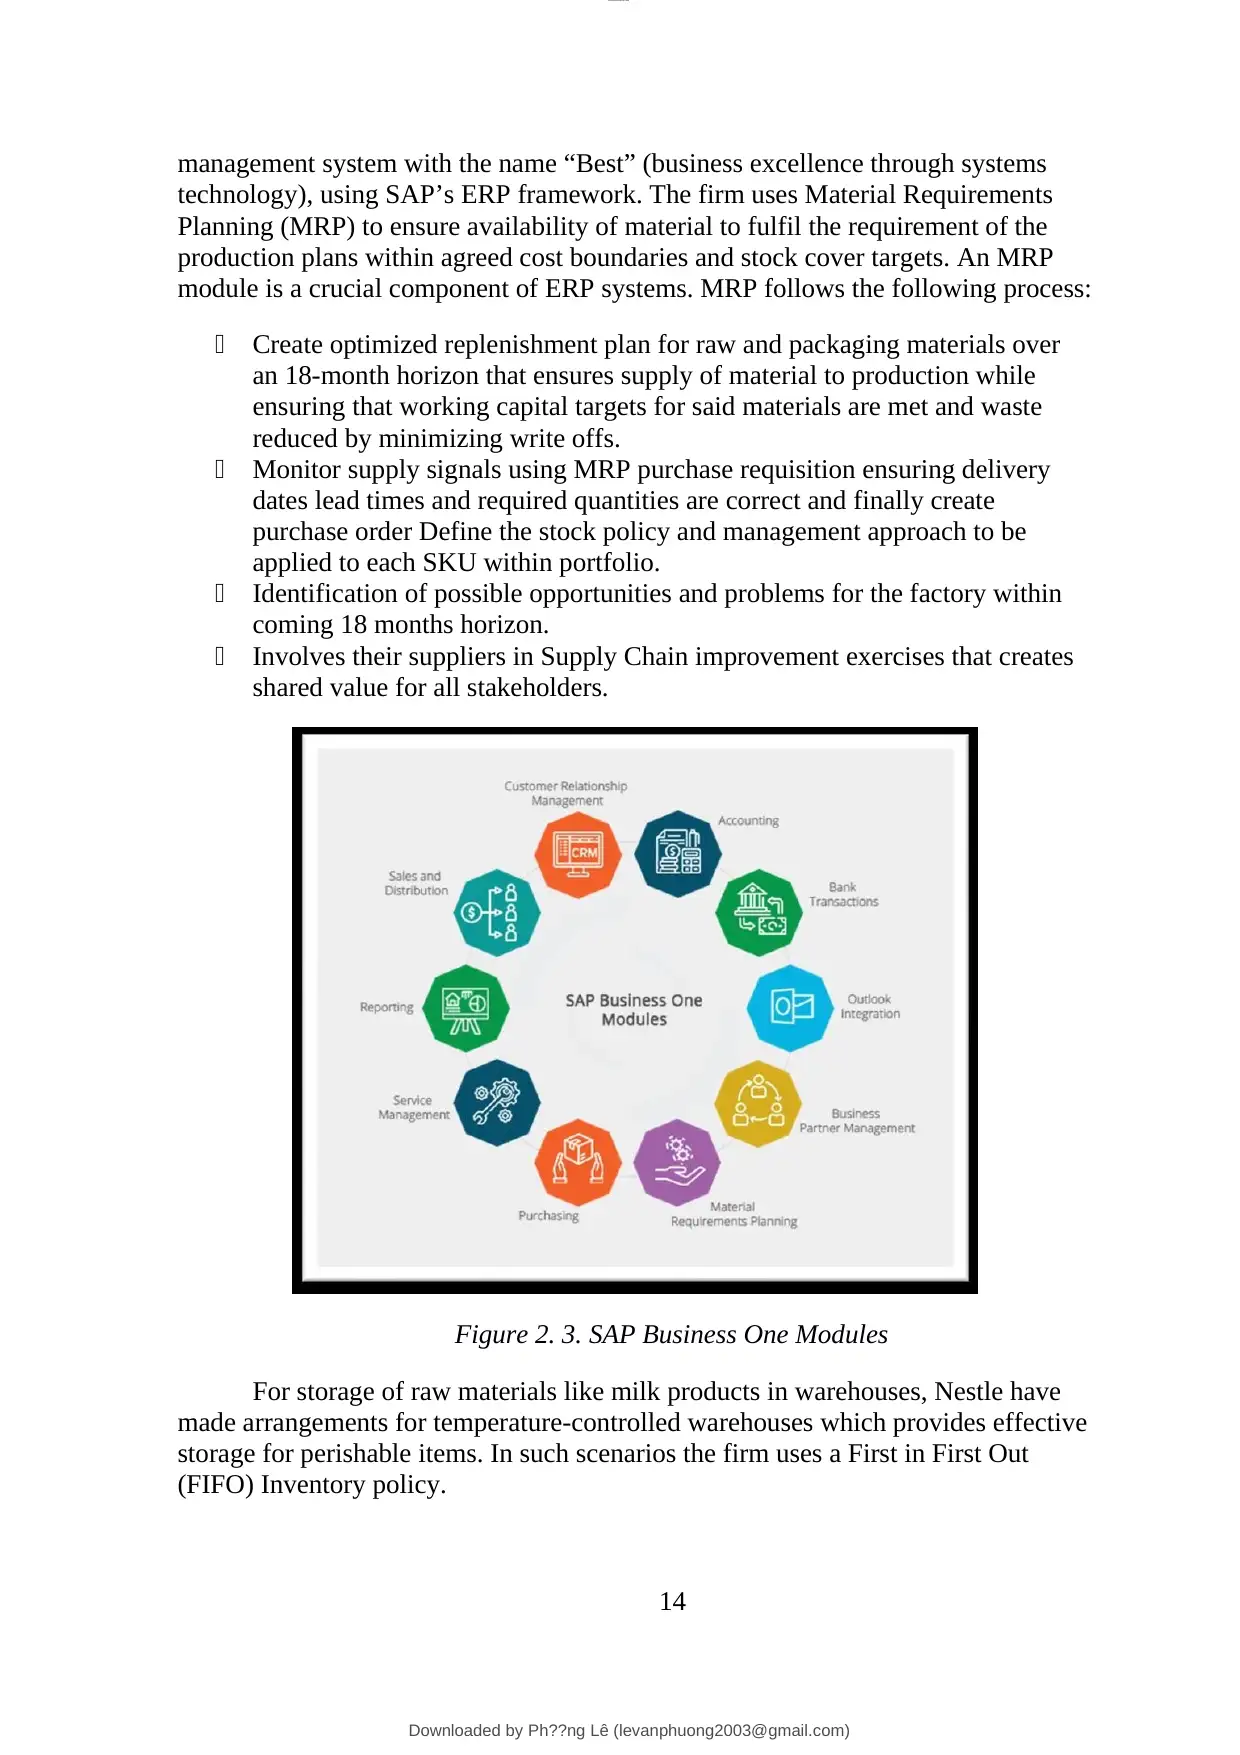
management system with the name “Best” (business excellence through systems
technology), using SAP’s ERP framework. The firm uses Material Requirements
Planning (MRP) to ensure availability of material to fulfil the requirement of the
production plans within agreed cost boundaries and stock cover targets. An MRP
module is a crucial component of ERP systems. MRP follows the following process:
Create optimized replenishment plan for raw and packaging materials over
an 18-month horizon that ensures supply of material to production while
ensuring that working capital targets for said materials are met and waste
reduced by minimizing write offs.
Monitor supply signals using MRP purchase requisition ensuring delivery
dates lead times and required quantities are correct and finally create
purchase order Define the stock policy and management approach to be
applied to each SKU within portfolio.
Identification of possible opportunities and problems for the factory within
coming 18 months horizon.
Involves their suppliers in Supply Chain improvement exercises that creates
shared value for all stakeholders.
Figure 2. 3. SAP Business One Modules
For storage of raw materials like milk products in warehouses, Nestle have
made arrangements for temperature-controlled warehouses which provides effective
storage for perishable items. In such scenarios the firm uses a First in First Out
(FIFO) Inventory policy.
14
Downloaded by Ph??ng Lê (levanphuong2003@gmail.com)
lOMoARcPSD|13574233
Paraphrase This Document
Need a fresh take? Get an instant paraphrase of this document with our AI Paraphraser
2.5. Market channels
2.5.1. Marketing
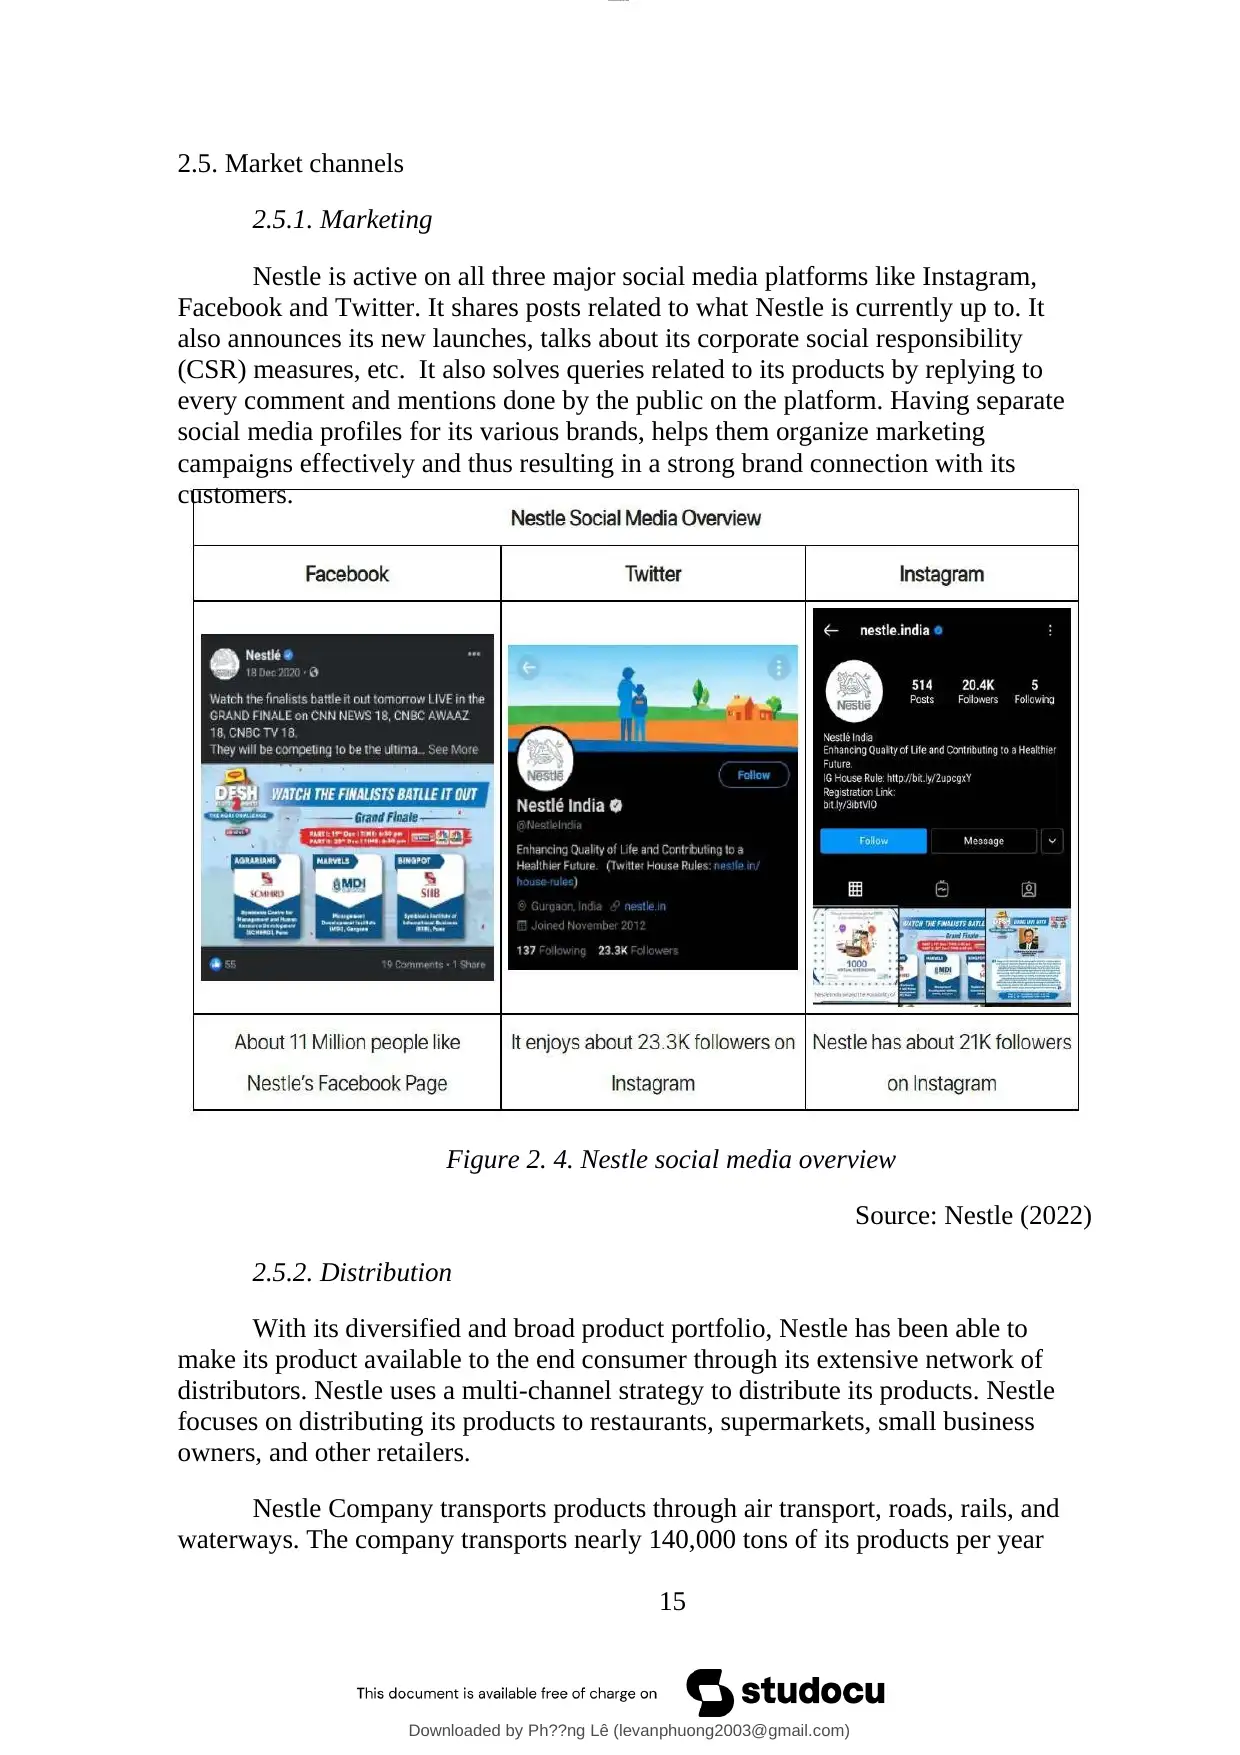
Nestle is active on all three major social media platforms like Instagram,
Facebook and Twitter. It shares posts related to what Nestle is currently up to. It
also announces its new launches, talks about its corporate social responsibility
(CSR) measures, etc. It also solves queries related to its products by replying to
every comment and mentions done by the public on the platform. Having separate
social media profiles for its various brands, helps them organize marketing
campaigns effectively and thus resulting in a strong brand connection with its
customers.
Figure 2. 4. Nestle social media overview
Source: Nestle (2022)
2.5.2. Distribution
With its diversified and broad product portfolio, Nestle has been able to
make its product available to the end consumer through its extensive network of
distributors. Nestle uses a multi-channel strategy to distribute its products. Nestle
focuses on distributing its products to restaurants, supermarkets, small business
owners, and other retailers.
Nestle Company transports products through air transport, roads, rails, and
waterways. The company transports nearly 140,000 tons of its products per year
15
Downloaded by Ph??ng Lê (levanphuong2003@gmail.com)
lOMoARcPSD|13574233
2.5.1. Marketing
Nestle is active on all three major social media platforms like Instagram,
Facebook and Twitter. It shares posts related to what Nestle is currently up to. It
also announces its new launches, talks about its corporate social responsibility
(CSR) measures, etc. It also solves queries related to its products by replying to
every comment and mentions done by the public on the platform. Having separate
social media profiles for its various brands, helps them organize marketing
campaigns effectively and thus resulting in a strong brand connection with its
customers.
Figure 2. 4. Nestle social media overview
Source: Nestle (2022)
2.5.2. Distribution
With its diversified and broad product portfolio, Nestle has been able to
make its product available to the end consumer through its extensive network of
distributors. Nestle uses a multi-channel strategy to distribute its products. Nestle
focuses on distributing its products to restaurants, supermarkets, small business
owners, and other retailers.
Nestle Company transports products through air transport, roads, rails, and
waterways. The company transports nearly 140,000 tons of its products per year
15
Downloaded by Ph??ng Lê (levanphuong2003@gmail.com)
lOMoARcPSD|13574233
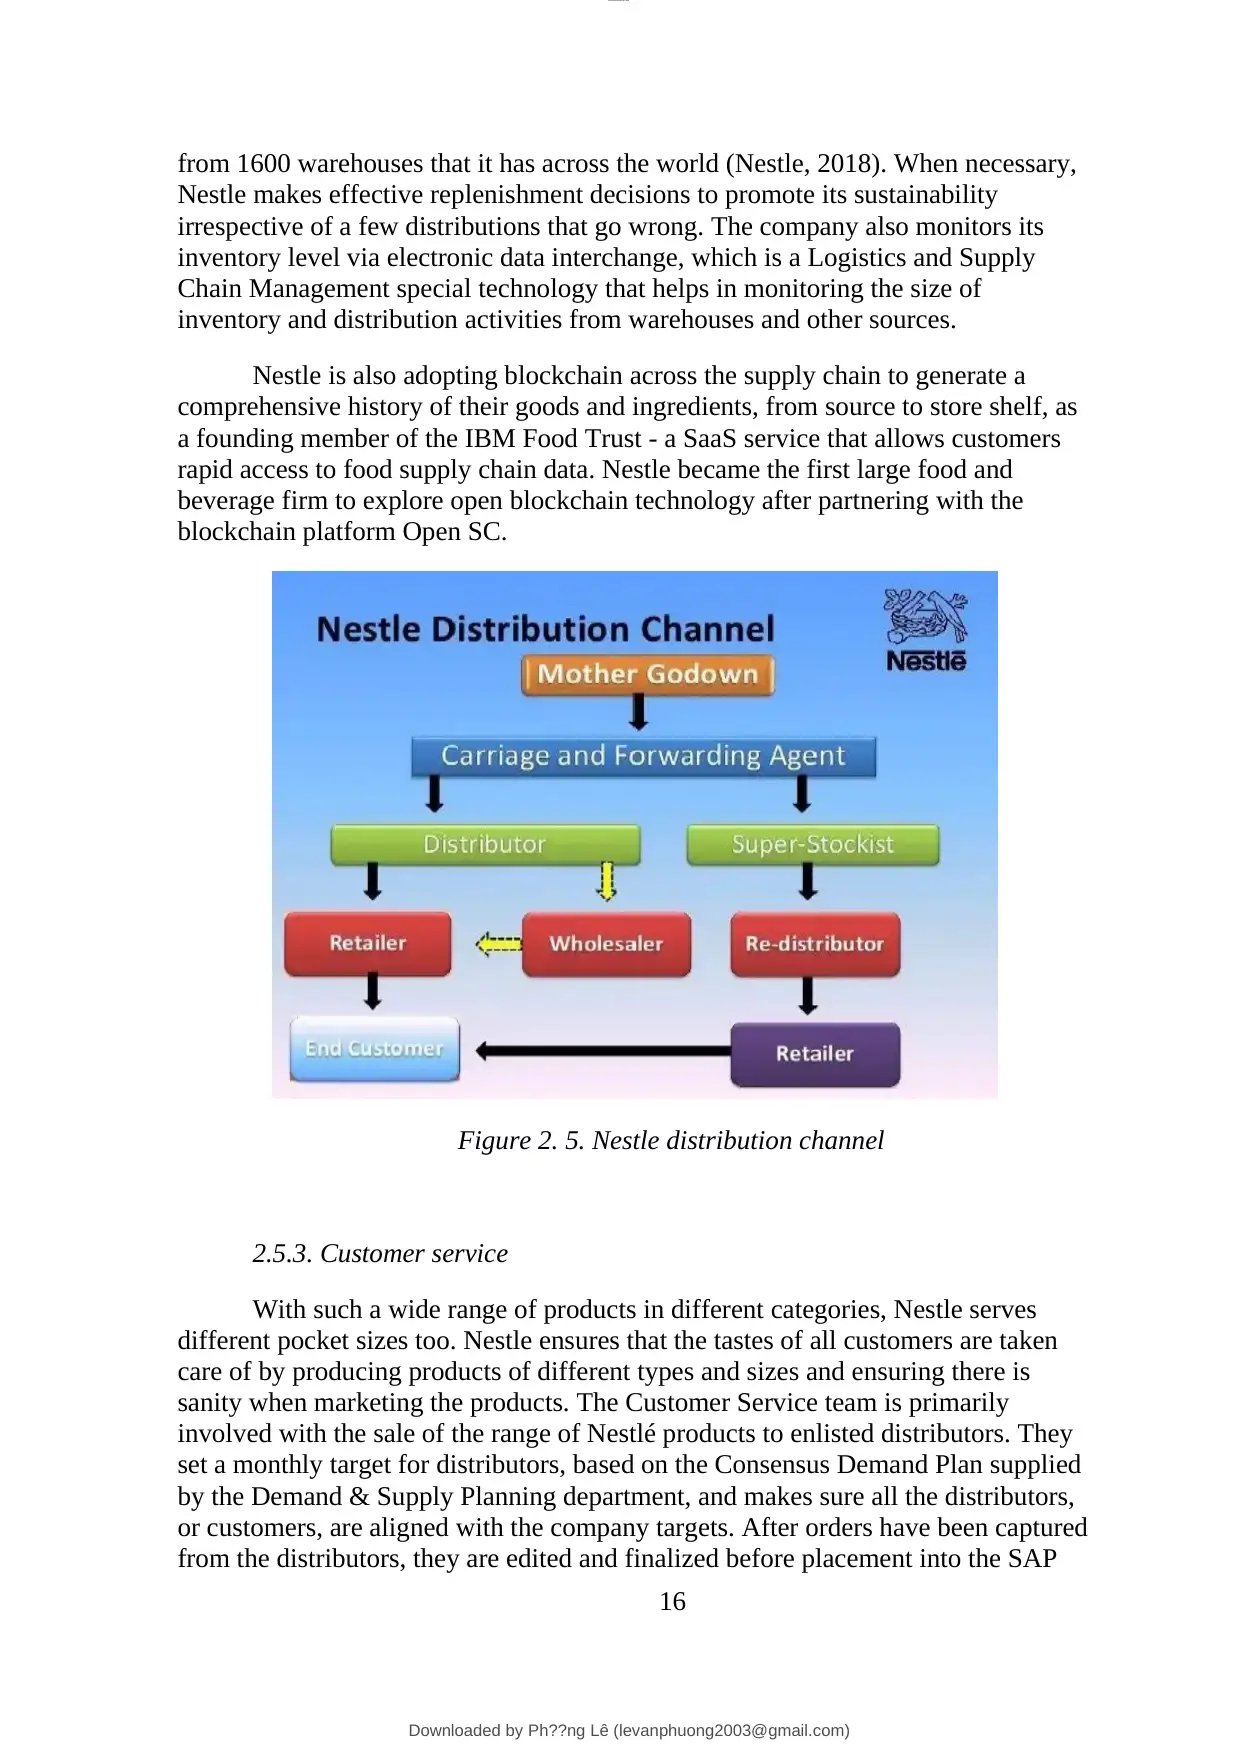
from 1600 warehouses that it has across the world (Nestle, 2018). When necessary,
Nestle makes effective replenishment decisions to promote its sustainability
irrespective of a few distributions that go wrong. The company also monitors its
inventory level via electronic data interchange, which is a Logistics and Supply
Chain Management special technology that helps in monitoring the size of
inventory and distribution activities from warehouses and other sources.
Nestle is also adopting blockchain across the supply chain to generate a
comprehensive history of their goods and ingredients, from source to store shelf, as
a founding member of the IBM Food Trust - a SaaS service that allows customers
rapid access to food supply chain data. Nestle became the first large food and
beverage firm to explore open blockchain technology after partnering with the
blockchain platform Open SC.
Figure 2. 5. Nestle distribution channel
2.5.3. Customer service
With such a wide range of products in different categories, Nestle serves
different pocket sizes too. Nestle ensures that the tastes of all customers are taken
care of by producing products of different types and sizes and ensuring there is
sanity when marketing the products. The Customer Service team is primarily
involved with the sale of the range of Nestlé products to enlisted distributors. They
set a monthly target for distributors, based on the Consensus Demand Plan supplied
by the Demand & Supply Planning department, and makes sure all the distributors,
or customers, are aligned with the company targets. After orders have been captured
from the distributors, they are edited and finalized before placement into the SAP
16
Downloaded by Ph??ng Lê (levanphuong2003@gmail.com)
lOMoARcPSD|13574233
system, where they develop the outbound delivery report for each order. They are
accumulated to form the shipping plan, which is transferred to the Distribution
Centre, who processes the order, loads the vehicles and dispatches them to all the
customers across the market.
III. DESCRIPTION OF NESTLE’S GLOBAL BUSINESS STRATEGY
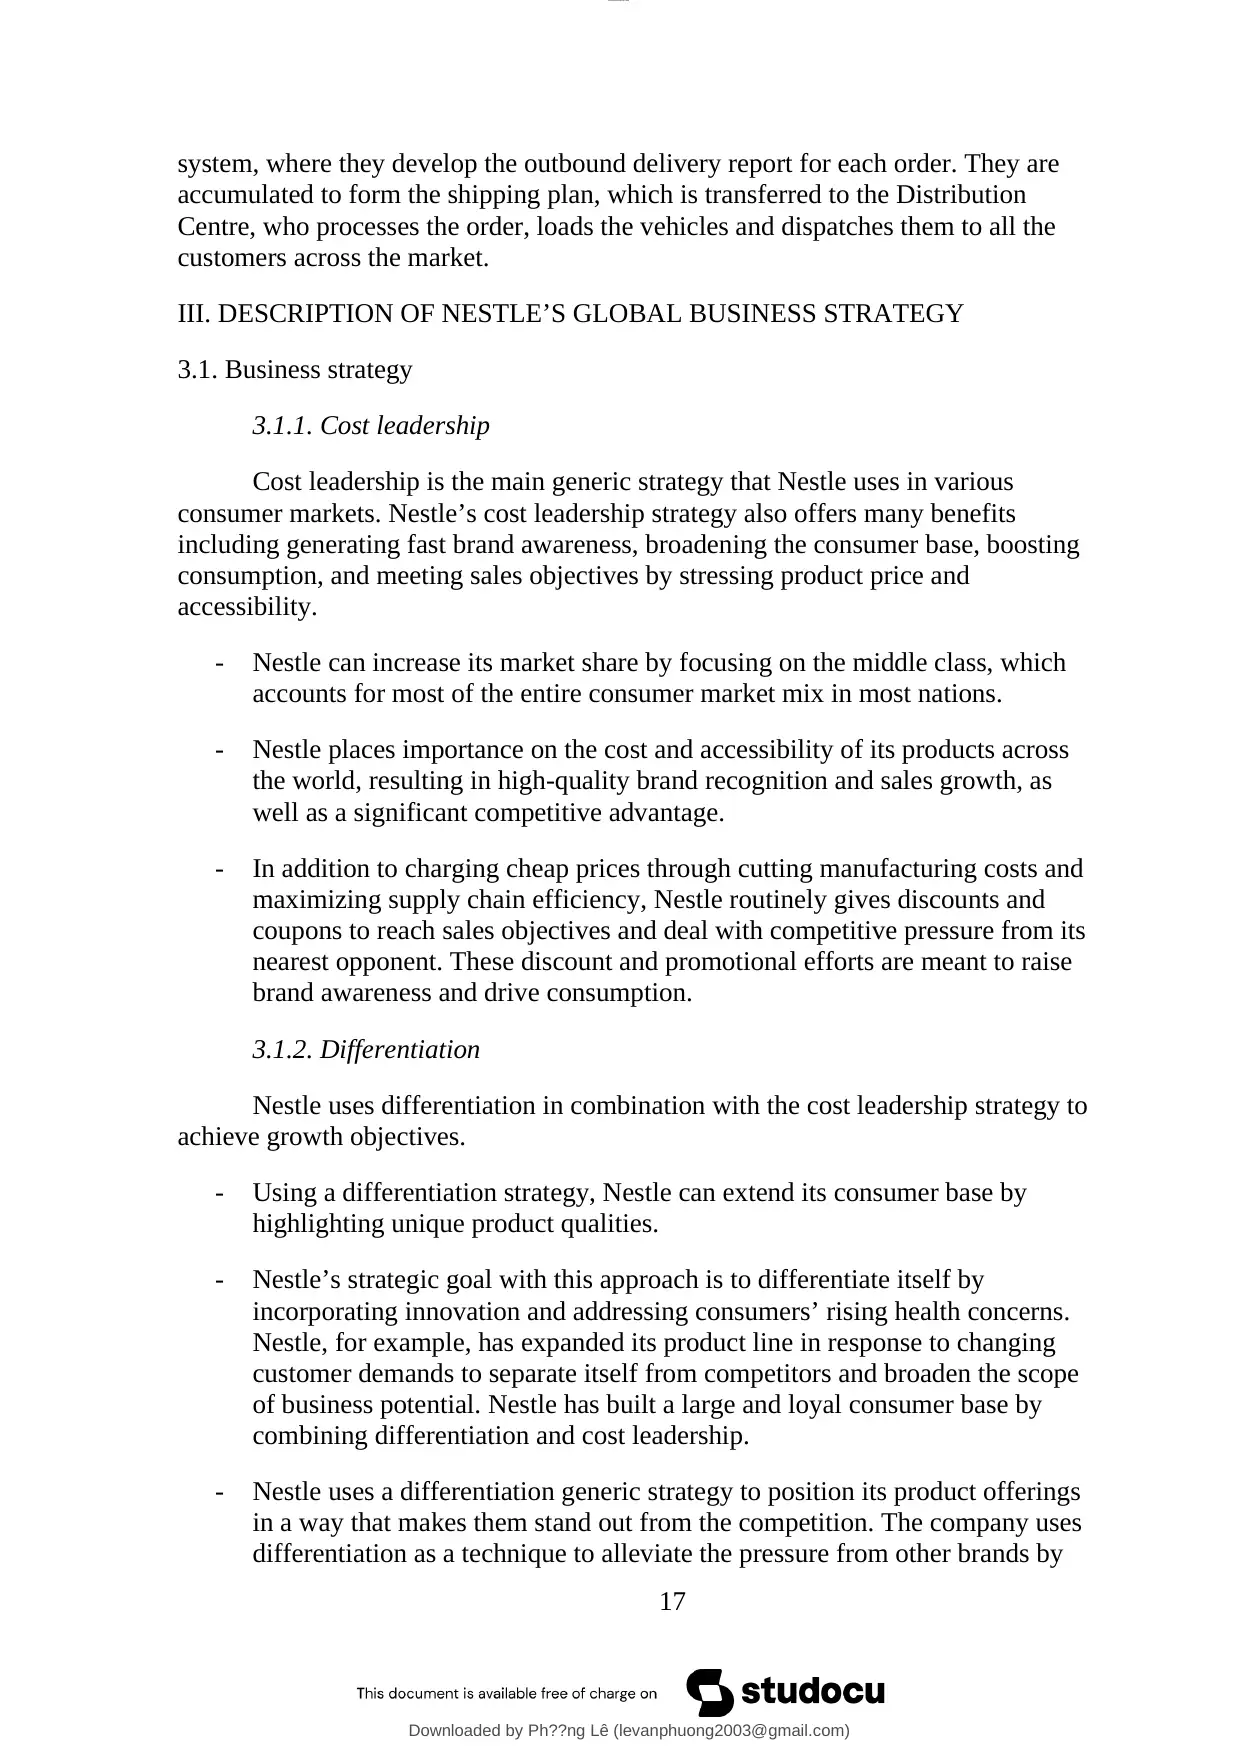
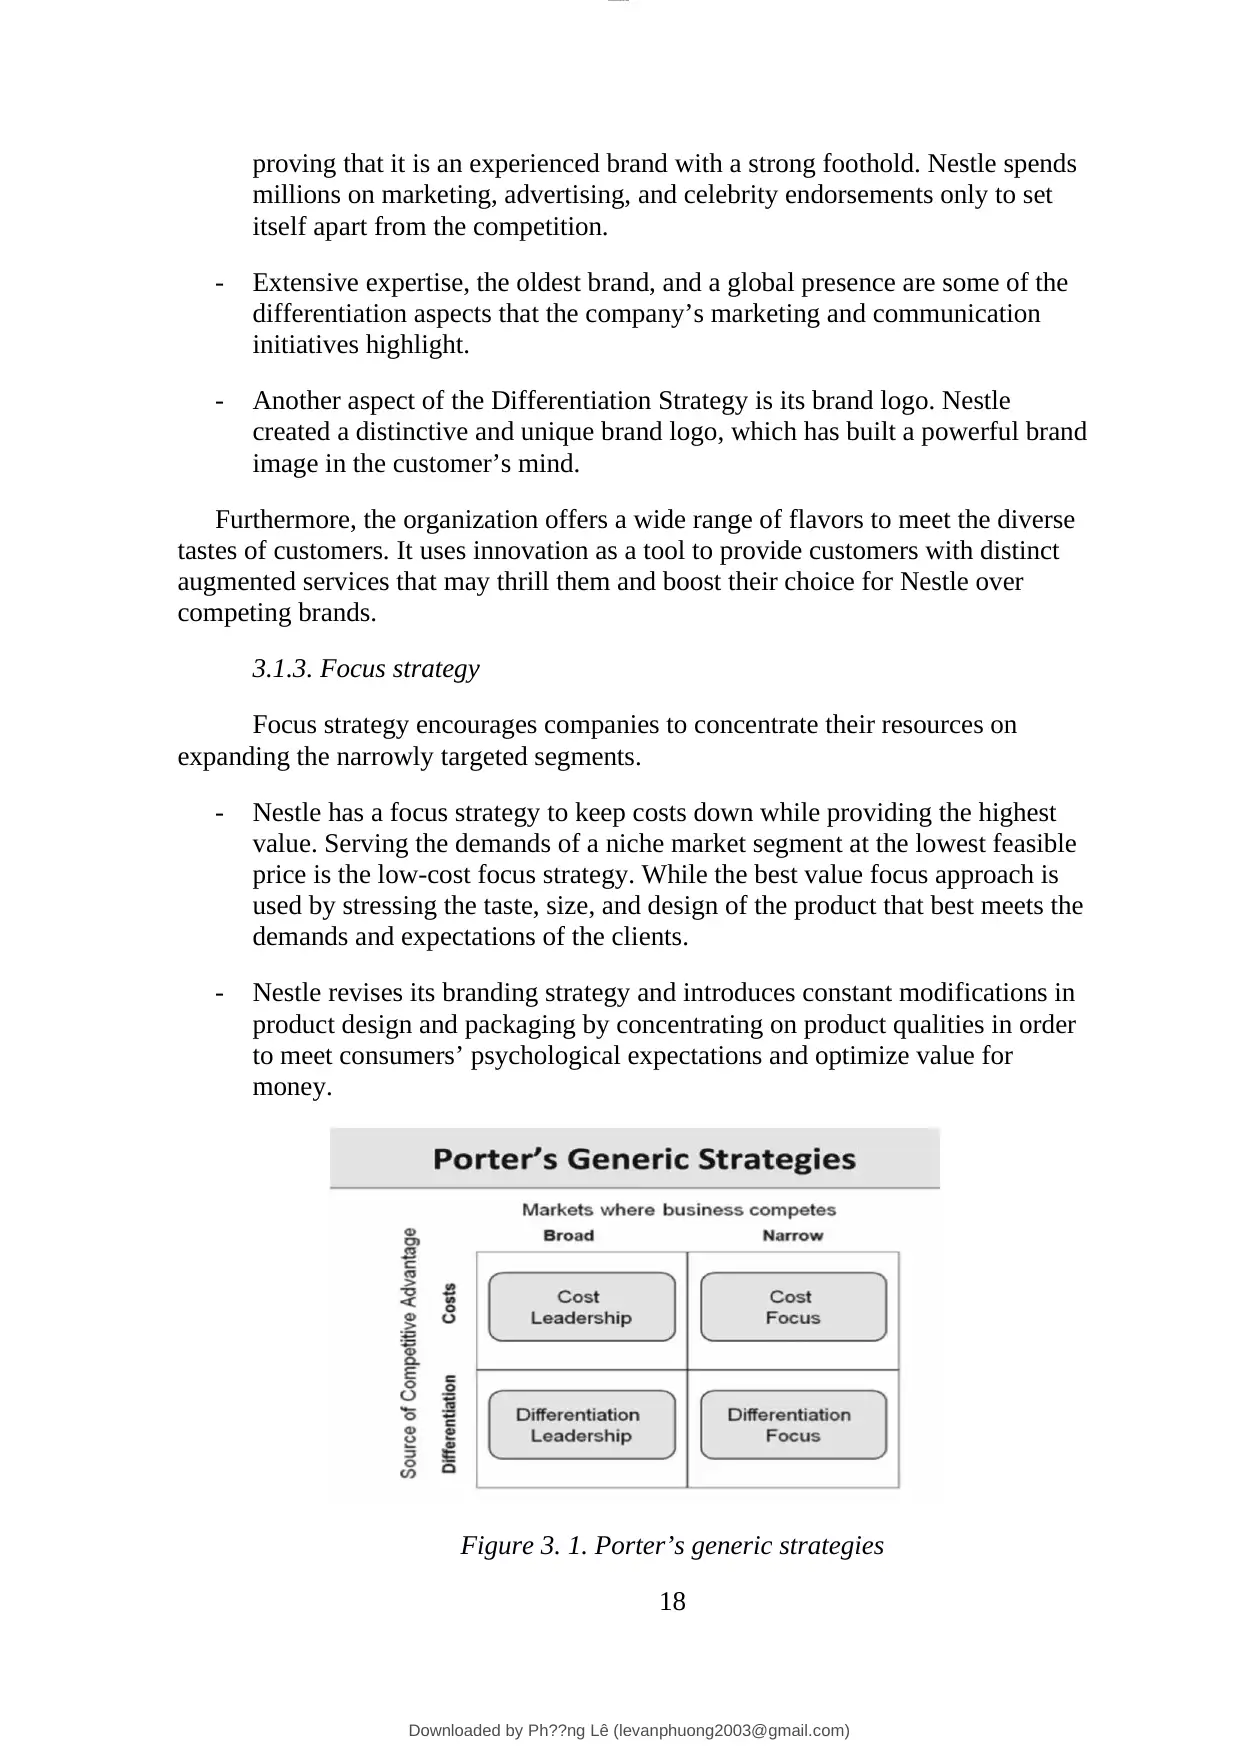
3.1. Business strategy
3.1.1. Cost leadership
Cost leadership is the main generic strategy that Nestle uses in various
consumer markets. Nestle’s cost leadership strategy also offers many benefits
including generating fast brand awareness, broadening the consumer base, boosting
consumption, and meeting sales objectives by stressing product price and
accessibility.
- Nestle can increase its market share by focusing on the middle class, which
accounts for most of the entire consumer market mix in most nations.
- Nestle places importance on the cost and accessibility of its products across
the world, resulting in high-quality brand recognition and sales growth, as
well as a significant competitive advantage.
- In addition to charging cheap prices through cutting manufacturing costs and
maximizing supply chain efficiency, Nestle routinely gives discounts and
coupons to reach sales objectives and deal with competitive pressure from its
nearest opponent. These discount and promotional efforts are meant to raise
brand awareness and drive consumption.
3.1.2. Differentiation
Nestle uses differentiation in combination with the cost leadership strategy to
achieve growth objectives.
- Using a differentiation strategy, Nestle can extend its consumer base by
highlighting unique product qualities.
- Nestle’s strategic goal with this approach is to differentiate itself by
incorporating innovation and addressing consumers’ rising health concerns.
Nestle, for example, has expanded its product line in response to changing
customer demands to separate itself from competitors and broaden the scope
of business potential. Nestle has built a large and loyal consumer base by
combining differentiation and cost leadership.
- Nestle uses a differentiation generic strategy to position its product offerings
in a way that makes them stand out from the competition. The company uses
differentiation as a technique to alleviate the pressure from other brands by
17
Downloaded by Ph??ng Lê (levanphuong2003@gmail.com)
lOMoARcPSD|13574233
accumulated to form the shipping plan, which is transferred to the Distribution
Centre, who processes the order, loads the vehicles and dispatches them to all the
customers across the market.
III. DESCRIPTION OF NESTLE’S GLOBAL BUSINESS STRATEGY
3.1. Business strategy
3.1.1. Cost leadership
Cost leadership is the main generic strategy that Nestle uses in various
consumer markets. Nestle’s cost leadership strategy also offers many benefits
including generating fast brand awareness, broadening the consumer base, boosting
consumption, and meeting sales objectives by stressing product price and
accessibility.
- Nestle can increase its market share by focusing on the middle class, which
accounts for most of the entire consumer market mix in most nations.
- Nestle places importance on the cost and accessibility of its products across
the world, resulting in high-quality brand recognition and sales growth, as
well as a significant competitive advantage.
- In addition to charging cheap prices through cutting manufacturing costs and
maximizing supply chain efficiency, Nestle routinely gives discounts and
coupons to reach sales objectives and deal with competitive pressure from its
nearest opponent. These discount and promotional efforts are meant to raise
brand awareness and drive consumption.
3.1.2. Differentiation
Nestle uses differentiation in combination with the cost leadership strategy to
achieve growth objectives.
- Using a differentiation strategy, Nestle can extend its consumer base by
highlighting unique product qualities.
- Nestle’s strategic goal with this approach is to differentiate itself by
incorporating innovation and addressing consumers’ rising health concerns.
Nestle, for example, has expanded its product line in response to changing
customer demands to separate itself from competitors and broaden the scope
of business potential. Nestle has built a large and loyal consumer base by
combining differentiation and cost leadership.
- Nestle uses a differentiation generic strategy to position its product offerings
in a way that makes them stand out from the competition. The company uses
differentiation as a technique to alleviate the pressure from other brands by
17
Downloaded by Ph??ng Lê (levanphuong2003@gmail.com)
lOMoARcPSD|13574233
Secure Best Marks with AI Grader
Need help grading? Try our AI Grader for instant feedback on your assignments.
proving that it is an experienced brand with a strong foothold. Nestle spends
millions on marketing, advertising, and celebrity endorsements only to set
itself apart from the competition.
- Extensive expertise, the oldest brand, and a global presence are some of the
differentiation aspects that the company’s marketing and communication
initiatives highlight.
- Another aspect of the Differentiation Strategy is its brand logo. Nestle
created a distinctive and unique brand logo, which has built a powerful brand
image in the customer’s mind.
Furthermore, the organization offers a wide range of flavors to meet the diverse
tastes of customers. It uses innovation as a tool to provide customers with distinct
augmented services that may thrill them and boost their choice for Nestle over
competing brands.
3.1.3. Focus strategy
Focus strategy encourages companies to concentrate their resources on
expanding the narrowly targeted segments.
- Nestle has a focus strategy to keep costs down while providing the highest
value. Serving the demands of a niche market segment at the lowest feasible
price is the low-cost focus strategy. While the best value focus approach is
used by stressing the taste, size, and design of the product that best meets the
demands and expectations of the clients.
- Nestle revises its branding strategy and introduces constant modifications in
product design and packaging by concentrating on product qualities in order
to meet consumers’ psychological expectations and optimize value for
money.
Figure 3. 1. Porter’s generic strategies
18
Downloaded by Ph??ng Lê (levanphuong2003@gmail.com)
lOMoARcPSD|13574233
3.2. Intensive Strategy
3.2.1. Market Penetration
Market Penetration involves encouraging sales growth within the current
customer base. It includes the activities used to increase the market share by
focusing on an existing product in the existing market
Market penetration is the primary intensive growth strategy adopted by
Nestle to accomplish the growth objectives.
In fact, Nestle lowered the prices through cost leader strategy and used
different marketing and promotion campaigns to increase the sales voice in the
existing market. In addition, Nestle provides the product in new, appealing
packaging in order to meet sales targets while remaining in the same market. When
utilizing this method in a competitive consumer market, Nestle has used aggressive
marketing tactics.
During the early stages of expansion, market penetration strategy was critical
in ensuring Nestle’s success in its home market. Later, national recognition was
exploited to expand into other markets all over the world. Brand recognition
achieved via strong market penetration was also leveraged to introduce new items to
existing and potential customers.
3.2.2. Product Development
Product Development involves the development of new products or
modification in the current product lines to make them new to current customer
base.
Nestle has significantly expanded its product line since its beginnings, and its
product line has become too broad. It helps the firm to diversify its risks by
compensating for losses in one product line with profits in other product lines. At
this time, the company serves more than Competitor product brands all over the
world. Product development is a crucial strategy for gaining new clients.
● Nestle has three major options when it comes to new product development:
- First is to introduce new items that are closely related to existing product
lines.
- Second, introduce new items that are in line with current customers’
purchasing habits.
- Third is to create new items that complement or innovate existing ones.
Nestle is able to effectively offer new goods by continuously assessing the
demands of its customers.
19
Downloaded by Ph??ng Lê (levanphuong2003@gmail.com)
lOMoARcPSD|13574233
3.2.3. Market Development
Market Development identifies and develop new market segments for current
products.
The corporation continues to invest in research and development to extend its
distribution network to cover every corner of the world, particularly in
underdeveloped nations where it now has a weak presence. However, because a
corporation has already established itself in most of the world’s marketplaces,
market growth is now only a supporting strategy with secondary significance.
When entering new geographic locations, Nestle recognizes the necessity of
understanding culture and incorporating local customs and values into marketing
initiatives. Nestle has been able to win popularity in culturally diverse consumer
markets thanks to its high cultural intelligence. Companies must also perform
extensive competitive and market information to implement this approach
effectively.
3.2.4. Diversification
Diversification involves entering new markets with new products.
Nestle’s portfolio diversification is aided by its cost leadership generic
growth strategy, which enables the company to pursue new product opportunities in
new markets while minimizing costs. Additionally, the company’s existing
infrastructure allows it to pursue new product opportunities in new markets.
The diversification intense growth strategy’s strategic goal is to extend the
portfolio through successful acquisition techniques. Due to risk concerns, the
corporation concentrates on linked diversification and avoids hazardous initiatives
into new areas. Rather, the corporation takes use of its brand’s recognition and
power to create complementary items in the worldwide beverage sector. However,
Nestle’s unconnected diversification includes selling everything from refrigerators
to shirts to glasses to pencils.
After studying market trends and evolving client demands, the relevant
diversification plan is implemented by purchasing lucrative firms. For example, in
response to mounting criticism from environmental organizations, the firm sought
to offset the loss from dropping sales by investing in green business practices and
forming commercial relationships with partners that shared the company’s good
brand image.
3.3. Sustainable Strategy
The chair and executive officer of Nestle USA promise to strive for a more
sustainable future toward a healthier planet, a stronger society and a thriving
economy. Nestle pays attention to greenhouse gas (GHG) emissions, waste-free
products. That is why Nestle was expanding on its previous work to set ambitious
20
Downloaded by Ph??ng Lê (levanphuong2003@gmail.com)
lOMoARcPSD|13574233
Paraphrase This Document
Need a fresh take? Get an instant paraphrase of this document with our AI Paraphraser
goals that would truly make a difference, and why it was always looking for new
and innovative methods to achieve them in its market.
Nestle SA has announced new commitments and initiatives in the United
States, including the testing of electric vehicles in Ohio, as part of the company’s
larger ambition to reduce greenhouse gas (GHG) emissions by half by 2030 and
achieve net zero by 2050.
Nestle is one of the first companies to sign up to the United Nations’
Business Ambition for 1.5°C pledge, pledging to share its precise plan for reaching
net zero GHG emissions. Nestle wants to accelerate current activities, adapt its
operations, and find solutions to balance remaining emissions through high-quality
carbon removal projects or innovation as part of its plan.
IV. CONTRIBUTION OF NESTLE’S SUPPLY CHAIN MANAGEMENT TO
ITS GLOBAL BUSINESS STRATEGY IMPLEMENTATION
4.1. Planning
4.1.1. Demand Planning
Nestlé’s adoption of SAS demand-driven planning has improved its forecast
accuracy and made multi-million-dollar reductions in its inventory by removing
human judgment and enabling the predicting of future demand.
SAS demand-driven planning has the capability to do forecasts for the short-
term and long-term. The Nestlé team wanted the ability to sense demand signals
associated with sales promotions, price, advertising, in-store merchandising and
economic factors to better understand what things influence consumers to buy their
products. Once they were able to measure that mathematically, they wanted to be
able to use that information to run ‘what-if’ scenarios to shape future demand.
When Nestlé’s sales and marketing people get together and want to run a sales
promotion, the system then calculates the unit lift that was associated with that
promotion in the past and tells them whether it was significant in driving
incremental demand, or unit demand. Once it does that it then goes out to the
financial system and determines whether it made any money. These promotional
plans are also used to drive the forecast used by the supply chain group to ensure
product is available to meet consumer demand. The sales teams have the capability
to measure the impact of in-store merchandising vehicles like end cap displays to
determine the incremental unit volume impact, as well as revenue impact within
designated market channels (e.g., retail grocery channel).
Forecast accuracy improvement drives safety stock, inventory days on hand,
storage costs and freight costs reduction. By gaining a few points of accuracy at the
national level you can generate supply chain savings immediately. With confidence
in the forecasts, Nestle are letting that number drive through the whole organization,
affecting what they produce, where they’re going to ship, all the way up to their top-
21
Downloaded by Ph??ng Lê (levanphuong2003@gmail.com)
lOMoARcPSD|13574233
line financial commitments. This drives all facets of Nestle’s business. With SAS
Demand-Driven Forecasting, Nestle is better able to accomplish their goal of right
flavor, right time, right store. It’s hard to put a price tag on it, but it is really
invaluable in terms of running the business effectively and better serving the
customer.
4.1.2. Supplier Planning
Having a commitment to Responsible Sourcing, Nestle has been working
with its suppliers to create a more sustainable and ethical future. Many
organizations are pursuing responsible and sustainable sourcing to improve their
image, but several are also realizing significant business value as a result.
Not long ago, Nestle announced that it would disclose its list of suppliers, as
well as other data, for its priority commodities. The purpose of the disclosure was to
be more transparent with consumers. It was the first disclosure of this type in the
industry. Nestle has also made a commitment to responsible sourcing, and its
blockchain capability will be key to demonstrating that commitment. Traceability
has enabled the company to confirm that 73% of its total spend for its most
important ingredients qualifies as "responsibly sourced," which means the spending
aligns with an extensive list of guidelines established by the company’s Responsible
Sourcing Standard. Among its other initiatives, the company is monitoring over
86,000 children who are at risk of child labor and has helped more than 40,000
children access education. The company has established a "forest-positive"
approach to sourcing ingredients and plans to move toward 100% deforestation-free
ingredients by 2022.
4.2. Procurement
4.2.1. E-procurement
Procurement remains one of the most essential functions as it forms the
initial stage of any business that will be conducted. Procurement is now focused on
innovation, involving lots of collaborations, partnership monitoring with values on
the organizational goals, which requires constant, accelerated pace of change
especially in leadership, talent and innovation within the management of the Supply
Chain. Nestle has taken this idea into account by entering e-procurement. The
efficiency of production will be attributed to the kind and quality of inputs used
which will as well affect the quality of the products released to the market. The
contract entered between Nestle and Free Markets Inc. was aimed at providing
Nestle access to its B2B (Business to Business) Global Marketplace to source goods
across the American market for use in its operation. A well-established procurement
outsourcing allows the suppliers to be effective, while effective communication that
allows feedback on delivery date and quality helps in effective management of
inventory and output.
4.2.2. Sustainable procurement
22
Downloaded by Ph??ng Lê (levanphuong2003@gmail.com)
lOMoARcPSD|13574233
Nestle works with 81 dairy farms in the UK and are part of the Farmer
Connect program, helping farmers to implement sustainable practices on the
ground. Farmers are paid a premium for implementing practices such as tree
planting, conservation of ancient woodland, fencing off water courses and
improving soil health. On a global scale, Nestle have implemented a Traceability
Program in which twelve high-risk commodities have been identified and traced
back to farms or plantation. Their responsible sourcing audit program was written
using UN principles, and the company collaborates with suppliers to close gaps in
the standards it lays out. By 2025, Nestle wants all of their packaging to be
reusable/ recyclable as part of a closed loop system. There is an infrastructure
challenge that needs to be worked around, as different councils collect different
things. Processing could also be made easier, for example by not using black
plastics. As a whole, the company aims to be net zero by 2050. In terms of
improving energy efficiency, water efficiency and waste management, Nestle
initially focused on their own operations. They started this journey in 2007 and set
core reduction targets for sites. Rather than classing energy reduction as a separate
task it was embedded into projects, and employees took ownership of opportunities.
Targets were set by mapping out energy usage across a site, drawing together data
and identifying opportunities for savings. The company now works with engineers
and operations to ensure environmental aspects are integrated into capital projects
from the beginning. Since 2007, energy efficiency has been improved by over 42%
and this is matched with savings of around £30million. They have clearly evidenced
the economic sense to taking this approach.
4.2.3. Advancing production and sourcing of raw materials
With ambitions to translate novel agricultural science into concrete
applications and identify the most promising agricultural technologies, Nestlé has
launched the Nestlé Institute of Agricultural Sciences. On a mission to achieve net
zero and transition towards a regenerative food system, Nestlé recognizes the
importance of large-scale changes in the way raw materials are produced and
sourced.
Nestlé’s new institute will focus on plant science, dairy livestock, and
agricultural systems science, and will assess and combine science-based solutions to
improve the nutritional and sensorial qualities of raw materials, as well as their
environmental impact. Nestlé plans to work in close collaboration with internal and
external partners on this project, such as academic institutions, research
organizations, start-ups, industry partners, and farmers. Nestle’s transition towards a
regenerative food system is enabled by agricultural science and new agricultural
technologies. The new institute will accelerate the translation of science into
concrete solutions that can be implemented at farm level, to support farmers
globally in improving their environmental footprint, in reducing food and nutrient
losses, and in better adapting to climate change while ensuring the quality of the
raw materials they produce.
23
Downloaded by Ph??ng Lê (levanphuong2003@gmail.com)
lOMoARcPSD|13574233
Secure Best Marks with AI Grader
Need help grading? Try our AI Grader for instant feedback on your assignments.
Nestlé also plans to work with external partners to help to reduce emissions
in dairy farming, develop regenerative agricultural practices, and improve
biodiversity and soil health. In addition, new approaches will be explored to upcycle
agricultural side streams to reduce the loss of nutrients and food waste along the
value chain.
4.3. Logistics
The company Nestle distributes its products from different points of
production to points of consumption. For some manufacturing operations, the
manufacturing process begins with companies before they are sent to factories or
manufacturing plants. After the factory is in production, the consumer goods are
taken to the warehouse, where the manager must keep track of how they are being
moved out of the facility to the appropriate target market. A target market is a
specific market in which customers of a particular product are or are expected to
appear for commercial purposes.
Nestle focuses on distributing its products to restaurants, supermarkets, small
business owners and other retailers. The availability of such goods to entrepreneurs
allows them to reach customers who buy products and give feedback. According to
Marion, effective logistics management strives to deliver services and products to
customers at the right time (2013). For Nestle, some customers place an order
while others make a purchase when they arrive at the market. The company has an
obligation to meet the needs of both people regardless of whether they use different
approaches to market access and receive goods.
Efficient logistics management is said to be one of the factors contributing to
Nestle’s huge profits at the end of a certain financial period. As mentioned earlier,
effective logistics management is concerned with customer satisfaction through
improving customer service in one way or another. Finally, effective logistics
management reduces transportation costs by making prudent shipping decisions.
Nestle typically ships perishable items via aircraft and ensures that they are kept
safely in refrigerators and other recommended safe places. Notably, Nestle ships
bulky goods that do not need urgent shipping to their various destination markets
because ocean freight is relatively cheap and saves transportation costs.
4.4. Operations
4.4.1. Supply chain management
Nestlé’s goal with GLOBE was simple: replace 14 different SAP enterprise-
planning systems, each in use in a different country, with a single set of factory and
administrative processes, backed by a single way of formatting and storing data, and
a single set of information systems for all of Nestlé’s businesses. Harmonize
procedures, standardize data, and standardize systems were the three foundation
edicts for Project GLOBE.
24
Downloaded by Ph??ng Lê (levanphuong2003@gmail.com)
lOMoARcPSD|13574233
Over the years, the GLOBE helps Nestle in many countries around the world
develop and expand significantly with profitable growth and reduced net working
capital. In Israel, the implementation of the project “Integrated Commercial
Planning: Nescafe" has increased market share from 37% to 41%; the total trade
spend has also been reduced by 2.5% during the first quarter of 2005. In France,
there has been a 25% reduction in database management time, 66% reduction in
data and a variety of new business opportunities identified. Moreover, in Turkey,
they applied the “Order to Cash" program and as a result, the customer service level
was increased by 6 points, along with the improved resolution time and customer
focus. Another example of GLOBE’s success was in Chile. The business improved
collection process yielded over US$200,000 in 2005. In southeast Africa, a
noticeable change is that the year-end book closing was reduced from 14 to 5 days
which means an amount of reduced cost approximately CHF 1 million with better
management information.
4.4.2. Embracing blockchain
Blockchain technology makes product distribution faster, more transparent,
and cost-effective. It also assists businesses in reducing risk and improving supplier
coordination. Moreover, open blockchain technology is crucial to establishing
universal awareness across the food supply chain. Because some of their partners
are unable to use proprietary blockchain technology, most organizations only have
limited access to their supply chains. Organizations large and small might join in an
open-source model, safely exchanging data points over a broad blockchain network
to establish a traceable system unequaled by other technology.
4.4.3. Inventory Management
With a steadfast spirit and a belief that slowly but surely will succeed, Nestle
has finally paid off. At the end of the project in 2002, the implementation of “Best”
via the aforementioned SAP’s ERP framework had lasted for 6 years, and cost more
than 200 million USD, exactly as originally planned.
Despite numerous errors that cost time and money, Nestlé estimates that the
savings through the new system amounted to $325 million at the end of 2002 –
which is more than the cost of the investment fees. And even without considering
the return on investment (ROI), the lessons Nestlé learned about implementing
ideas in businesses are very useful. Nestlé can estimate sales with relative accuracy
to the distribution center level by building a dependable demand forecasting system
based on a unified database and management procedure. When there is a variation
in the volume of goods at the storage stations, this minimizes storage expenses as
well as redistribution costs.
4.4.4. Sustainability in Nestle Operations
25
Downloaded by Ph??ng Lê (levanphuong2003@gmail.com)
lOMoARcPSD|13574233
To be able to survive and grow in the long run, Nestle places a high priority
on maintaining long-term sustainability in operation and business, and Lean
production is the tool that helps them do so.
Nestlé has implemented a series of solutions on the NCE platform to reduce
seven types of waste in the factory: wasted time and energy transporting materials;
wasted storage space for unused materials; unnecessary moves; wasting time
waiting between stages; waste due to repetition of actions; waste due to excess raw
materials and waste due to redoing stages; and defective products.
Through JIT, finished goods, work in progress, and raw materials needed are
kept to a minimum by ensuring that stockpiles are only used when needed and are
always prepared enough, and the financial resources spent on purchasing raw
materials will be converted into working capital to create added value for the
company. In addition, streamlining the production stages also helps Nestlé to limit
operations that can lead to errors in the production process, while reducing the time
to produce a product unit, improving productivity and bringing the best value for
money. effect through direct economics. The integrated solution of the
manufacturing and transportation processes has reduced space and time while also
allowing management to better manage raw material inventories.
In general, through the lean production process, Nestle not only receives
many economic benefits by increasing production efficiency and reducing waste,
but also creating a comfortable working environment as well as satisfying the needs
of customers. requirements for safety and welfare of workers.
4.5. Market channels
4.5.1. Marketing
Nestle always uses a form of communication associated with their products
and brands. Through its communication strategies, Nestle has conveyed messages to
customers and consumers. The firm has chosen to advertise each product one by one
to make it easier for customers to remember their products. Previously, when
Nescafe appeared in Vietnam, Nestle succeeded in using the image of a red coffee
cup in hand with a scent to help users remember forever. The communication
associated with each of these individual products has made Nescafe’s recognition to
a great extent. In Vietnam, Nescafe also has a large market share, even though
Vietnam is a strong coffee country.
Nestlé succeeds in interacting with real customers on social media as a
business. Their 850 Facebook accounts for diverse companies typically have 210
million fans. It is a great approach to get consumer feedback rapidly and effectively.
The firm publishes roughly 1,500 new items every day on the social web to achieve
a high degree of engagement. Understanding customers’ demands for a company’s
products is a prerequisite for running a business efficiently when it comes to the
global business plan of localization.
26
Downloaded by Ph??ng Lê (levanphuong2003@gmail.com)
lOMoARcPSD|13574233
Paraphrase This Document
Need a fresh take? Get an instant paraphrase of this document with our AI Paraphraser
4.5.2. Distribution
Currently, Europe and America are the two markets that bring the majority of
revenue for Nestle. Nestle chooses a distribution channel from the factory and sends
it to C&Fs (A kind of warehouse to store products), then sends to distributors and
finally, the retailers. Therefore, large distributors can completely get better
discounts.
Together with SAP System (business management software), an advanced
automation technology called Obiter Robot helps to optimize the area and double
the cargo capacity. Besides, the Radio Shuttle racking system will provide a much
safer, effective and cost-effective solution than traditional racking systems. In
addition, having a distribution center next to the factory also demonstrates a “one-
touch” mindset, keeping distribution costs competitive while providing the highest
quality products to customers.
In fact, if before, the logistics industry was defined by trucks and
warehouses, but over the years, new technologies have begun to change the logistics
landscape with the use of solutions of mobile, GPS, electronic toll collection,
electronic vehicle log... Besides, advancements in the industrial revolution 4.0 such
as blockchain and self-driving cars are shaping the future of logistics. According to
experts, modern technology increases productivity and reliability in Logistics
activities and Nestlé’s application of 4.0 technologies will help the company speed
up the transportation and preservation of goods and ensure the quality of products in
Vietnam. highest standards when supplying to the market.
4.5.3. Innovation
Customer satisfaction has always been the key to Supply Chain
Management’s performance, as well as a conduit for a company’s competitive edge
and profitability (Rosenthal, 2001). Additionally, coordinating all actions from the
time raw materials are sourced to the time completed products are delivered to the
user is time-consuming and can influence the usefulness of the items to the
consumer - having the appropriate product at the right time and in the right place.
As a result, Nestle believes it is critical to adopt a unified Supply Chain that
guarantees product quality is maintained at all times.
Lynne Xing, director of Nestlé China’s e-commerce supply chain operation
said that: “Nestlé believes that in the face of New Retail, the brand has been given
greater chances, particularly in three areas: brand innovation spurred by
consumption improvements, online-and-offline integration to provide consumers
with multi-sensory brand experiences, and data. When it comes to New Retail, it is
critical to discuss big data and how it’s driven by data”. Nestlé is focusing on
reorganizing its supply chain to take advantage of the benefits of New Retail.
According to Xing, by focusing on data, the firm was able to raise online
availability from less than 80% in 2017 to over 94 percent now.
27
Downloaded by Ph??ng Lê (levanphuong2003@gmail.com)
lOMoARcPSD|13574233
Nestlé uses a strategy called "Branding the Nestlé Way (Branding the Nestlé
Way - BBNW)" to develop products that appeal to people. Focusing on profiling
consumers using their brand is one of BBNW’s six core concepts. Nestlé is, in fact,
highly involved with its customers, particularly through digital means. The
organization does not stop at Market Research to reach out to customers in order to
identify the appropriate customers and manage purchases; instead, they aim to
locate the right customers and manage them in a local manner.
28
Downloaded by Ph??ng Lê (levanphuong2003@gmail.com)
lOMoARcPSD|13574233
REFERENCE
1. Andersen, O., & Kheam, L. S. (1998). Resource-based theory and
international growth strategies: an exploratory study. International Business
Review, 7(2), 163-184.
2. Ansoff, H. I. (1980). Strategic issue management. Strategic management
journal, 1(2), 131-148.
3. Baker, M. J. (2010). Growth Strategies. Wiley International Encyclopedia of
Marketing.
4. Clara A., Cristina H., Laura P. & Sara Z. (2018), Case study of Nestle,
Barcelona School of Management.
5. Eric Schroeder. (2020), Nestle strives to become more sustainable. Food
Business News.
6. Grant, D. A. (2017). Sustainable logistics and supply chain management:
Principles and practices for sustainable ... operations and management.
7. Hussain, S., Khattak, J., Rizwan, A., & Latif, M. A. (2013). ANSOFF matrix,
environment, and growth-an interactive triangle. Management and
Administrative Sciences Review, 2(2), 196-206.
8. Nils-Gerrit Wunsch (2022), Sales of Nestlé’s confectionery sector worldwide
2010-2021, by segment, Statista.
9. StudyCorgi. (2021). Supply Chain Management at Nestle. Retrieved from
https://studycorgi.com/supply-chain-management-at-nestle/
10. Michael Wilson (2017), Case Study: A Deep Dive into Nestle’s Supply Chain.
Afflink.
11. Marcel Baumgartner (2013), Wie Nestlé Statistische Prognosemodelle
benützt um Kunden und Konsumenten sichere und frische Produkte zu
liefern, SAS Forum Switzerland.
12. Morrison, A., & Wensley, R. (1991). Boxing up or boxed in? A short history
of the Boston Consulting Group share/growth matrix. Journal of Marketing
Management, 7(2), 105-129
13. PV. (2019). Vân hành trung tâm phân phối: Bước đi chiến lược của Nestlé
Việt Nam. Vietnam+.
14. ProcureConEast. (2021). How Nestle Maintained a “Robust" Supply Chain
in 2020 and Prepared Itself for the Future.
29
Downloaded by Ph??ng Lê (levanphuong2003@gmail.com)
lOMoARcPSD|13574233
Secure Best Marks with AI Grader
Need help grading? Try our AI Grader for instant feedback on your assignments.
15. Taylor, E. C. (2012). Competitive improvement planning: using Ansoff’s
matrix with Abell’s model to inform the strategic management process. In
Allied Academies International Conference. Academy of Strategic
Management. Proceedings (Vol. 11, No. 1, p. 21). Jordan Whitney
Enterprises, Inc.
16. Thanh Le. (2015). Triển Khai Dự Án ERP Dài Hơi _ Câu Chuyện của
Nestle USA. TRG International.
17. Rahman, K. M. (2016). Strategic Planning and Marketing Models. In
Strategic Marketing Management in Asia: Case Studies and Lessons across
Industries (pp. 59-110). Emerald Group Publishing Limited.
18. Reed, R., & Luffman, G. A. (1986). Diversification: The growing confusion.
Strategic Management Journal, 7(1), 29-35.
19. Rosenthal, B. E. (2001) Supply Chain Management: Nestle is Quick to Adopt
EProcument. (Online). OutsourcingCenter.
20. Varadarajan, P. (1983). Intensive growth opportunities: An extended
classification. California Management Review, 25(3), 118-132.
21. Vrontis, D., & Sharp, I. (2003). The strategic positioning of Nestle in their
global marketing operation. The Marketing Review, 3(3), 289-309.
22. Master, N. (2013). Nestle incorporates warehouse logistics to improve the
coffee supply chain.
23. Rosenthal, B. E. (2001) Supply Chain Management: Nestle is Quick to
Adopt E Procurement.
24. Steinert-Threlkeld, T. (2006) Nestlé Pieces Together Its Global Supply
Chain.
25. Odeh, M. A., & Smallwood, J. (2012). Sustainable supply chain
management: Literature review, trends, and framework
30
Downloaded by Ph??ng Lê (levanphuong2003@gmail.com)
lOMoARcPSD|13574233
1 out of 35

Your All-in-One AI-Powered Toolkit for Academic Success.
+13062052269
info@desklib.com
Available 24*7 on WhatsApp / Email
![[object Object]](/_next/static/media/star-bottom.7253800d.svg)
Unlock your academic potential
© 2024 | Zucol Services PVT LTD | All rights reserved.