Summative Assessment: Netflix Profitability Data Analysis Report
VerifiedAdded on 2023/06/10
|9
|1757
|320
Report
AI Summary
This report presents a data analysis of Netflix's profitability from 2011 to 2020. It begins by presenting raw data in a tabular format, followed by the application of statistical techniques such as mean, mode, and median to understand the central tendencies within the data. The report then delv...
SUMMATIVE
ASSESSMENT
ASSESSMENT
Paraphrase This Document
Need a fresh take? Get an instant paraphrase of this document with our AI Paraphraser
TABLE OF CONTENTS
INTRODUCTION...........................................................................................................................1
MAIN BODY...................................................................................................................................1
Raw Data Presentation...........................................................................................................1
Statistical Techniques.............................................................................................................2
Data Manipulation..................................................................................................................3
Representations.......................................................................................................................5
CONCLUSION................................................................................................................................6
REFERENCES................................................................................................................................7
INTRODUCTION
Data analysis is concerned with having the ability to evaluate the raw data so that
accomplishing the crucial information for achieving significant decision can become possible.
In the current era, having significant data analysis is crucial so that crucial information for the
purpose of taking strategic decision can become possible. The present report is based on Netflix
which is one of the international firm that offers the entertainment services through offering
series, movies, etc. the current report will pay attention on having the ten consecutive years
from 2011 to 2020 regarding its profitability so that effective evaluation its overall performance
can be exerted. Recent study will focus on presenting the raw data in tabular format, calculating
statistical techniques such as mean, mode and median. This will include manipulation of data via
using auto um, min, max, etc.
MAIN BODY
Raw Data Presentation
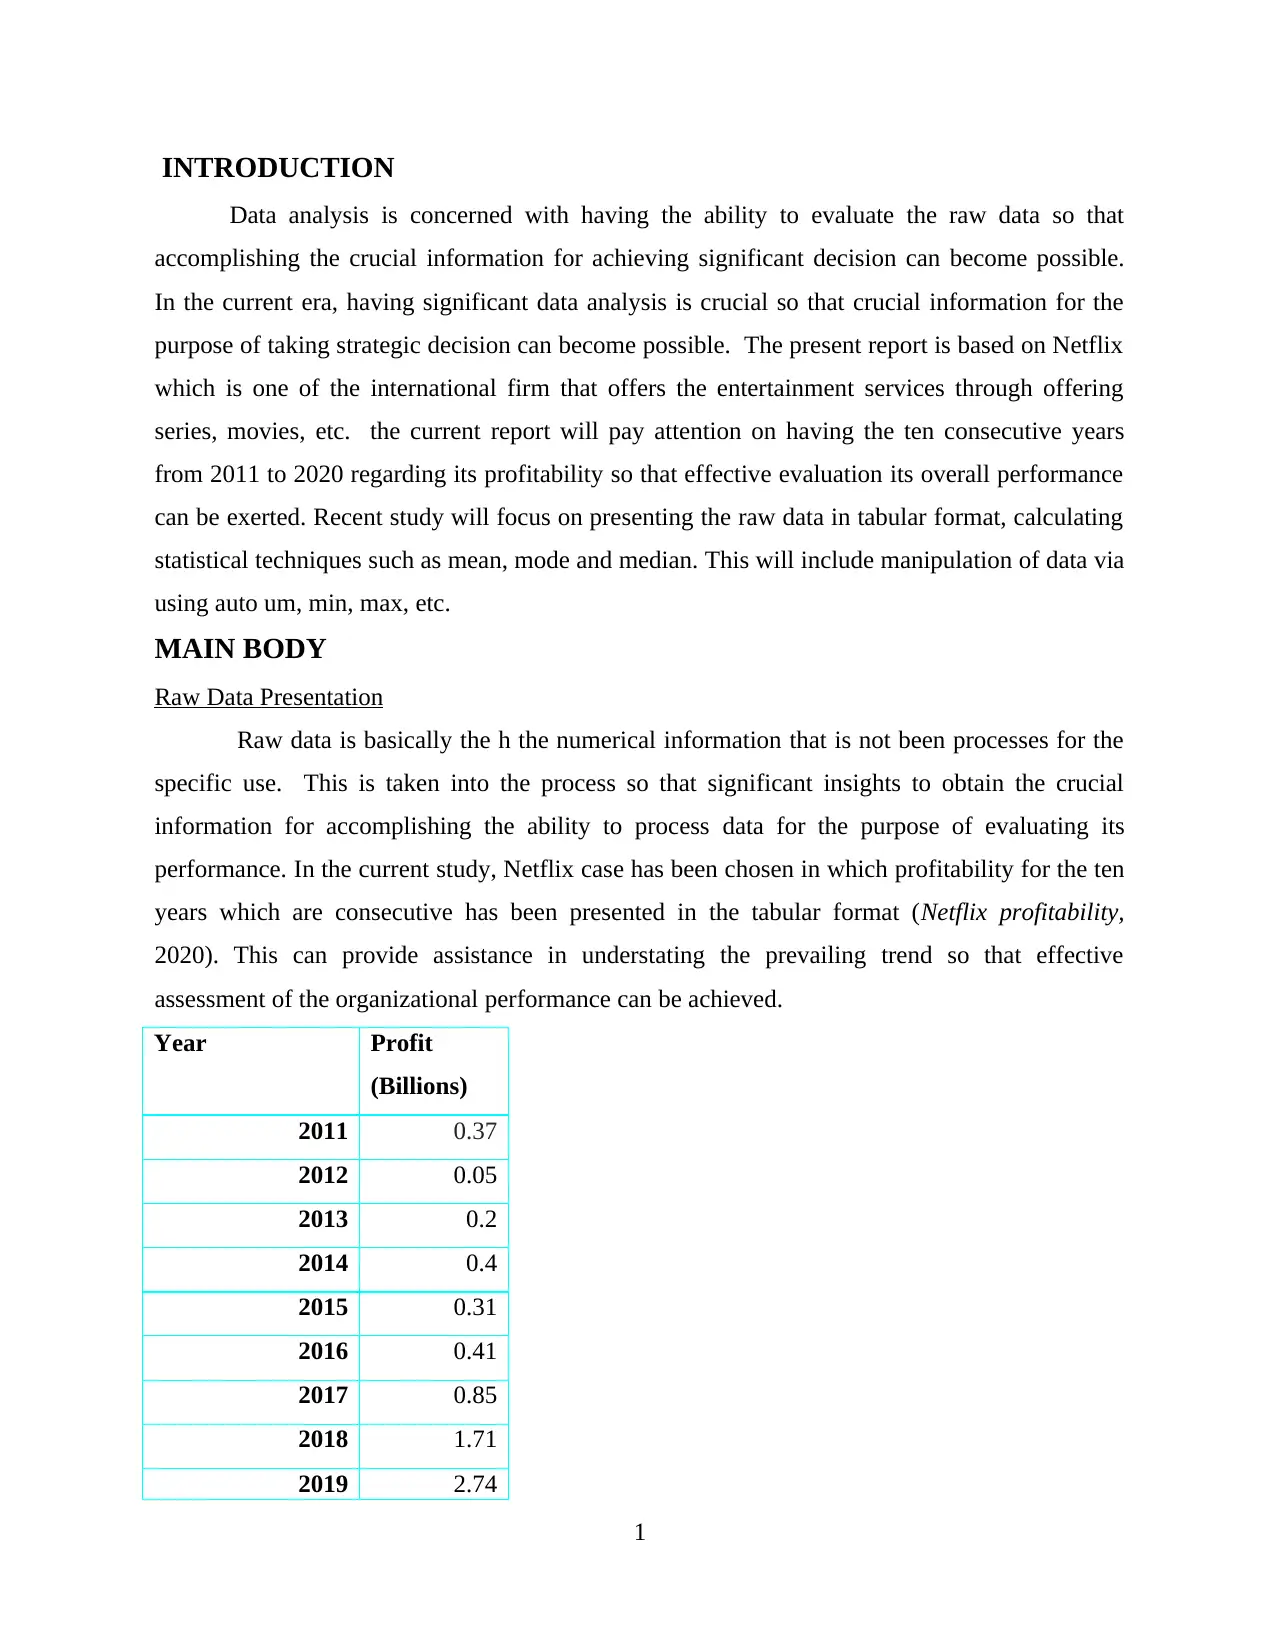
Raw data is basically the h the numerical information that is not been processes for the
specific use. This is taken into the process so that significant insights to obtain the crucial
information for accomplishing the ability to process data for the purpose of evaluating its
performance. In the current study, Netflix case has been chosen in which profitability for the ten
years which are consecutive has been presented in the tabular format (Netflix profitability,
2020). This can provide assistance in understating the prevailing trend so that effective
assessment of the organizational performance can be achieved.
Year Profit
(Billions)
2011 0.37
2012 0.05
2013 0.2
2014 0.4
2015 0.31
2016 0.41
2017 0.85
2018 1.71
2019 2.74
1
Data analysis is concerned with having the ability to evaluate the raw data so that
accomplishing the crucial information for achieving significant decision can become possible.
In the current era, having significant data analysis is crucial so that crucial information for the
purpose of taking strategic decision can become possible. The present report is based on Netflix
which is one of the international firm that offers the entertainment services through offering
series, movies, etc. the current report will pay attention on having the ten consecutive years
from 2011 to 2020 regarding its profitability so that effective evaluation its overall performance
can be exerted. Recent study will focus on presenting the raw data in tabular format, calculating
statistical techniques such as mean, mode and median. This will include manipulation of data via
using auto um, min, max, etc.
MAIN BODY
Raw Data Presentation
Raw data is basically the h the numerical information that is not been processes for the
specific use. This is taken into the process so that significant insights to obtain the crucial
information for accomplishing the ability to process data for the purpose of evaluating its
performance. In the current study, Netflix case has been chosen in which profitability for the ten
years which are consecutive has been presented in the tabular format (Netflix profitability,
2020). This can provide assistance in understating the prevailing trend so that effective
assessment of the organizational performance can be achieved.
Year Profit
(Billions)
2011 0.37
2012 0.05
2013 0.2
2014 0.4
2015 0.31
2016 0.41
2017 0.85
2018 1.71
2019 2.74
1
⊘ This is a preview!⊘
Do you want full access?
Subscribe today to unlock all pages.
Trusted by 1+ million students worldwide
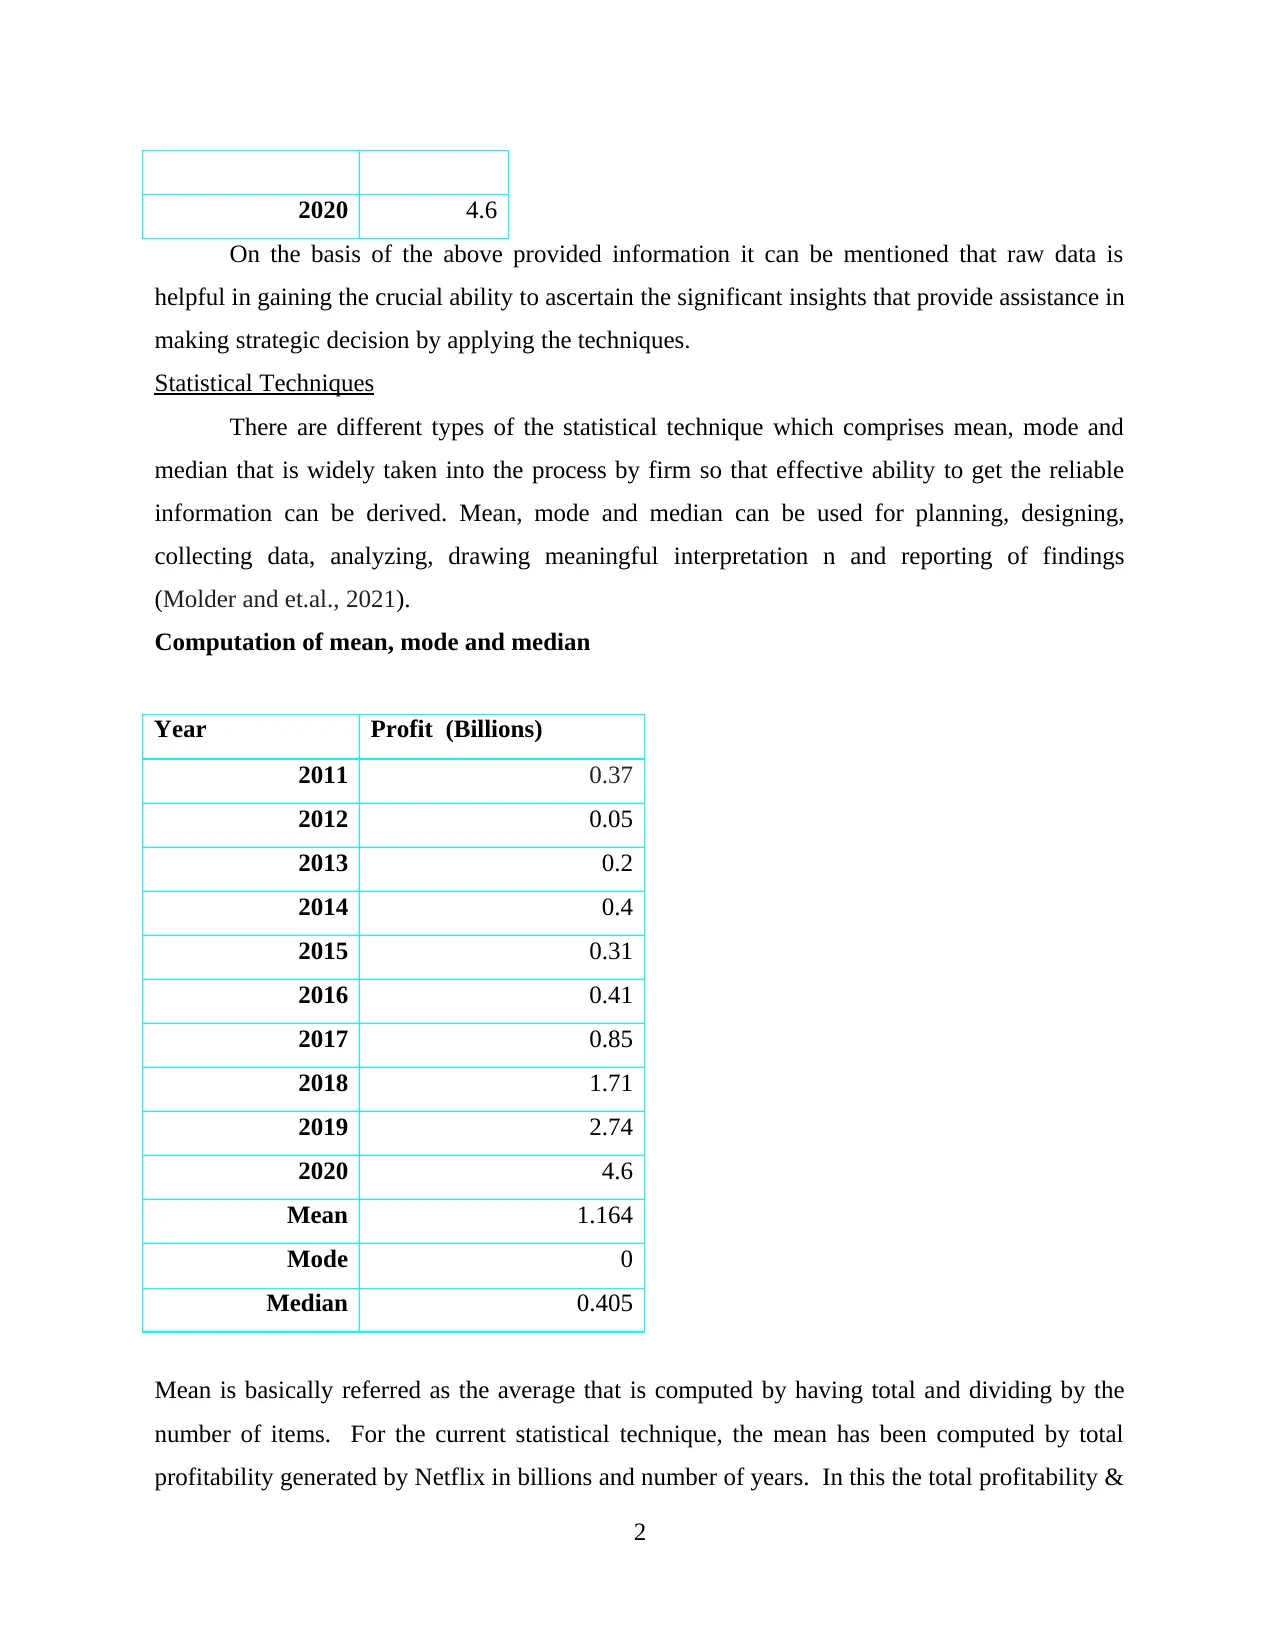
2020 4.6
On the basis of the above provided information it can be mentioned that raw data is
helpful in gaining the crucial ability to ascertain the significant insights that provide assistance in
making strategic decision by applying the techniques.
Statistical Techniques
There are different types of the statistical technique which comprises mean, mode and
median that is widely taken into the process by firm so that effective ability to get the reliable
information can be derived. Mean, mode and median can be used for planning, designing,
collecting data, analyzing, drawing meaningful interpretation n and reporting of findings
(Molder and et.al., 2021).
Computation of mean, mode and median
Year Profit (Billions)
2011 0.37
2012 0.05
2013 0.2
2014 0.4
2015 0.31
2016 0.41
2017 0.85
2018 1.71
2019 2.74
2020 4.6
Mean 1.164
Mode 0
Median 0.405
Mean is basically referred as the average that is computed by having total and dividing by the
number of items. For the current statistical technique, the mean has been computed by total
profitability generated by Netflix in billions and number of years. In this the total profitability &
2
Paraphrase This Document
Need a fresh take? Get an instant paraphrase of this document with our AI Paraphraser
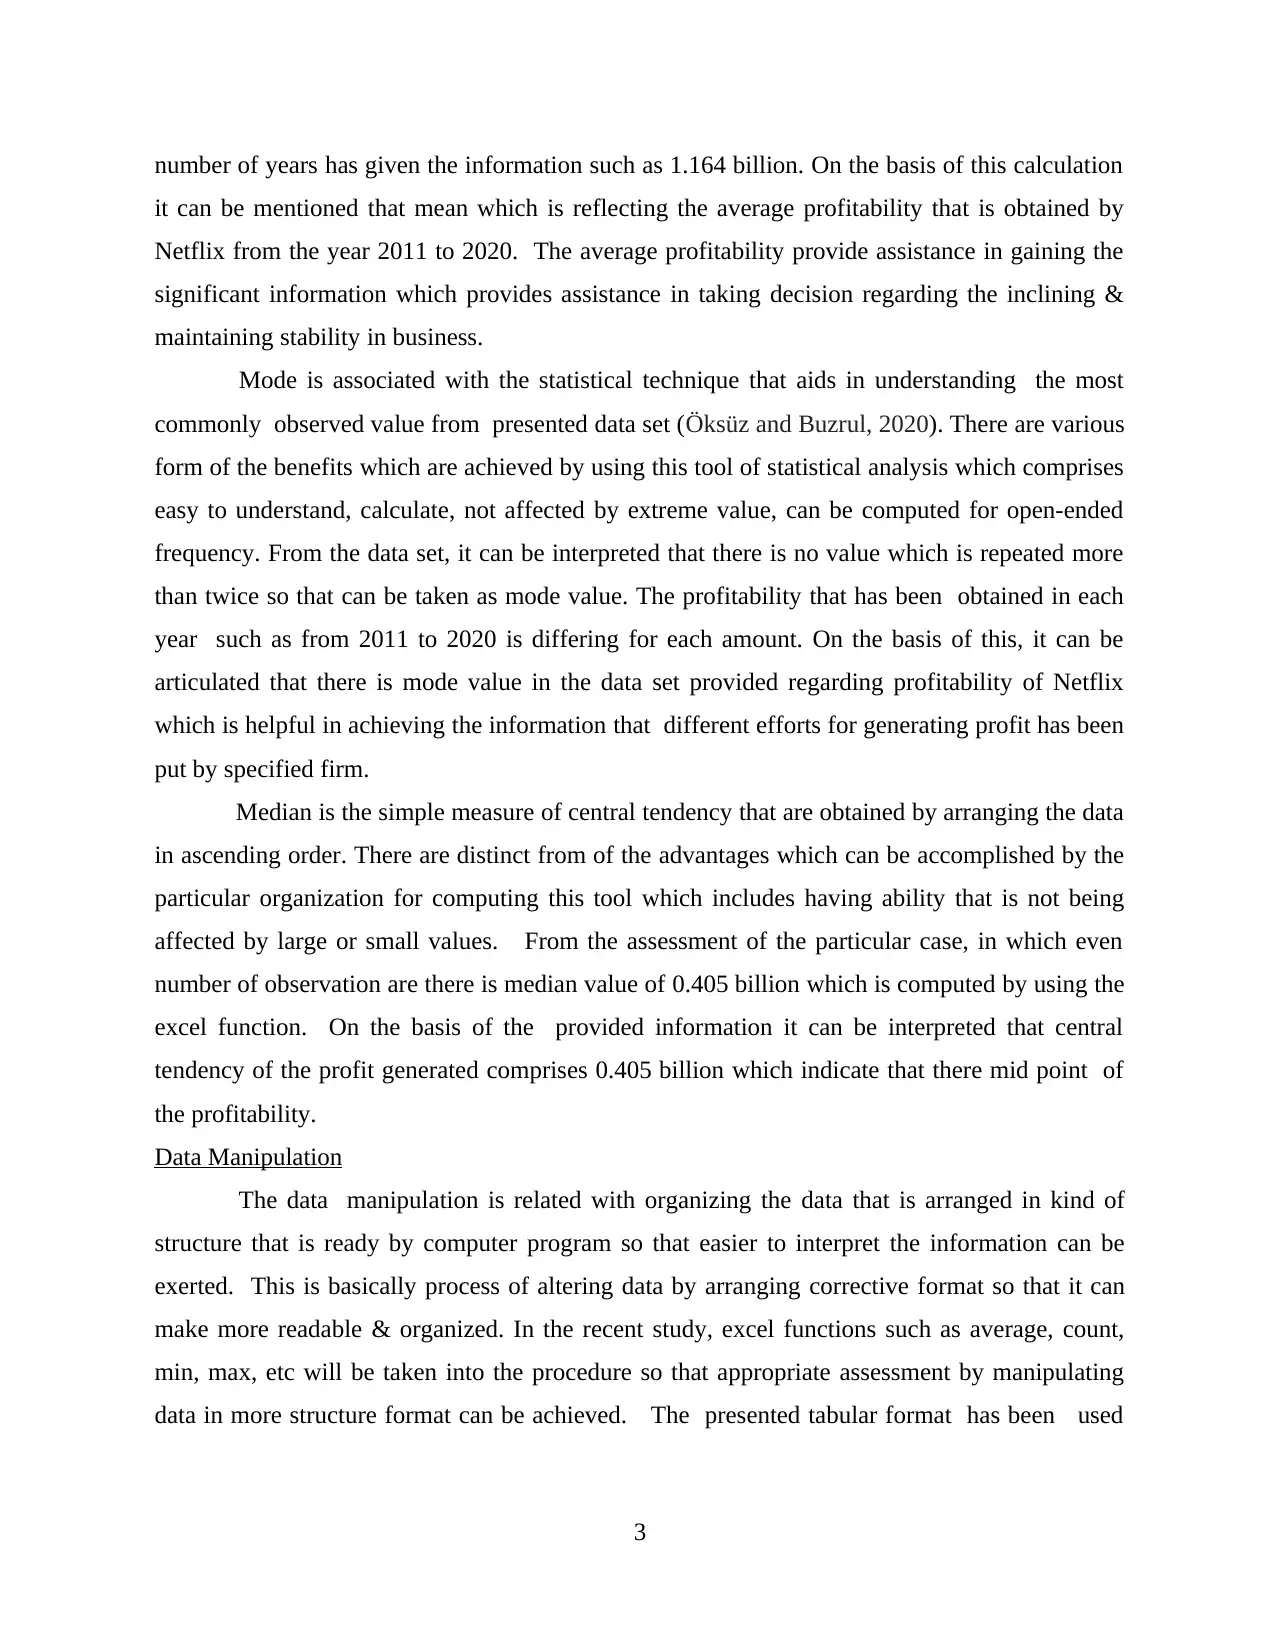
number of years has given the information such as 1.164 billion. On the basis of this calculation
it can be mentioned that mean which is reflecting the average profitability that is obtained by
Netflix from the year 2011 to 2020. The average profitability provide assistance in gaining the
significant information which provides assistance in taking decision regarding the inclining &
maintaining stability in business.
Mode is associated with the statistical technique that aids in understanding the most
commonly observed value from presented data set (Öksüz and Buzrul, 2020). There are various
form of the benefits which are achieved by using this tool of statistical analysis which comprises
easy to understand, calculate, not affected by extreme value, can be computed for open-ended
frequency. From the data set, it can be interpreted that there is no value which is repeated more
than twice so that can be taken as mode value. The profitability that has been obtained in each
year such as from 2011 to 2020 is differing for each amount. On the basis of this, it can be
articulated that there is mode value in the data set provided regarding profitability of Netflix
which is helpful in achieving the information that different efforts for generating profit has been
put by specified firm.
Median is the simple measure of central tendency that are obtained by arranging the data
in ascending order. There are distinct from of the advantages which can be accomplished by the
particular organization for computing this tool which includes having ability that is not being
affected by large or small values. From the assessment of the particular case, in which even
number of observation are there is median value of 0.405 billion which is computed by using the
excel function. On the basis of the provided information it can be interpreted that central
tendency of the profit generated comprises 0.405 billion which indicate that there mid point of
the profitability.
Data Manipulation
The data manipulation is related with organizing the data that is arranged in kind of
structure that is ready by computer program so that easier to interpret the information can be
exerted. This is basically process of altering data by arranging corrective format so that it can
make more readable & organized. In the recent study, excel functions such as average, count,
min, max, etc will be taken into the procedure so that appropriate assessment by manipulating
data in more structure format can be achieved. The presented tabular format has been used
3
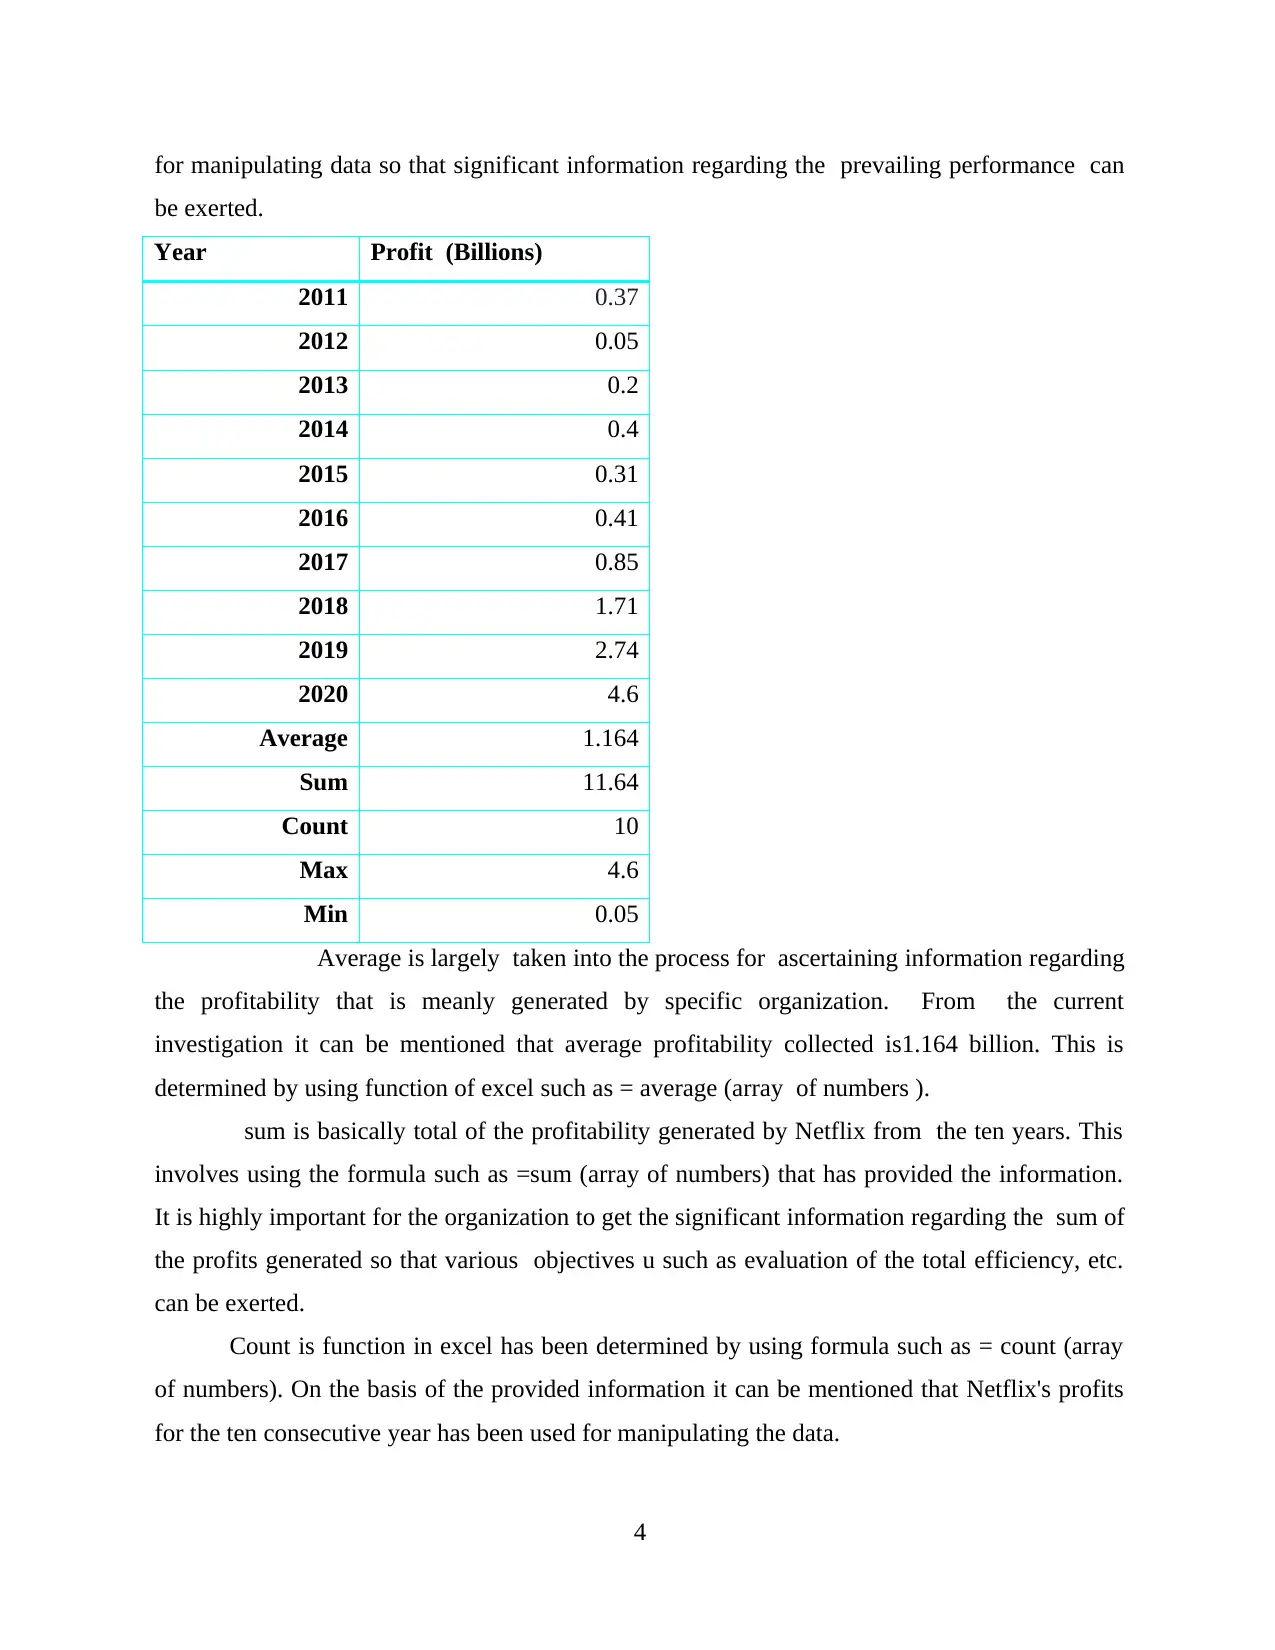
for manipulating data so that significant information regarding the prevailing performance can
be exerted.
Year Profit (Billions)
2011 0.37
2012 0.05
2013 0.2
2014 0.4
2015 0.31
2016 0.41
2017 0.85
2018 1.71
2019 2.74
2020 4.6
Average 1.164
Sum 11.64
Count 10
Max 4.6
Min 0.05
Average is largely taken into the process for ascertaining information regarding
the profitability that is meanly generated by specific organization. From the current
investigation it can be mentioned that average profitability collected is1.164 billion. This is
determined by using function of excel such as = average (array of numbers ).
sum is basically total of the profitability generated by Netflix from the ten years. This
involves using the formula such as =sum (array of numbers) that has provided the information.
It is highly important for the organization to get the significant information regarding the sum of
the profits generated so that various objectives u such as evaluation of the total efficiency, etc.
can be exerted.
Count is function in excel has been determined by using formula such as = count (array
of numbers). On the basis of the provided information it can be mentioned that Netflix's profits
for the ten consecutive year has been used for manipulating the data.
4
⊘ This is a preview!⊘
Do you want full access?
Subscribe today to unlock all pages.
Trusted by 1+ million students worldwide
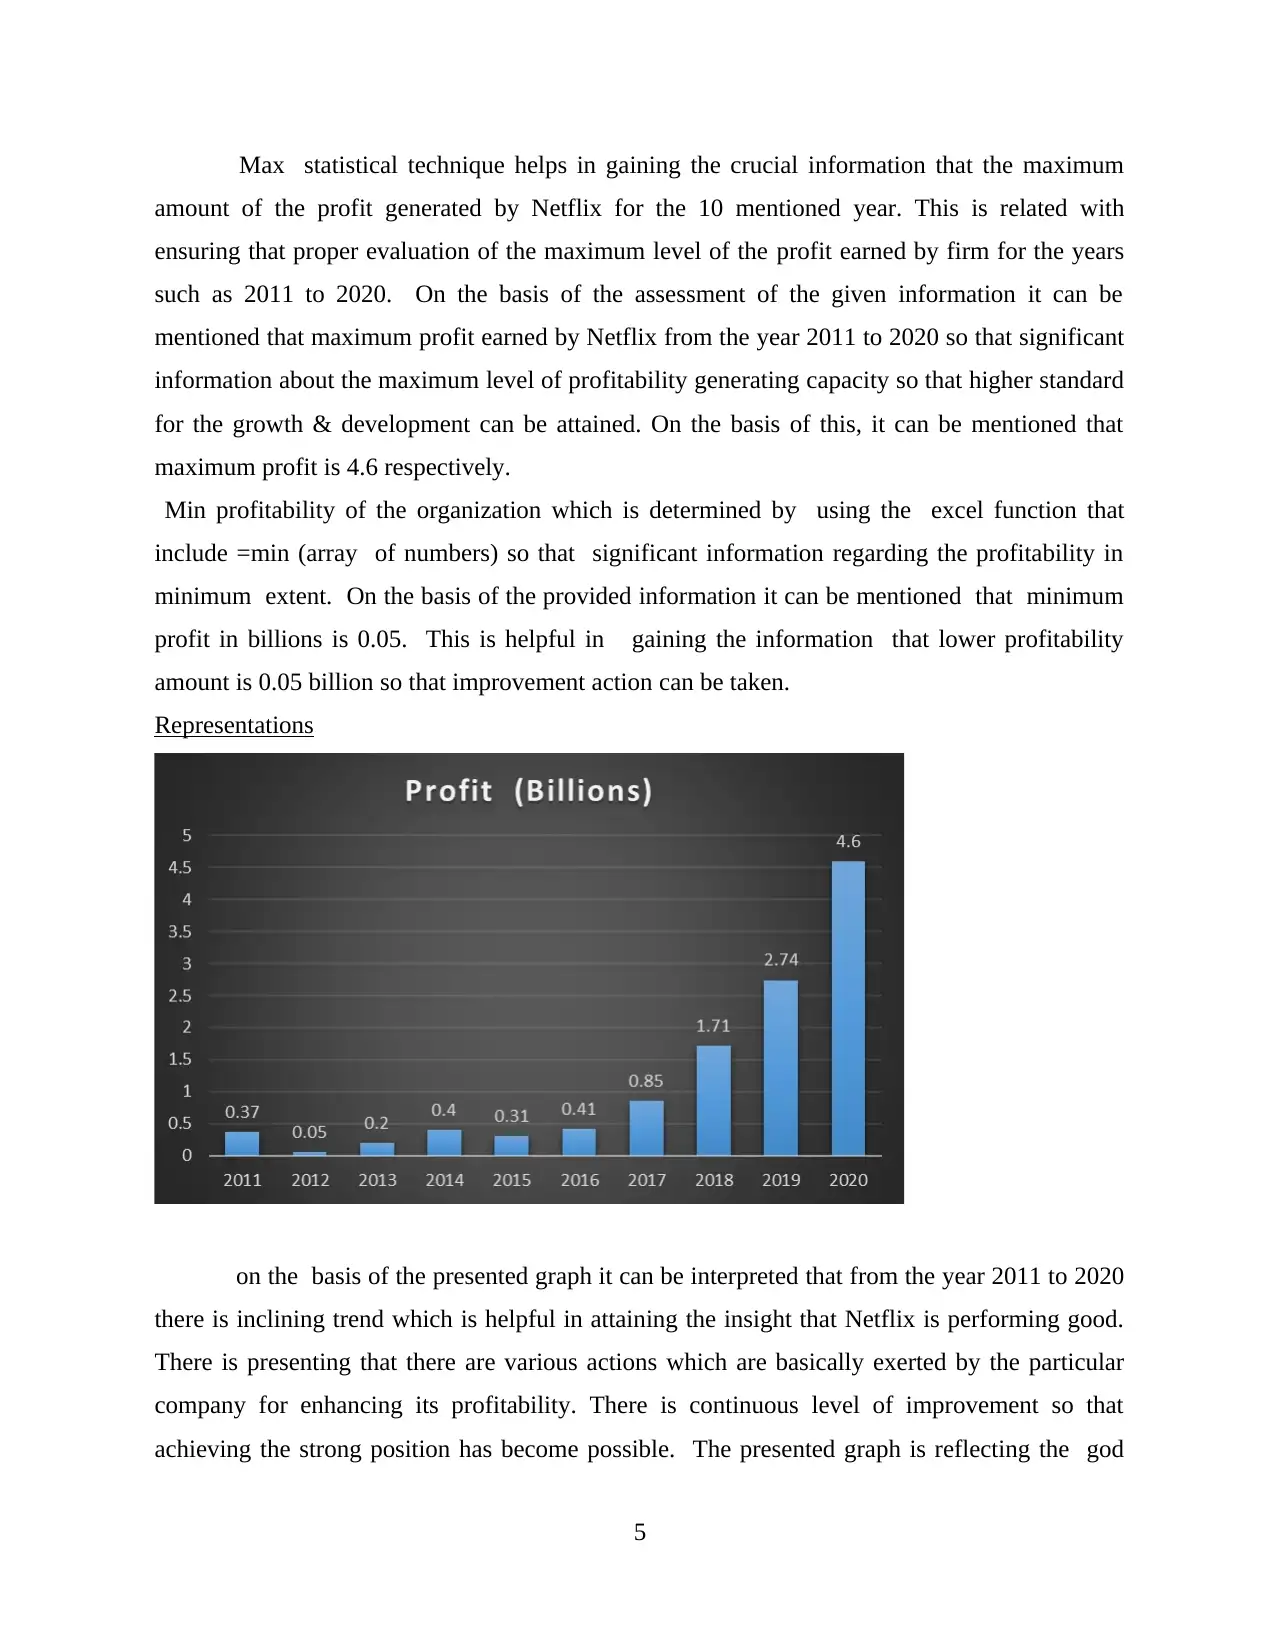
Max statistical technique helps in gaining the crucial information that the maximum
amount of the profit generated by Netflix for the 10 mentioned year. This is related with
ensuring that proper evaluation of the maximum level of the profit earned by firm for the years
such as 2011 to 2020. On the basis of the assessment of the given information it can be
mentioned that maximum profit earned by Netflix from the year 2011 to 2020 so that significant
information about the maximum level of profitability generating capacity so that higher standard
for the growth & development can be attained. On the basis of this, it can be mentioned that
maximum profit is 4.6 respectively.
Min profitability of the organization which is determined by using the excel function that
include =min (array of numbers) so that significant information regarding the profitability in
minimum extent. On the basis of the provided information it can be mentioned that minimum
profit in billions is 0.05. This is helpful in gaining the information that lower profitability
amount is 0.05 billion so that improvement action can be taken.
Representations
on the basis of the presented graph it can be interpreted that from the year 2011 to 2020
there is inclining trend which is helpful in attaining the insight that Netflix is performing good.
There is presenting that there are various actions which are basically exerted by the particular
company for enhancing its profitability. There is continuous level of improvement so that
achieving the strong position has become possible. The presented graph is reflecting the god
5
Paraphrase This Document
Need a fresh take? Get an instant paraphrase of this document with our AI Paraphraser
position of Netflix that tend to offer the higher ability to valid that enterprise is accomplishing
the competitiveness through enhancing its profitability so that attainting & retaining investors,
lenders, etc. stakeholders for longer duration can become possible (Moriarty, Held and
Richardson, 2018). On the basis of this, it can be mentioned that organization is having the
significant ability to stabilize in sector for longer duration.
CONCLUSION
From the above report it can be concluded that data analysis is crucial for gaining the
significant information regarding the prevailing data via evaluating so that relevant decision-
making can be exerted, the current study has given emphasis on presenting the data in raw data
and having proper utilization of statistical tools such as mean, mode and median. There is
manipulation of data which involves sum, max, etc. That has allowed to obtain the crucial
information that can provide assistance in taking strategic decision. On the basis of this, it can
be mentioned that there is higher profitability is obtaining as upward movement trend of growth
is achieved by looking at graph formulated.
6
REFERENCES
Books and Journals
Mölder, F and et.al., 2021. Sustainable data analysis with Snakemake. F1000Research. 10.
Moriarty, B., Held, B. and Richardson, T., 2018. Microsoft excel functions and formulas. Stylus
Publishing, LLC.
Öksüz, H.B. and Buzrul, S.,2020. An Excel Spreadsheet Regression Tool for Biological Data: R-
Bioex. Available at SSRN 4013257.
Online
Netflix profitability. 2020. [Online]. Available through:
<https://www.businessofapps.com/data/netflix-statistics/>
7
⊘ This is a preview!⊘
Do you want full access?
Subscribe today to unlock all pages.
Trusted by 1+ million students worldwide
1 out of 9
Related Documents


Your All-in-One AI-Powered Toolkit for Academic Success.
+13062052269
info@desklib.com
Available 24*7 on WhatsApp / Email
![[object Object]](/_next/static/media/star-bottom.7253800d.svg)
Unlock your academic potential
© 2024 | Zucol Services PVT LTD | All rights reserved.