Network Performance Analysis using Wireshark
VerifiedAdded on 2024/06/03
|14
|1714
|163
AI Summary
This assignment explores the capabilities of Wireshark, a freeware network protocol analyzer, to analyze network performance. It examines four different websites, including online newspapers, a news portal, and an online radio station, by analyzing their Load Distribution, Throughput, Time Sequence, Flow, and Window Scaling graphs. The analysis provides insights into the network behavior of these websites, highlighting their strengths and weaknesses in terms of data transmission, packet delivery, and overall network efficiency.
Contribute Materials
Your contribution can guide someone’s learning journey. Share your
documents today.

ASSIGNMENT #02
Secure Best Marks with AI Grader
Need help grading? Try our AI Grader for instant feedback on your assignments.

Contents
Introduction................................................................................................................................2
Task - 1.......................................................................................................................................2
www.onlinenewspaper.com/australi.htm...............................................................................2
www.cbsinteractive.com.au....................................................................................................5
www.newspapers.com.au.......................................................................................................7
Task – 2....................................................................................................................................10
www.abc.net.au/radio/listen-online......................................................................................10
Conclusion................................................................................................................................11
References................................................................................................................................12
1
Introduction
The assignment is about the application of network. For the assignment Wireshark software
will be used to develop a deep understanding of the knowledge the software. This assignment
includes the detailed identification of the terms of technology that are used to inform the
network technology. In the assignment there are two tasks going to be performed. In task 1
three web sites are given and for each website evaluation of the network services on the basis
of Load Distribution, Throughput graph, Time Sequence graph, Flow graph and Window
scaling graph of the web site.
Task - 1
In task 1 there are three different websites and each is being evaluated on different aspects to
analyse the network performance of the web site.
www.onlinenewspaper.com/australi.htm
1. Load Distribution
Load distribution provides the information about the web site on the basis of its service
providence. HTTP is the server-client communication in which they transfer the HTML files.
An HTTP request is made by the client and the server responds to the request [1].
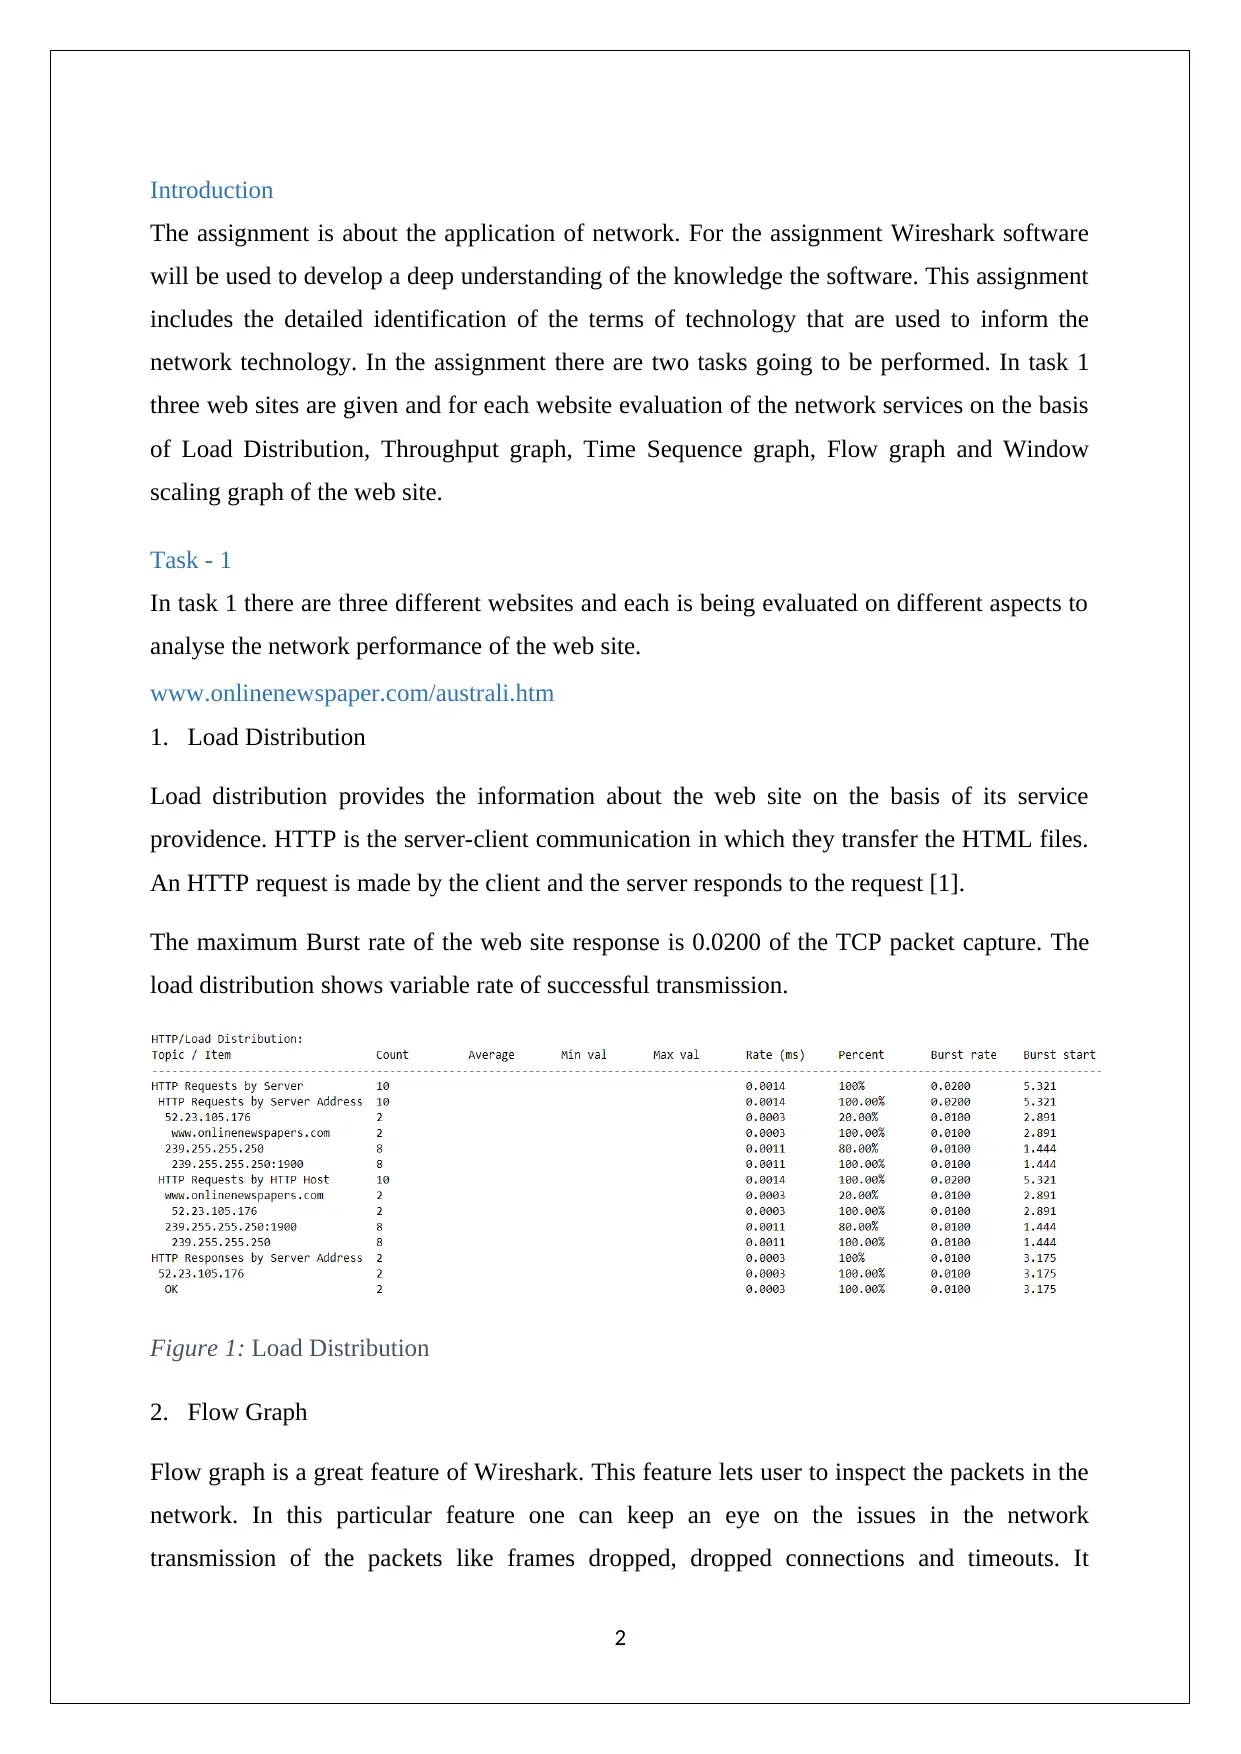
The maximum Burst rate of the web site response is 0.0200 of the TCP packet capture. The
load distribution shows variable rate of successful transmission.
Figure 1: Load Distribution
2. Flow Graph
Flow graph is a great feature of Wireshark. This feature lets user to inspect the packets in the
network. In this particular feature one can keep an eye on the issues in the network
transmission of the packets like frames dropped, dropped connections and timeouts. It
2
completely shows the behaviour of the network in sending the packets, receiving the packets
and acknowledging the packets [2].
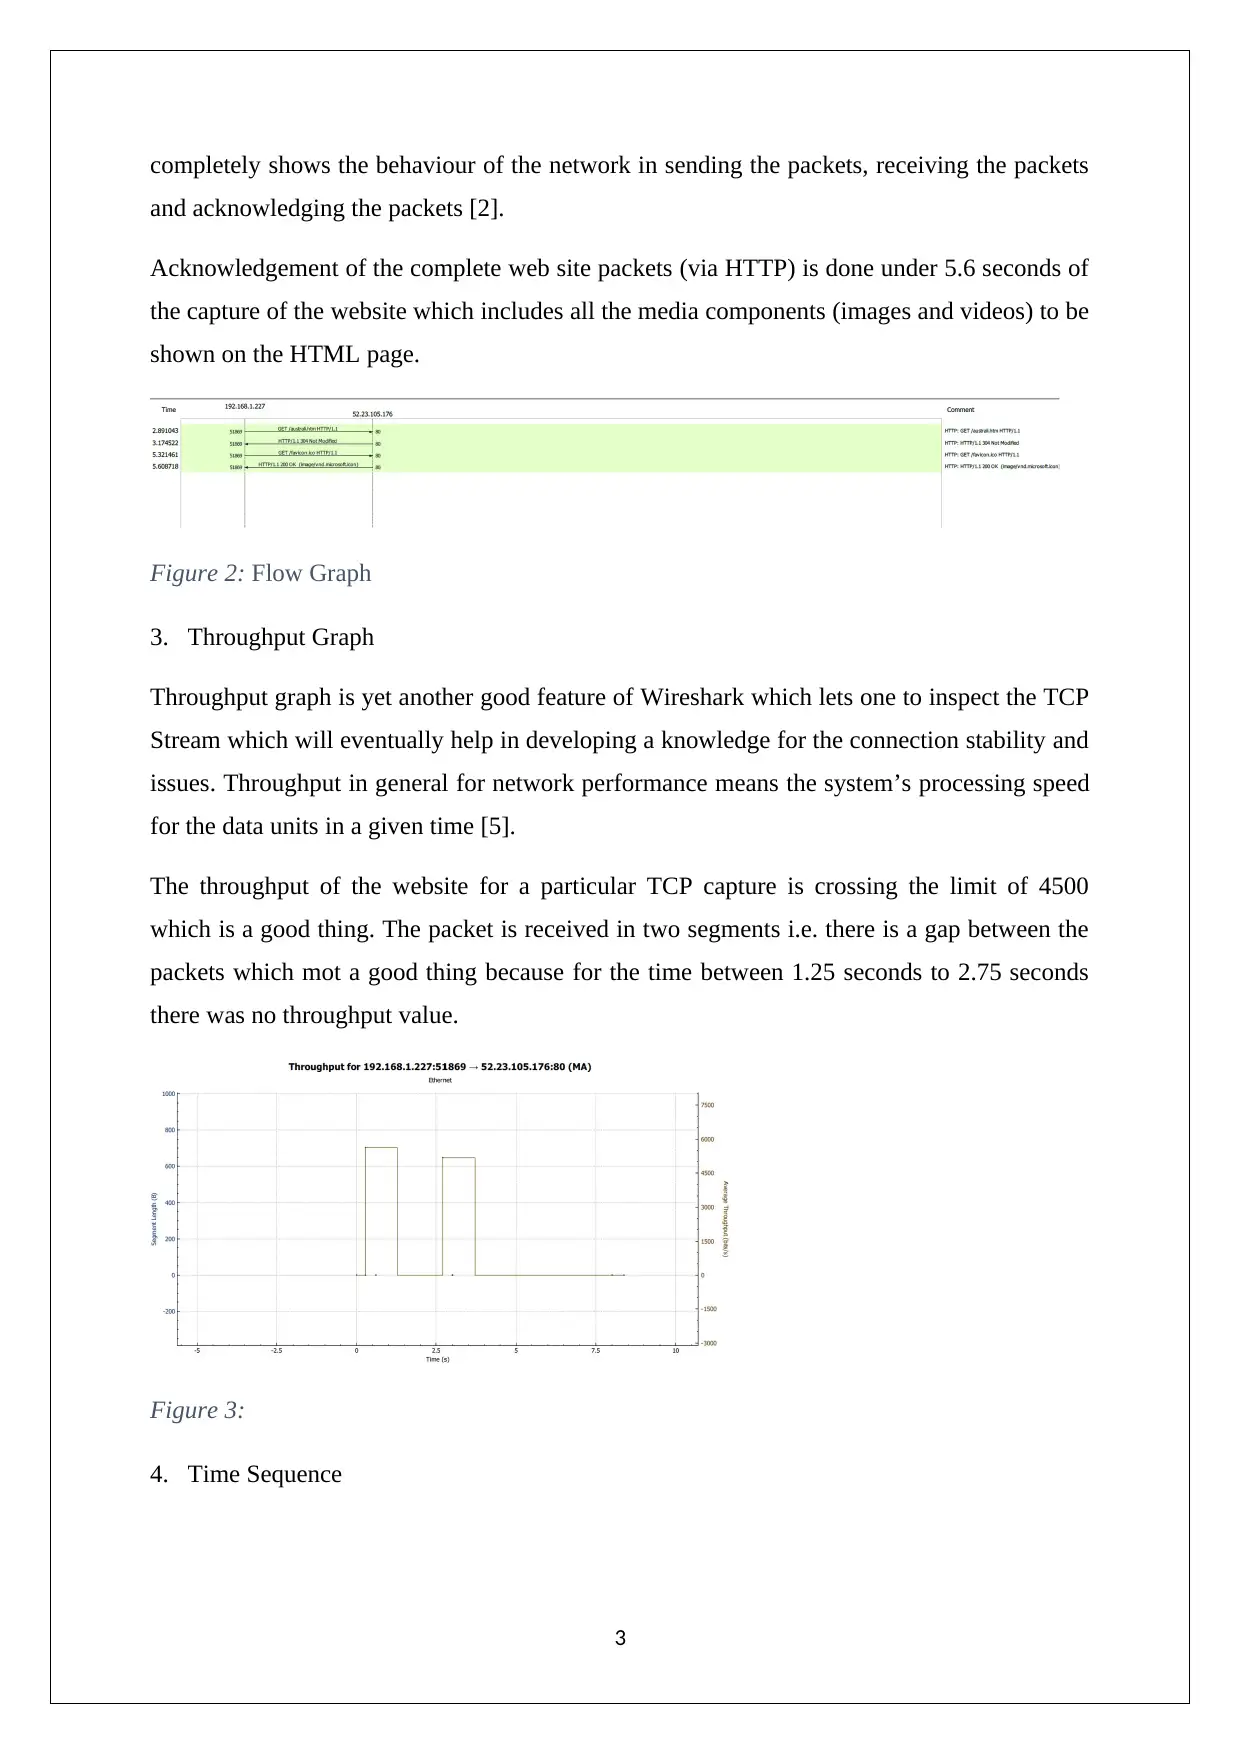
Acknowledgement of the complete web site packets (via HTTP) is done under 5.6 seconds of
the capture of the website which includes all the media components (images and videos) to be
shown on the HTML page.
Figure 2: Flow Graph
3. Throughput Graph
Throughput graph is yet another good feature of Wireshark which lets one to inspect the TCP
Stream which will eventually help in developing a knowledge for the connection stability and
issues. Throughput in general for network performance means the system’s processing speed
for the data units in a given time [5].
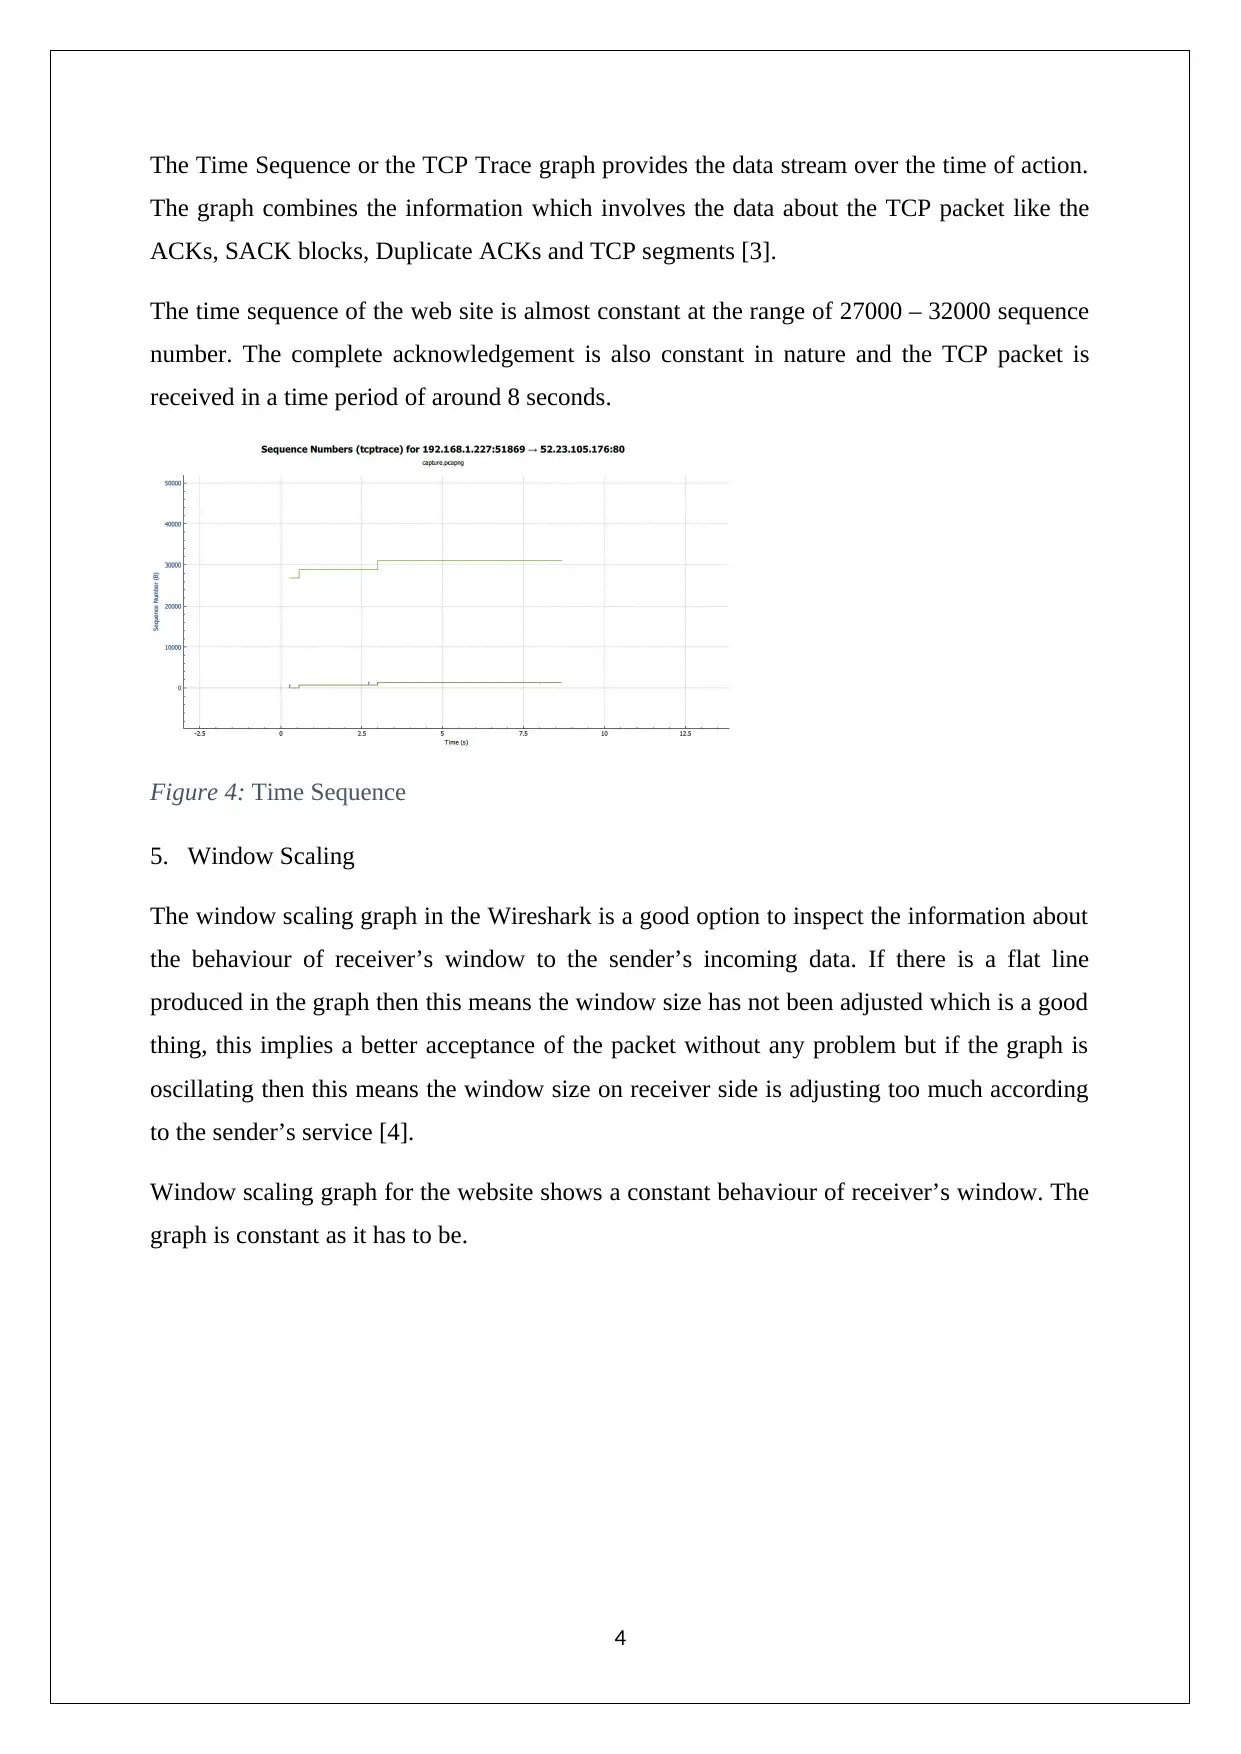
The throughput of the website for a particular TCP capture is crossing the limit of 4500
which is a good thing. The packet is received in two segments i.e. there is a gap between the
packets which mot a good thing because for the time between 1.25 seconds to 2.75 seconds
there was no throughput value.
Figure 3:
4. Time Sequence
3
Secure Best Marks with AI Grader
Need help grading? Try our AI Grader for instant feedback on your assignments.
The Time Sequence or the TCP Trace graph provides the data stream over the time of action.
The graph combines the information which involves the data about the TCP packet like the
ACKs, SACK blocks, Duplicate ACKs and TCP segments [3].
The time sequence of the web site is almost constant at the range of 27000 – 32000 sequence
number. The complete acknowledgement is also constant in nature and the TCP packet is
received in a time period of around 8 seconds.
Figure 4: Time Sequence
5. Window Scaling
The window scaling graph in the Wireshark is a good option to inspect the information about
the behaviour of receiver’s window to the sender’s incoming data. If there is a flat line
produced in the graph then this means the window size has not been adjusted which is a good
thing, this implies a better acceptance of the packet without any problem but if the graph is
oscillating then this means the window size on receiver side is adjusting too much according
to the sender’s service [4].
Window scaling graph for the website shows a constant behaviour of receiver’s window. The
graph is constant as it has to be.
4
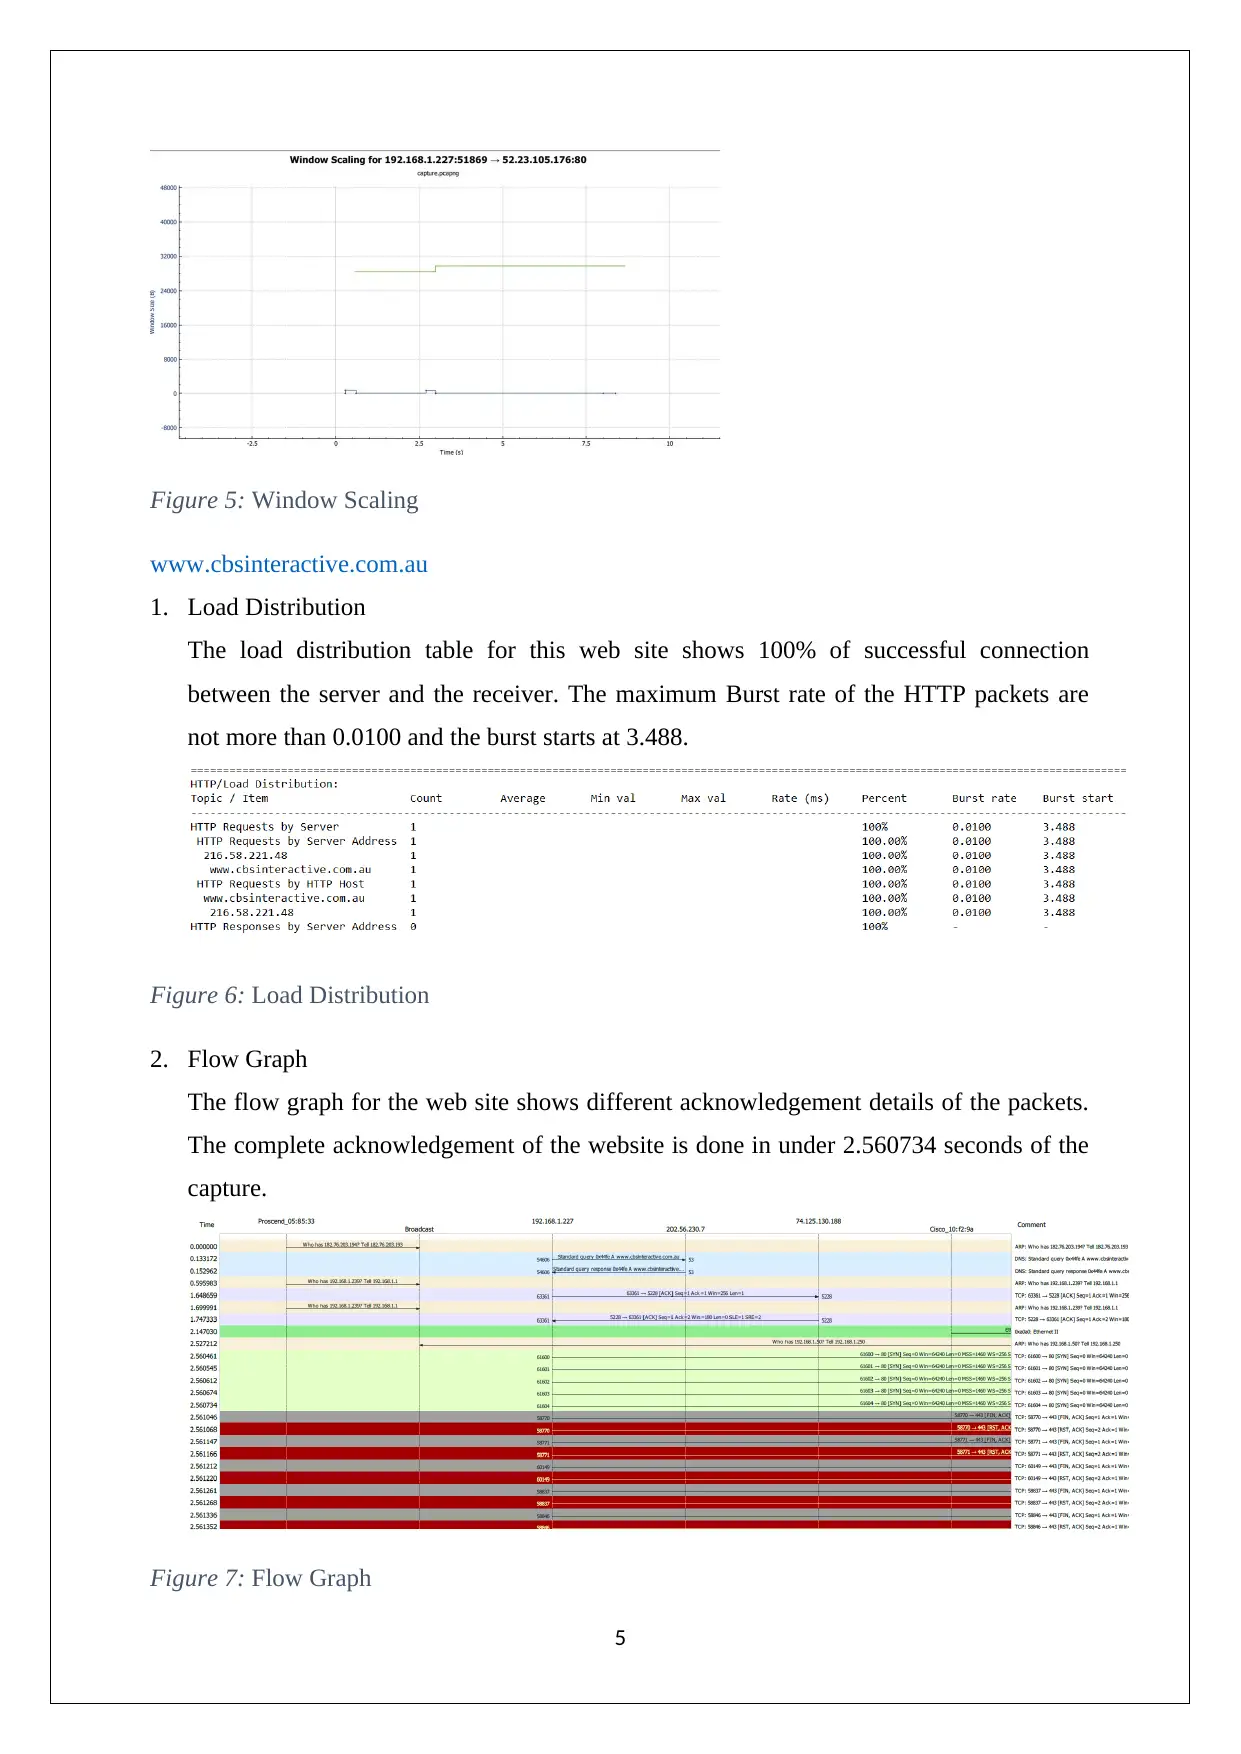
Figure 5: Window Scaling
www.cbsinteractive.com.au
1. Load Distribution
The load distribution table for this web site shows 100% of successful connection
between the server and the receiver. The maximum Burst rate of the HTTP packets are
not more than 0.0100 and the burst starts at 3.488.
Figure 6: Load Distribution
2. Flow Graph
The flow graph for the web site shows different acknowledgement details of the packets.
The complete acknowledgement of the website is done in under 2.560734 seconds of the
capture.
Figure 7: Flow Graph
5
3. Throughput Graph
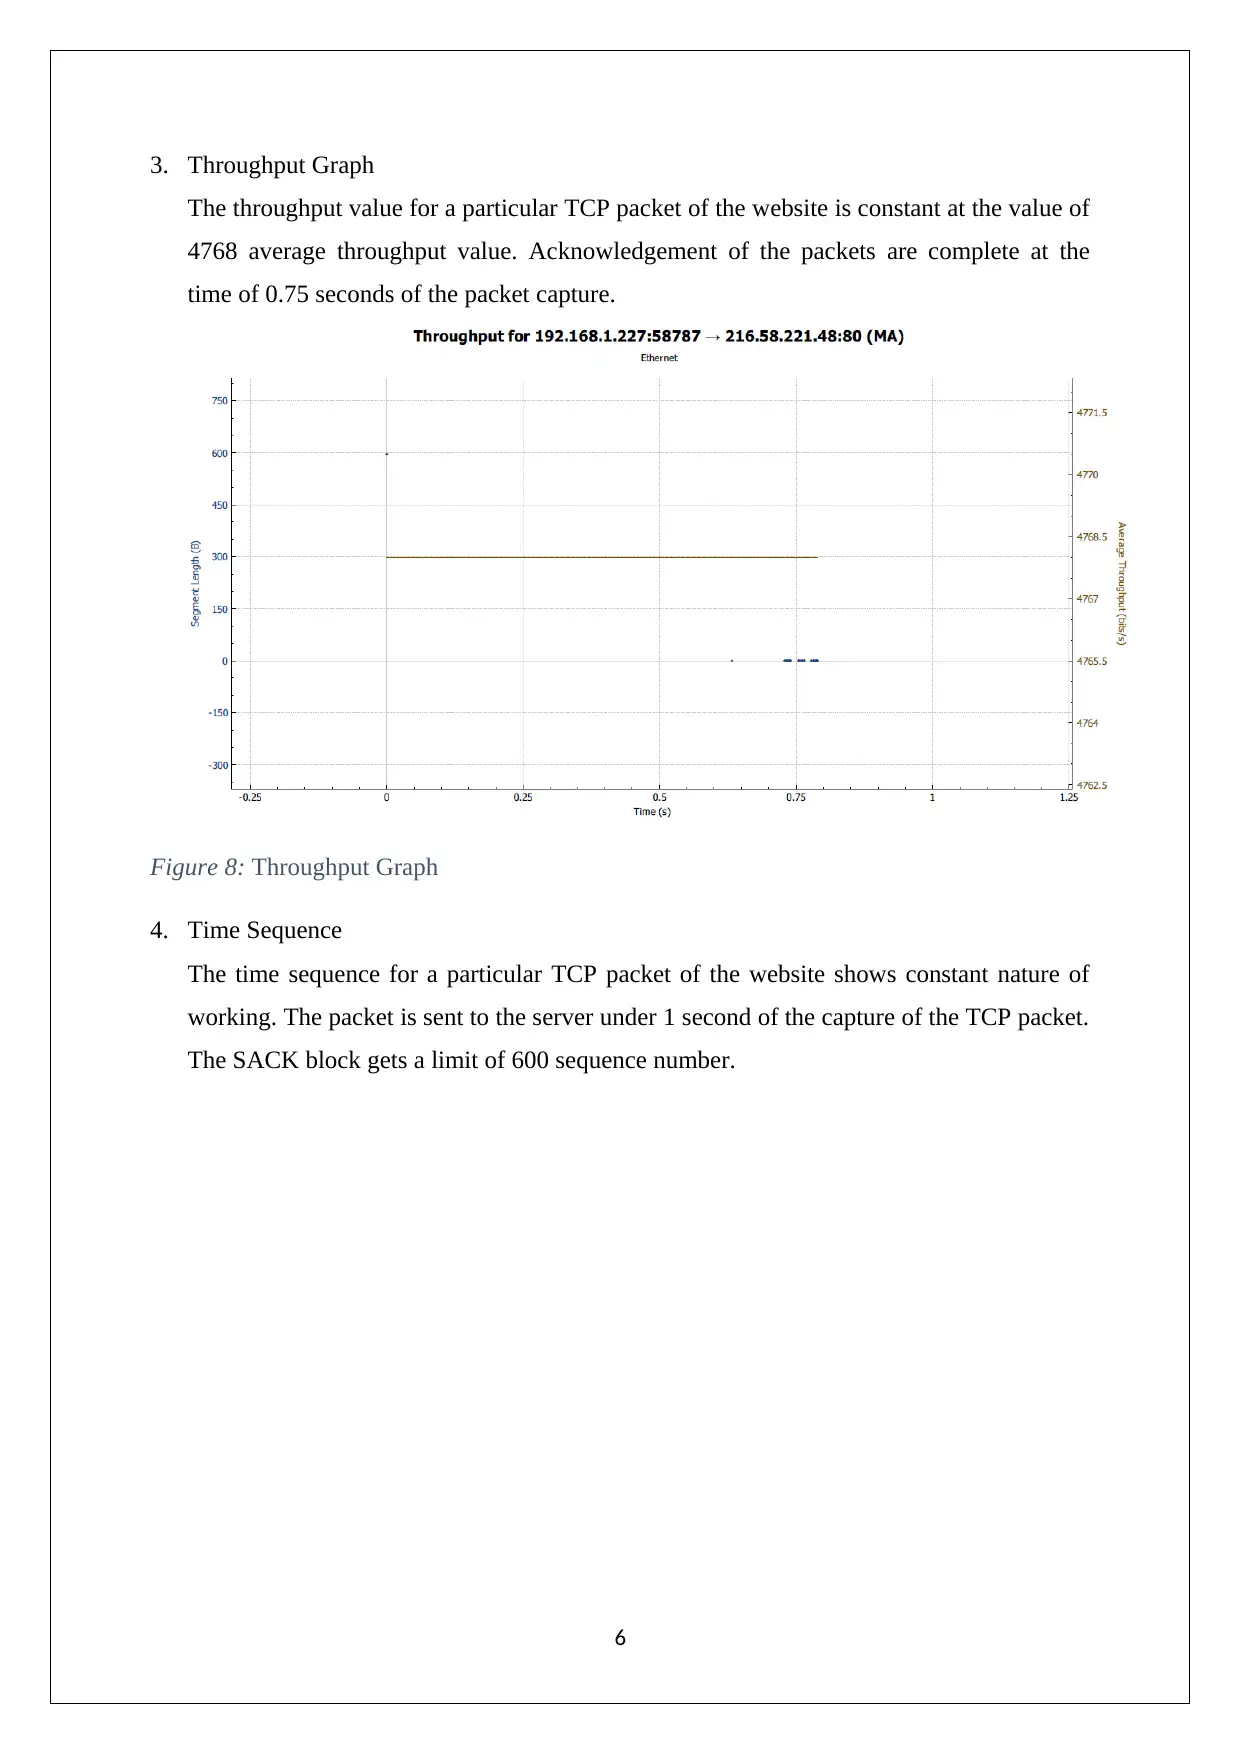
The throughput value for a particular TCP packet of the website is constant at the value of
4768 average throughput value. Acknowledgement of the packets are complete at the
time of 0.75 seconds of the packet capture.
Figure 8: Throughput Graph
4. Time Sequence
The time sequence for a particular TCP packet of the website shows constant nature of
working. The packet is sent to the server under 1 second of the capture of the TCP packet.
The SACK block gets a limit of 600 sequence number.
6
Paraphrase This Document
Need a fresh take? Get an instant paraphrase of this document with our AI Paraphraser
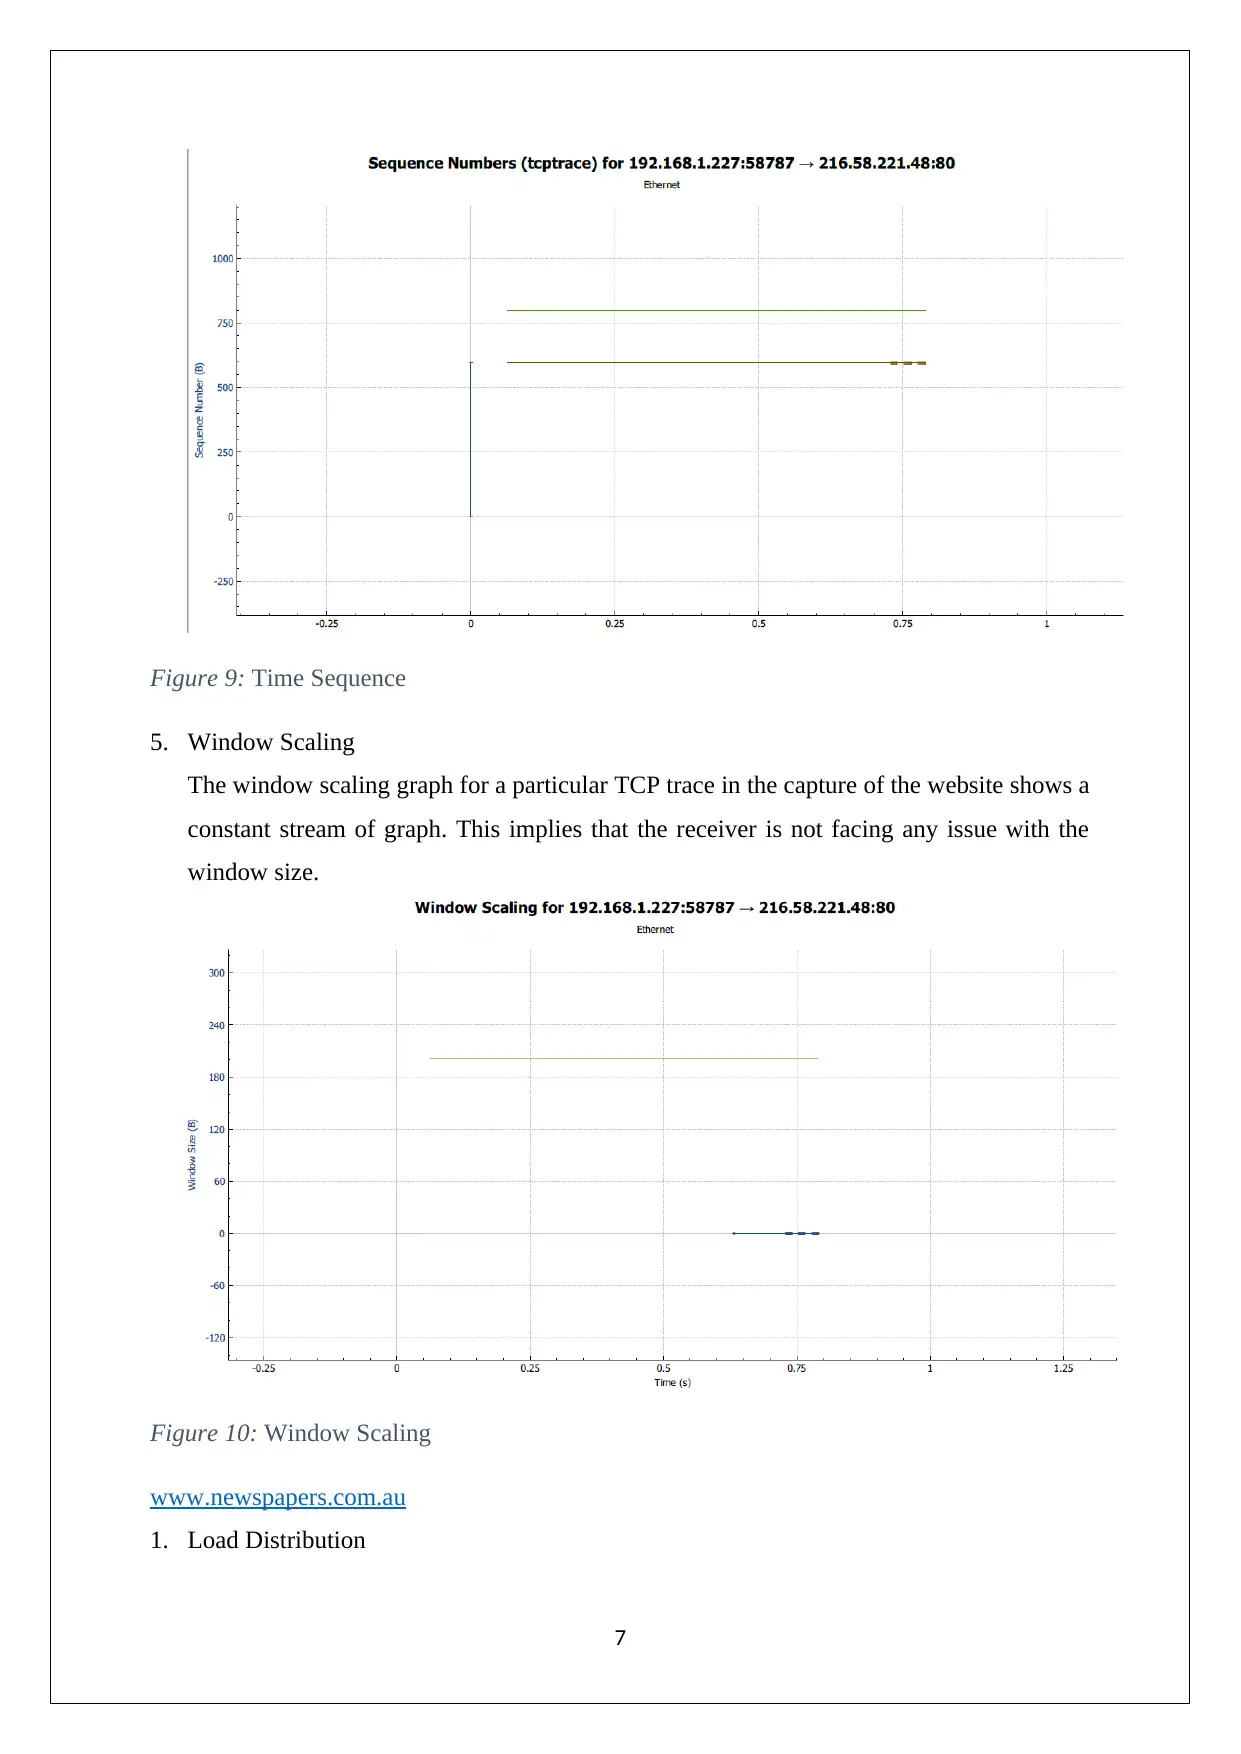
Figure 9: Time Sequence
5. Window Scaling
The window scaling graph for a particular TCP trace in the capture of the website shows a
constant stream of graph. This implies that the receiver is not facing any issue with the
window size.
Figure 10: Window Scaling
www.newspapers.com.au
1. Load Distribution
7
5. Window Scaling
The window scaling graph for a particular TCP trace in the capture of the website shows a
constant stream of graph. This implies that the receiver is not facing any issue with the
window size.
Figure 10: Window Scaling
www.newspapers.com.au
1. Load Distribution
7
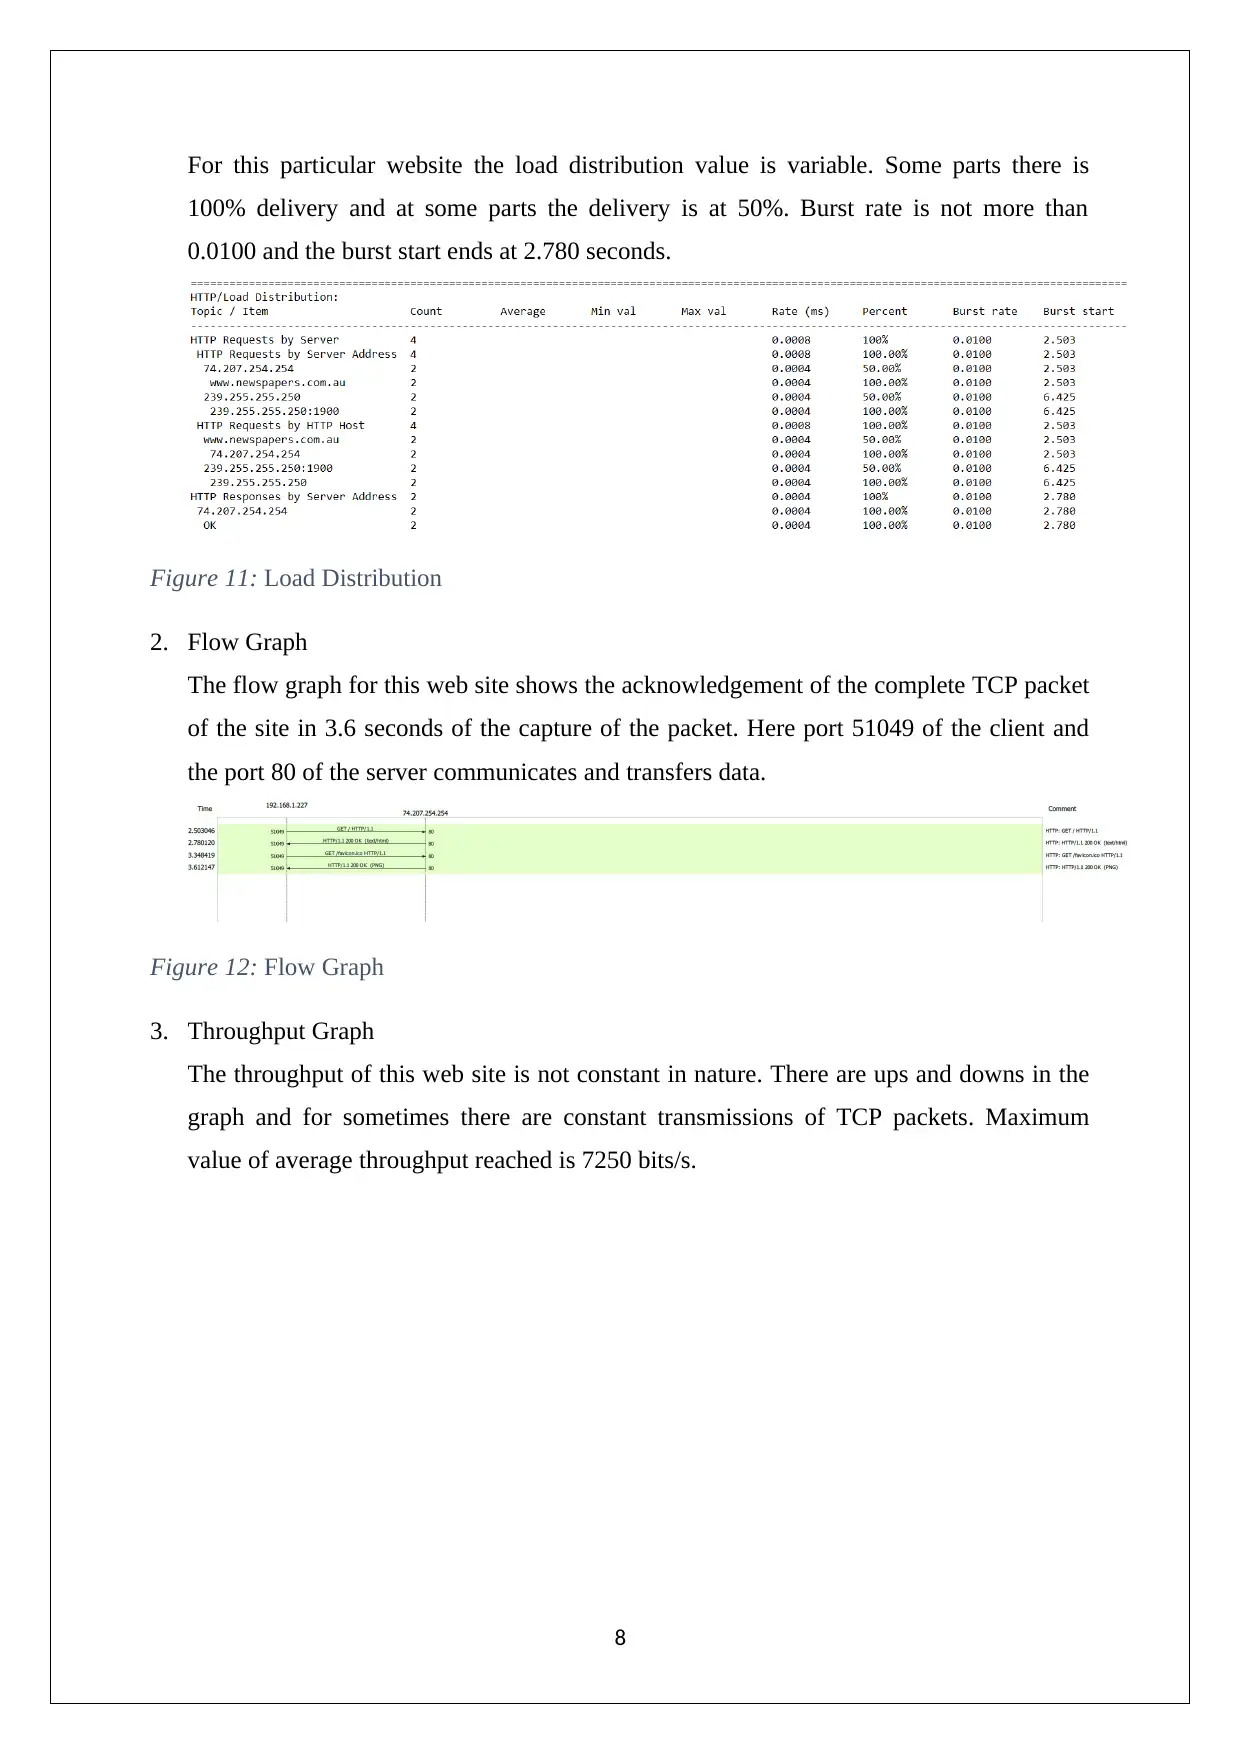
For this particular website the load distribution value is variable. Some parts there is
100% delivery and at some parts the delivery is at 50%. Burst rate is not more than
0.0100 and the burst start ends at 2.780 seconds.
Figure 11: Load Distribution
2. Flow Graph
The flow graph for this web site shows the acknowledgement of the complete TCP packet
of the site in 3.6 seconds of the capture of the packet. Here port 51049 of the client and
the port 80 of the server communicates and transfers data.
Figure 12: Flow Graph
3. Throughput Graph
The throughput of this web site is not constant in nature. There are ups and downs in the
graph and for sometimes there are constant transmissions of TCP packets. Maximum
value of average throughput reached is 7250 bits/s.
8
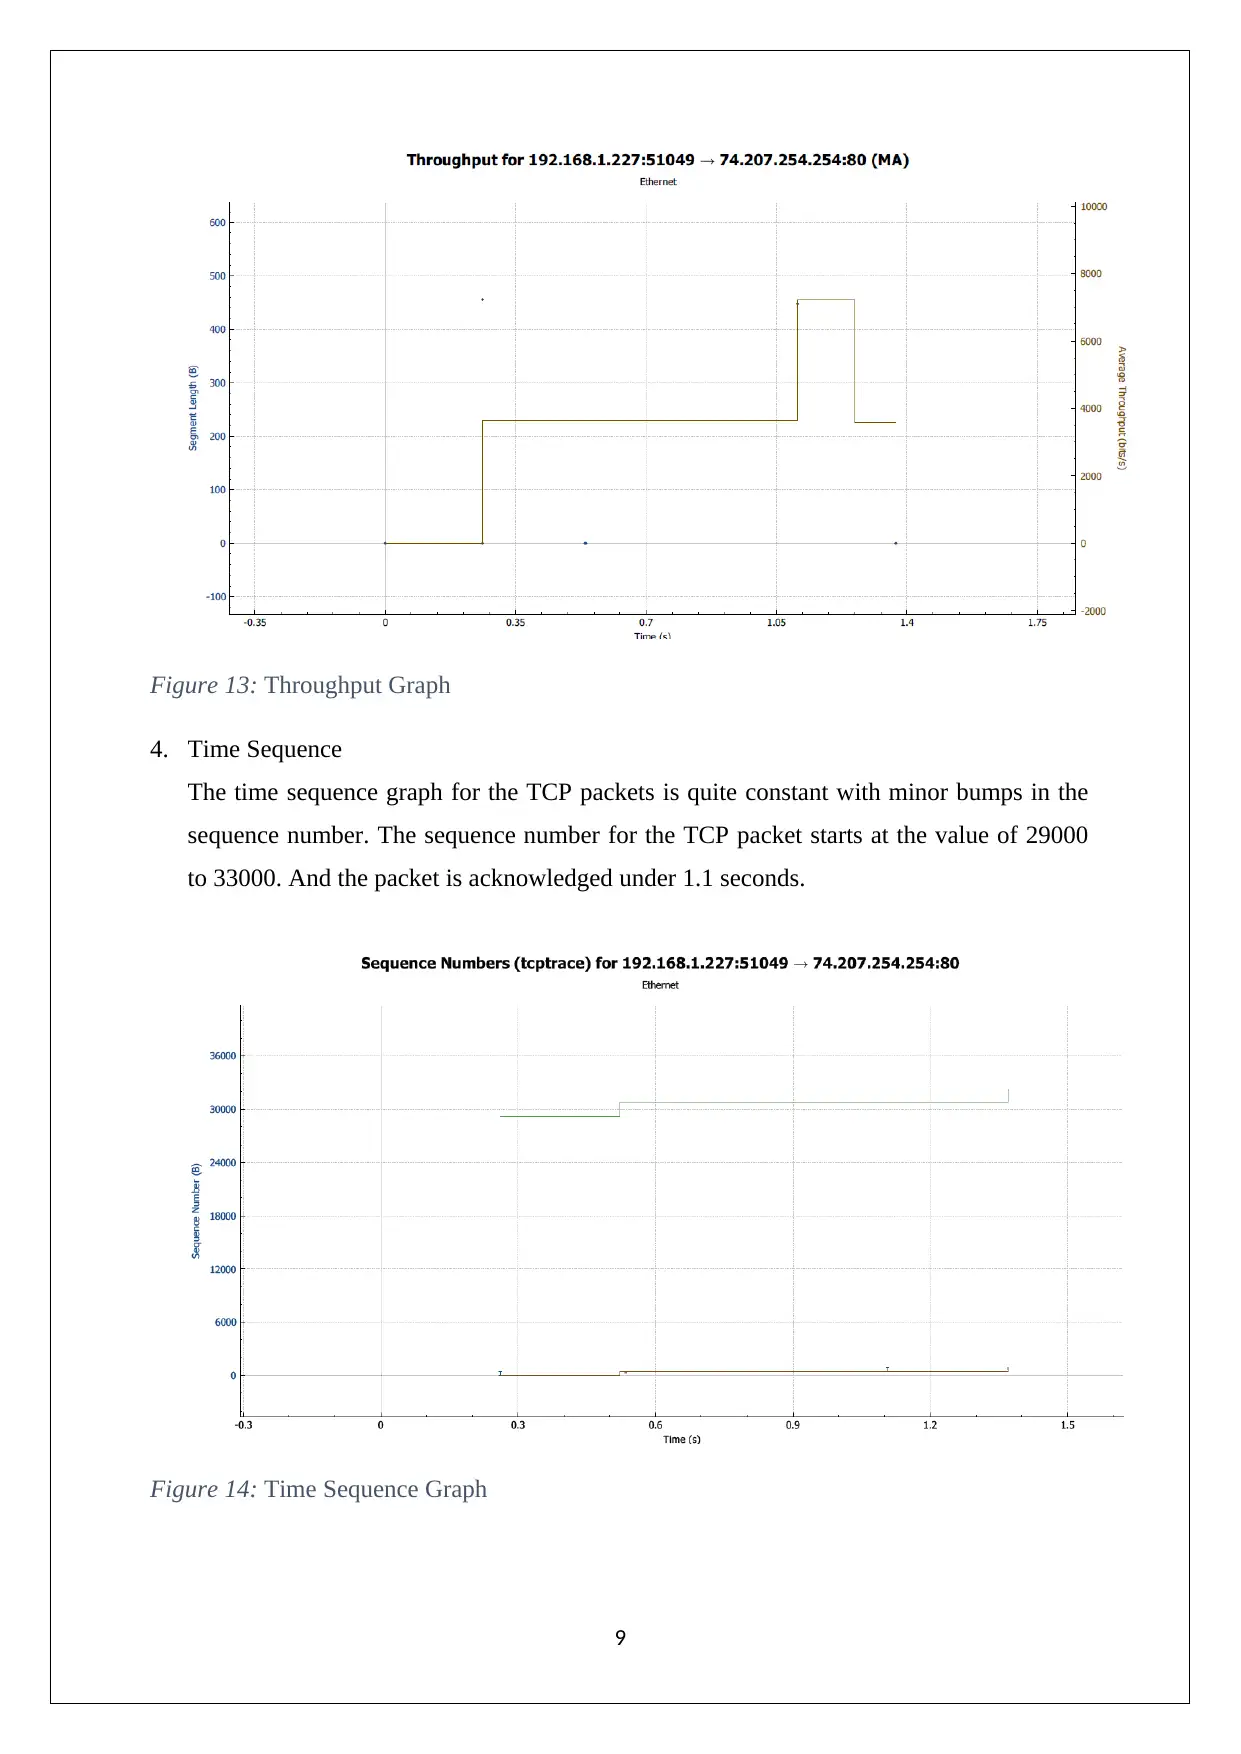
Figure 13: Throughput Graph
4. Time Sequence
The time sequence graph for the TCP packets is quite constant with minor bumps in the
sequence number. The sequence number for the TCP packet starts at the value of 29000
to 33000. And the packet is acknowledged under 1.1 seconds.
Figure 14: Time Sequence Graph
9
4. Time Sequence
The time sequence graph for the TCP packets is quite constant with minor bumps in the
sequence number. The sequence number for the TCP packet starts at the value of 29000
to 33000. And the packet is acknowledged under 1.1 seconds.
Figure 14: Time Sequence Graph
9
Secure Best Marks with AI Grader
Need help grading? Try our AI Grader for instant feedback on your assignments.
5. Window Scaling
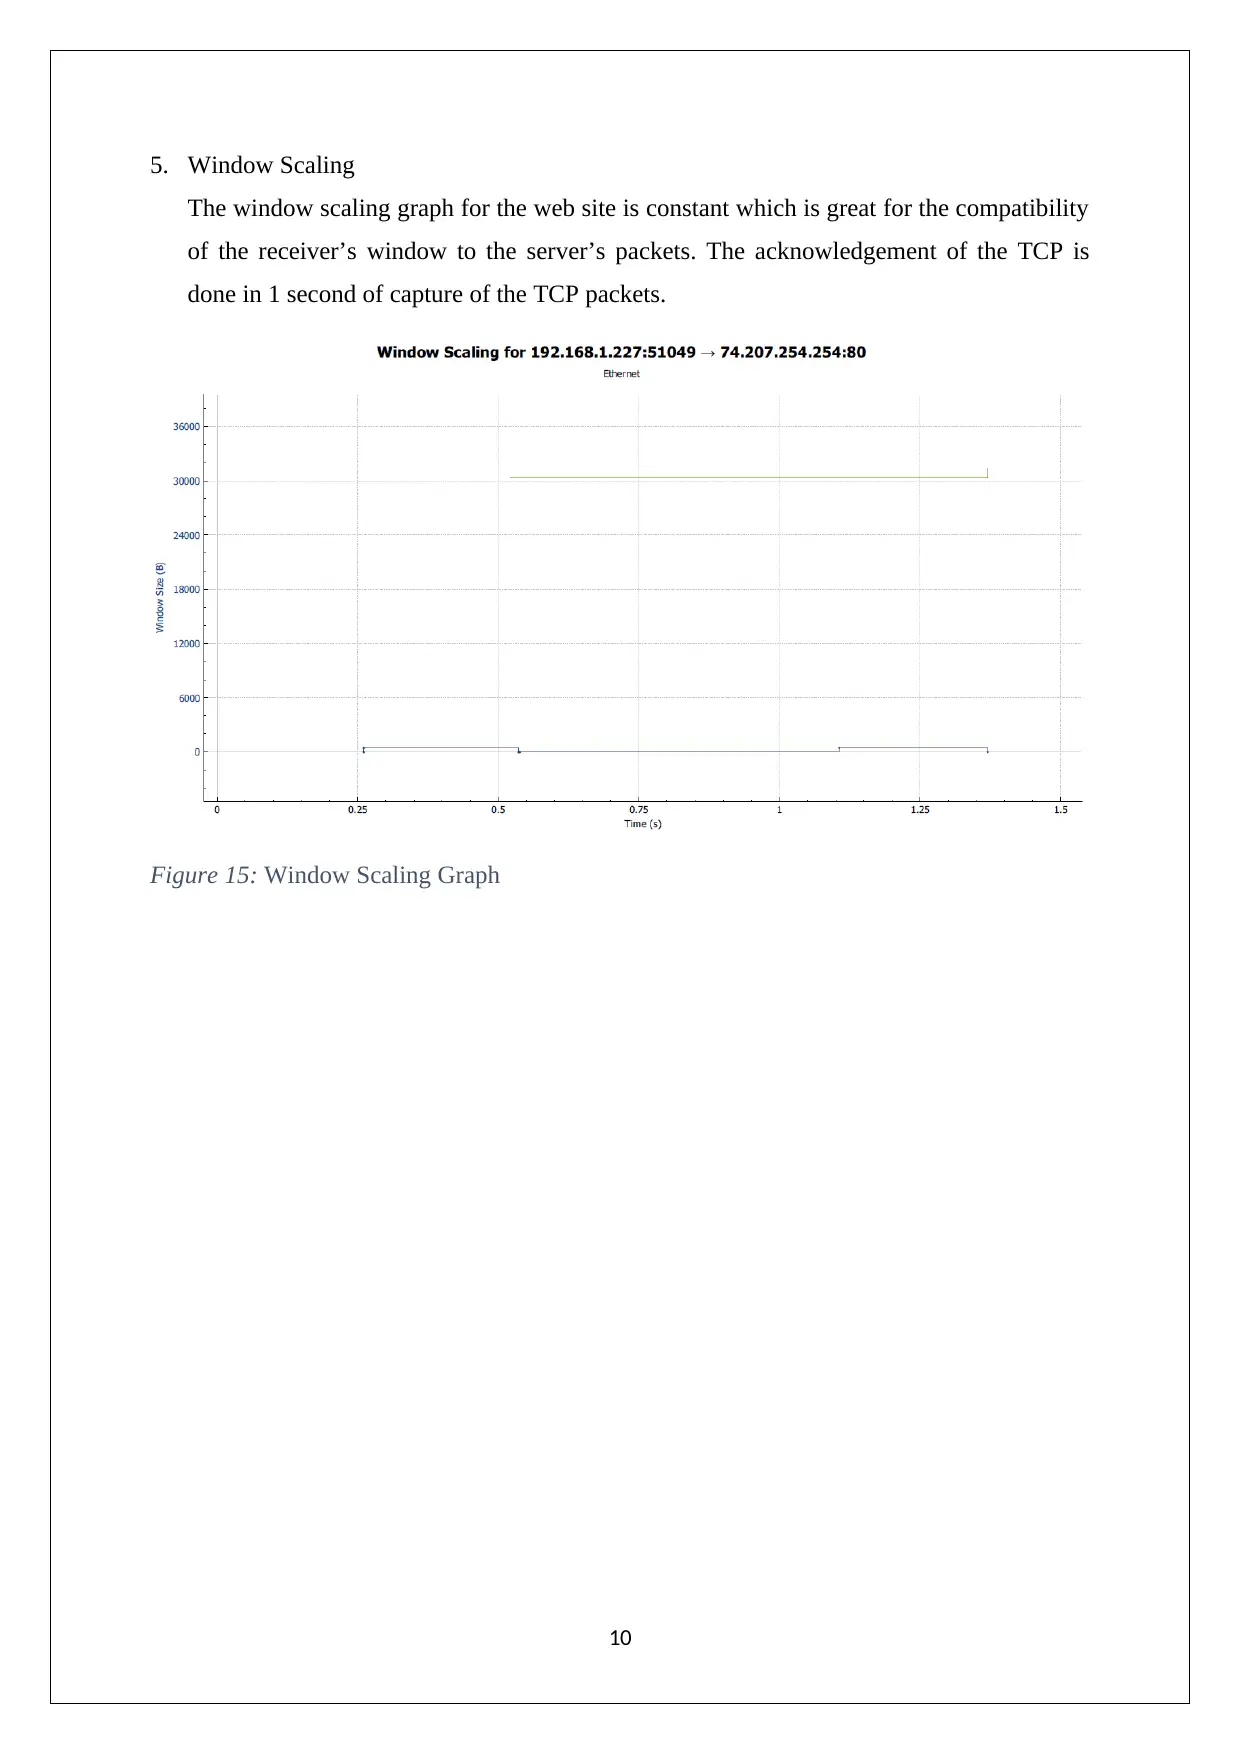
The window scaling graph for the web site is constant which is great for the compatibility
of the receiver’s window to the server’s packets. The acknowledgement of the TCP is
done in 1 second of capture of the TCP packets.
Figure 15: Window Scaling Graph
10
The window scaling graph for the web site is constant which is great for the compatibility
of the receiver’s window to the server’s packets. The acknowledgement of the TCP is
done in 1 second of capture of the TCP packets.
Figure 15: Window Scaling Graph
10
Task – 2
In this task an online radio web site is used to assess the knowledge of network performance
on the basis of throughput and time sequence. Following is the web site –
www.abc.net.au/radio/listen-online
1. Throughput Graph
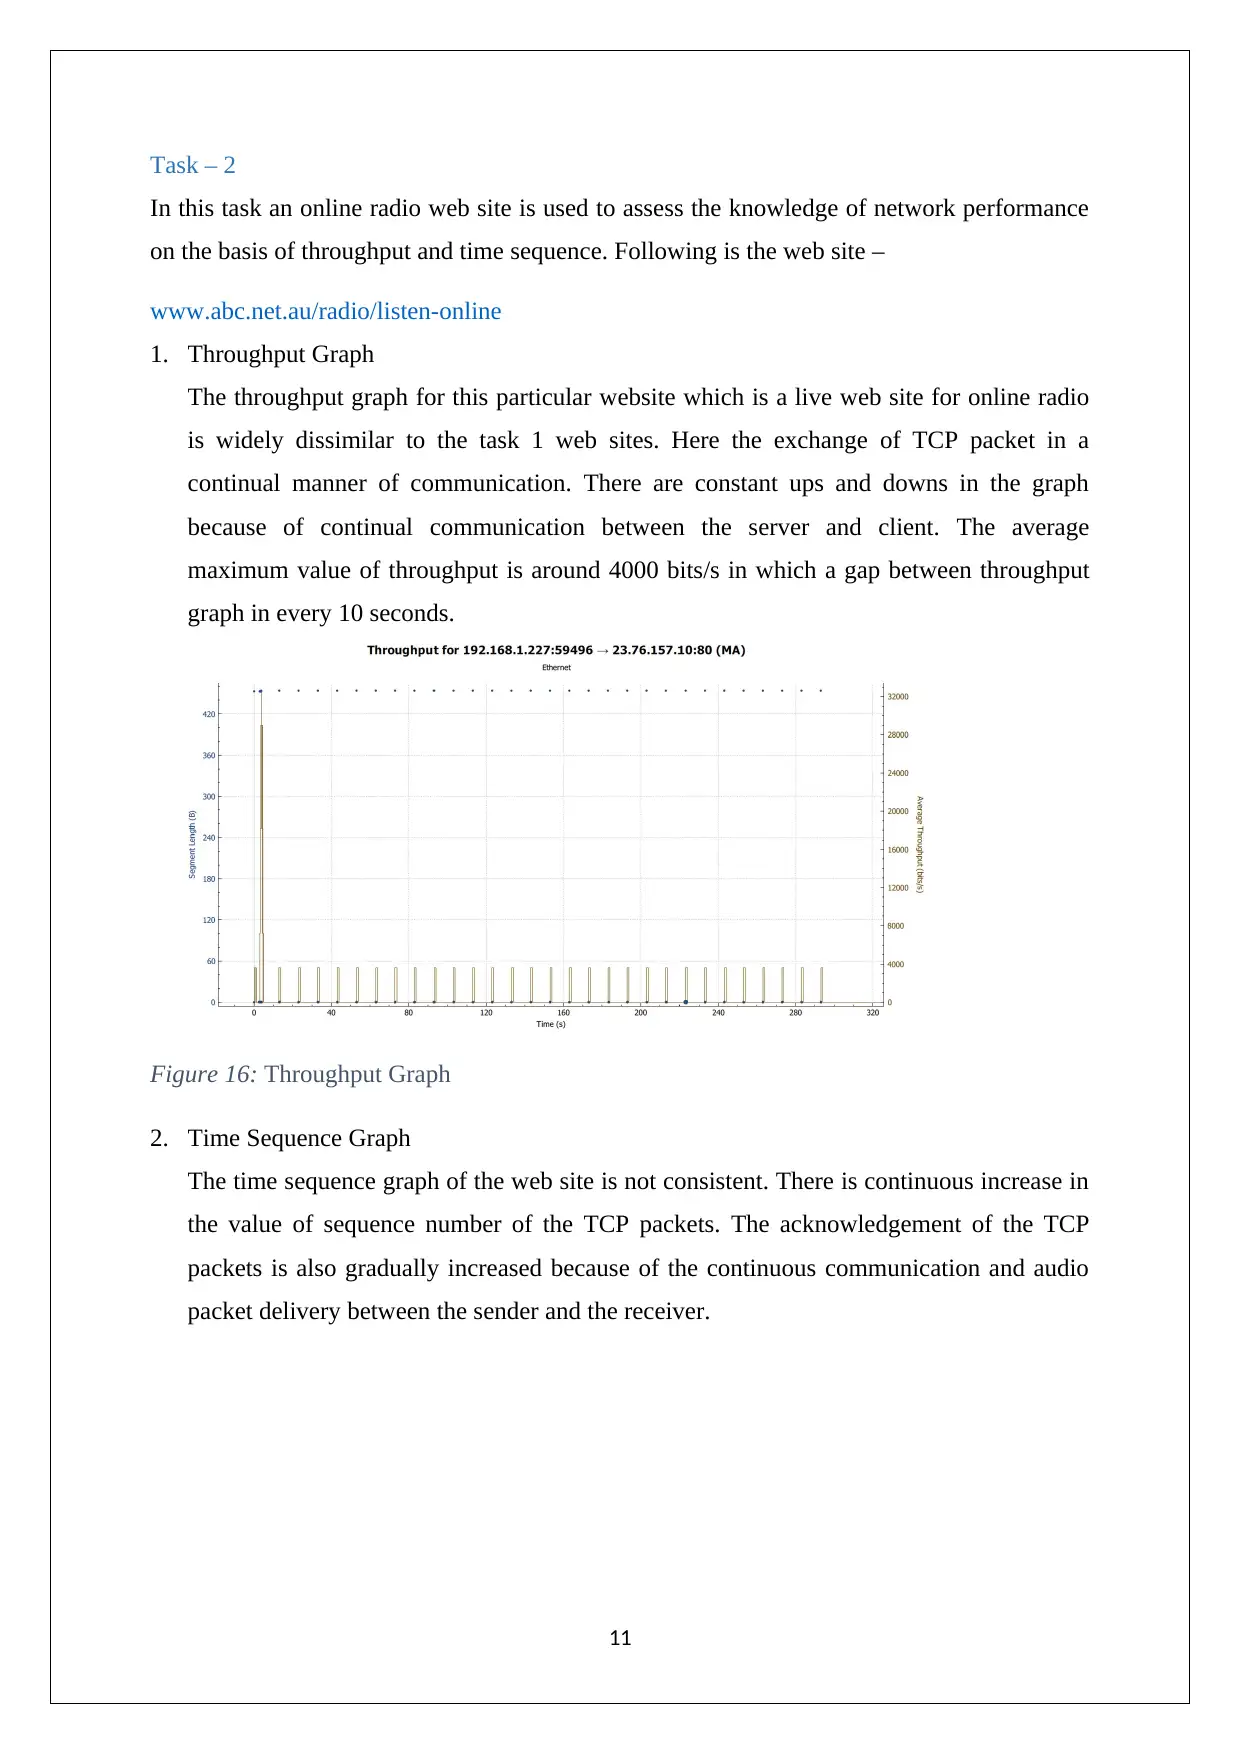
The throughput graph for this particular website which is a live web site for online radio
is widely dissimilar to the task 1 web sites. Here the exchange of TCP packet in a
continual manner of communication. There are constant ups and downs in the graph
because of continual communication between the server and client. The average
maximum value of throughput is around 4000 bits/s in which a gap between throughput
graph in every 10 seconds.
Figure 16: Throughput Graph
2. Time Sequence Graph
The time sequence graph of the web site is not consistent. There is continuous increase in
the value of sequence number of the TCP packets. The acknowledgement of the TCP
packets is also gradually increased because of the continuous communication and audio
packet delivery between the sender and the receiver.
11
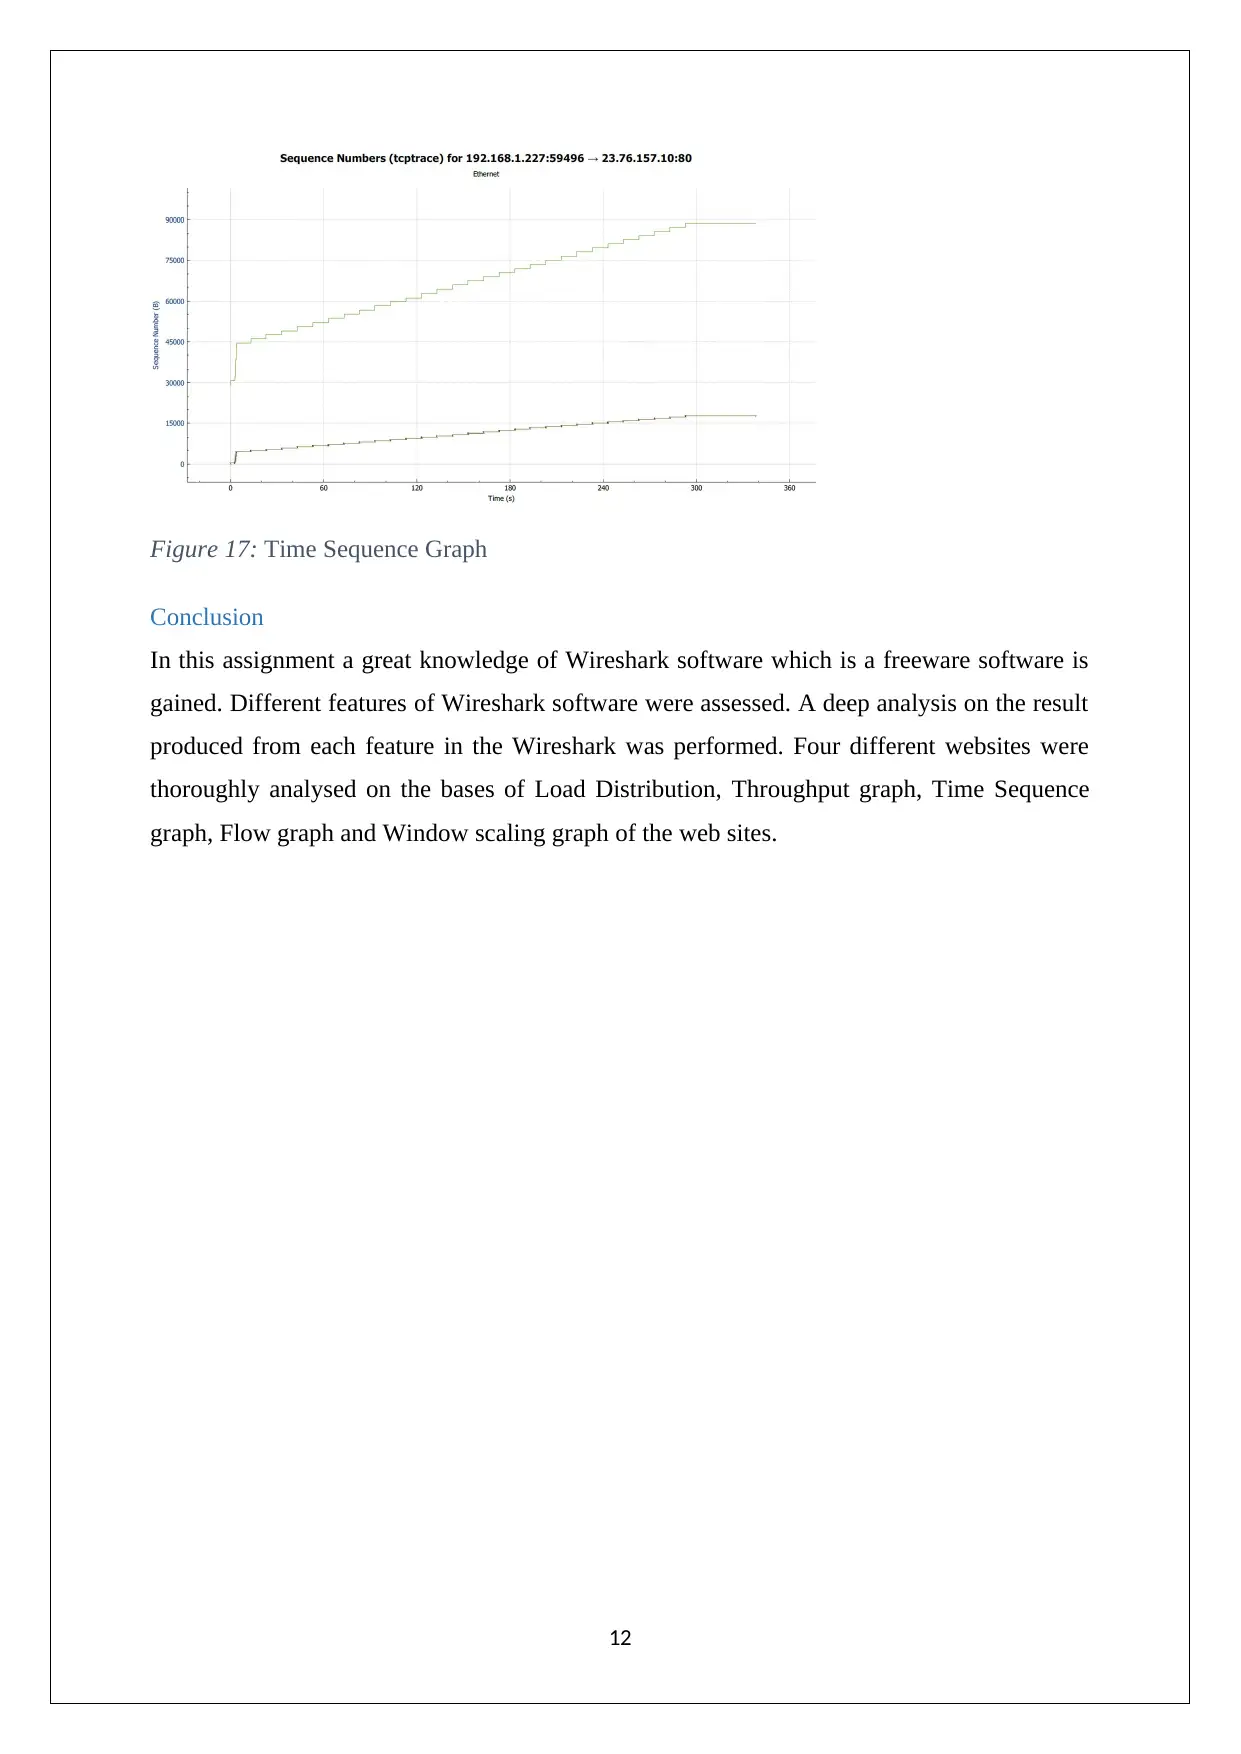
Figure 17: Time Sequence Graph
Conclusion
In this assignment a great knowledge of Wireshark software which is a freeware software is
gained. Different features of Wireshark software were assessed. A deep analysis on the result
produced from each feature in the Wireshark was performed. Four different websites were
thoroughly analysed on the bases of Load Distribution, Throughput graph, Time Sequence
graph, Flow graph and Window scaling graph of the web sites.
12
Paraphrase This Document
Need a fresh take? Get an instant paraphrase of this document with our AI Paraphraser
References
[1]"WIRESHARK - The Easy Tutorial - Statistics", Openmaniak.com, 2010. [Online].
Available: https://openmaniak.com/wireshark_stat.php. [Accessed: 01- Jun- 2018].
[2]S. Reeves, "Using the flow graph feature on Wireshark", TechRepublic, 2012. [Online].
Available: https://www.techrepublic.com/blog/linux-and-open-source/using-the-flow-
graph-feature-on-wireshark/. [Accessed: 01- Jun- 2018].
[3]"Understanding the tcptrace Time-Sequence Graph in Wireshark |
PacketBomb", Packetbomb.com, 2014. [Online]. Available:
http://packetbomb.com/understanding-the-tcptrace-time-sequence-graph-in-wireshark/.
[Accessed: 01- Jun- 2018].
[4]"What is the window scaling graph showing exactly and how to use it - Wireshark
Q&A", Osqa-ask.wireshark.org, 2013. [Online]. Available: https://osqa-
ask.wireshark.org/questions/27883/what-is-the-window-scaling-graph-showing-exactly-
and-how-to-use-it. [Accessed: 01- Jun- 2018].
[5]M. Rouse, "What is throughput? - Definition from WhatIs.com", SearchNetworking, 2018.
[Online]. Available: https://searchnetworking.techtarget.com/definition/throughput.
[Accessed: 01- Jun- 2018].
13
1 out of 14
Related Documents
Your All-in-One AI-Powered Toolkit for Academic Success.
+13062052269
info@desklib.com
Available 24*7 on WhatsApp / Email
![[object Object]](/_next/static/media/star-bottom.7253800d.svg)
Unlock your academic potential
© 2024 | Zucol Services PVT LTD | All rights reserved.


