Capital Budgeting: Investment Analysis for SSHA New Model in Finance
VerifiedAdded on 2023/06/11
|12
|2503
|434
Report
AI Summary
This report assesses the financial viability of Booli Enterprise's new Smart Speaker and Home Assistant (SSHA) model using several capital budgeting techniques. It calculates the non-discounted payback period, profitability index (PI), internal rate of return (IRR), and net present value (NPV) to determine the project's acceptability. Sensitivity analysis is conducted to evaluate the impact of changes in selling price and quantity on the project's NPV. The analysis reveals a positive NPV, a PI of 1.65, a payback period of 2.14 years, and an IRR of 19.7%, leading to the conclusion that the project is financially viable and should be pursued. The report also recommends incorporating potential losses from other products into the investment amount for a more accurate assessment and suggests that the project should only be accepted if the adjusted NPV remains positive.

Running head: BUSINESS FINANCE
Business finance
Name of the student
Name of the university
Student ID
Author note
Business finance
Name of the student
Name of the university
Student ID
Author note
Paraphrase This Document
Need a fresh take? Get an instant paraphrase of this document with our AI Paraphraser

1BUSINESS FINANCE
Table of Contents
Introduction................................................................................................................................2
1. Non-discounted payback period.........................................................................................2
2. Profitability index...............................................................................................................3
3. Internal rate of return..........................................................................................................3
4. Net present value................................................................................................................3
5. Sensitivity analysis for price change..................................................................................4
6. Sensitivity analysis for price change..................................................................................6
7. Conclusion..........................................................................................................................8
8. Recommendation................................................................................................................8
Reference....................................................................................................................................9
2BUSINESS FINANCE
Introduction
Booli Enterprise that manufactures the electronic goods from its business location in
Victoria deals with the profitable product Smart Speaker and Home Assistant (SSHA) and
various other products. However, the company generates maximum amount of revenue from
sales of SSHA and over the past few year the sale for the same is excellent. However, to
improve the technology and add some more features to the existing SSHA model, the
company is planning to manufacture a new model for SSHA. This report will focus on the
profitability of the investment that will be made to manufacture new model for SSHA. For
the purpose of analysis various methods like profitability index, net present value, payback
period, internal rate of return will be used. Further, the report will analyse the sensitivity of
the investment’s net present value with regard to the changes in the selling quantity and
selling price of new SSHA model (DeFusco et al. 2015).
1. Non-discounted payback period
The non-discounted payback period method under capital budgeting does not take
into consideration time value of the money. To be more specific, value of each dollar that is
earned on the investment is expected to be of same value. Payback method calculates number
of years required for returning the cash equal to the amount of investment. However, the
method does not give any importance to the amount received after the payback period
(Gorshkov et al. 2014).
Non-discounted payback period for the project –
Year Cash inflow Cumulative cash flow
0 $ (47,025,000.00)
1 $ 9,158,160.00 $ 9,158,160.00
2 $ 34,307,097.60 $ 43,465,257.60
⊘ This is a preview!⊘
Do you want full access?
Subscribe today to unlock all pages.
Trusted by 1+ million students worldwide

3BUSINESS FINANCE
3 $ 25,842,344.45 $ 69,307,602.05
4 $ 16,194,120.97 $ 85,501,723.02
5 $ 23,547,757.33 $ 109,049,480.35
Non-discounted payback period = 2 + (47,025,000 – 43.465,257.60) / (69,307,602.05 –
43,465,257.60) = 2.14 years.
2. Profitability index
It is the index that recognizes the relationship among the benefits and costs of the
investment that is calculated through dividing the present value of the future cash flows by
the amount of initial investment. It is also used to rank the project as it enables to quantify the
value generated for per unit of the investment (Pasqual, Padilla and Jadotte 2013).
PI = PV of future cash flows / Initial investment
PI = $ 77,573,881.43 / 47,025,000 = 1.65
Hence, the PI of new SSHA model is 1.65.
3. Internal rate of return
Internal rate of return or IRR is the capital budgeting metric that is used to measure
the profitability of the investment. It is the discount rate at which the cash inflows of the
project are equal to the cash outflows. In other words, the net cash flows become zero. IRR
depends on the same formula that is used for the calculation of NPV (Goodman et al. 2013).
As per the calculation in Excel, the internal rate of return for the project comes as 19.77%.
Paraphrase This Document
Need a fresh take? Get an instant paraphrase of this document with our AI Paraphraser
4BUSINESS FINANCE
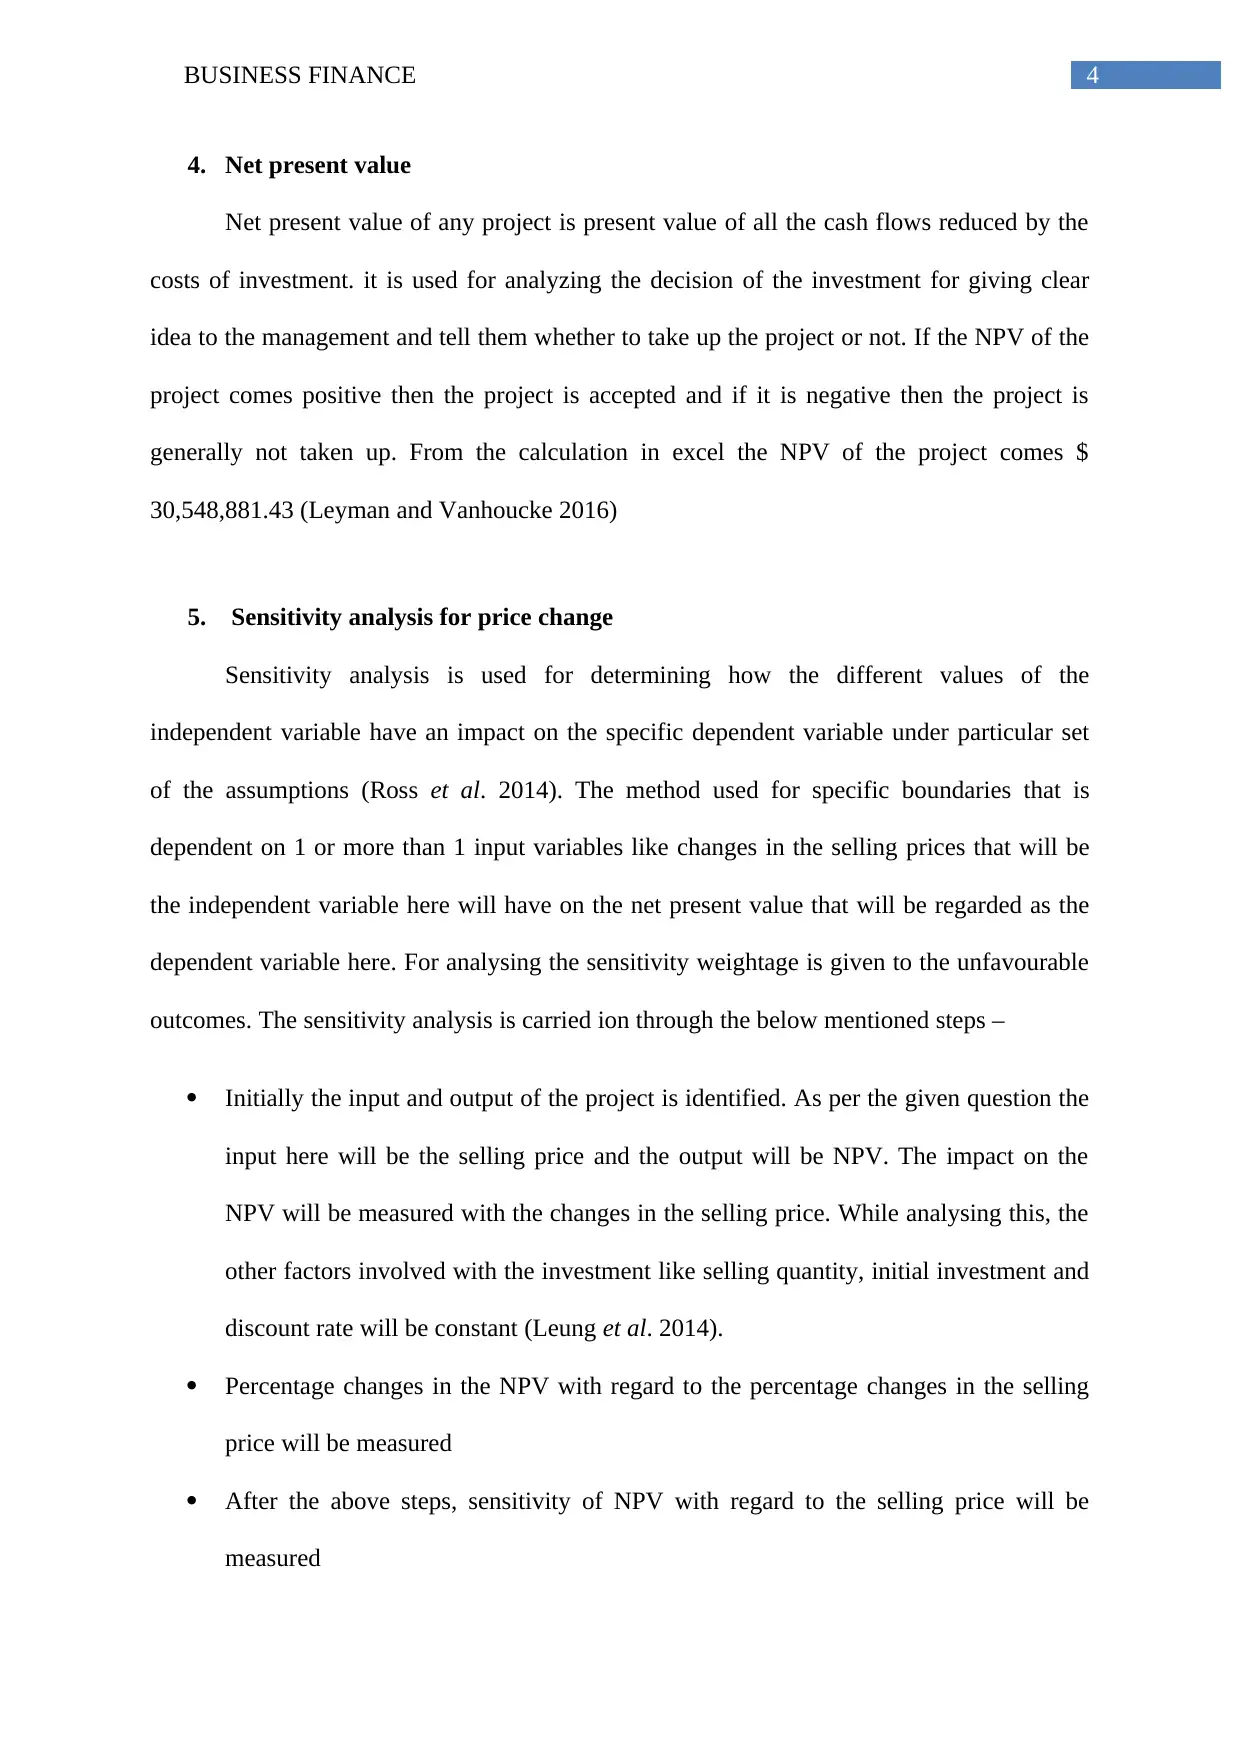
4. Net present value
Net present value of any project is present value of all the cash flows reduced by the
costs of investment. it is used for analyzing the decision of the investment for giving clear
idea to the management and tell them whether to take up the project or not. If the NPV of the
project comes positive then the project is accepted and if it is negative then the project is
generally not taken up. From the calculation in excel the NPV of the project comes $
30,548,881.43 (Leyman and Vanhoucke 2016)
5. Sensitivity analysis for price change
Sensitivity analysis is used for determining how the different values of the
independent variable have an impact on the specific dependent variable under particular set
of the assumptions (Ross et al. 2014). The method used for specific boundaries that is
dependent on 1 or more than 1 input variables like changes in the selling prices that will be
the independent variable here will have on the net present value that will be regarded as the
dependent variable here. For analysing the sensitivity weightage is given to the unfavourable
outcomes. The sensitivity analysis is carried ion through the below mentioned steps –
Initially the input and output of the project is identified. As per the given question the
input here will be the selling price and the output will be NPV. The impact on the
NPV will be measured with the changes in the selling price. While analysing this, the
other factors involved with the investment like selling quantity, initial investment and
discount rate will be constant (Leung et al. 2014).
Percentage changes in the NPV with regard to the percentage changes in the selling
price will be measured
After the above steps, sensitivity of NPV with regard to the selling price will be
measured
5BUSINESS FINANCE
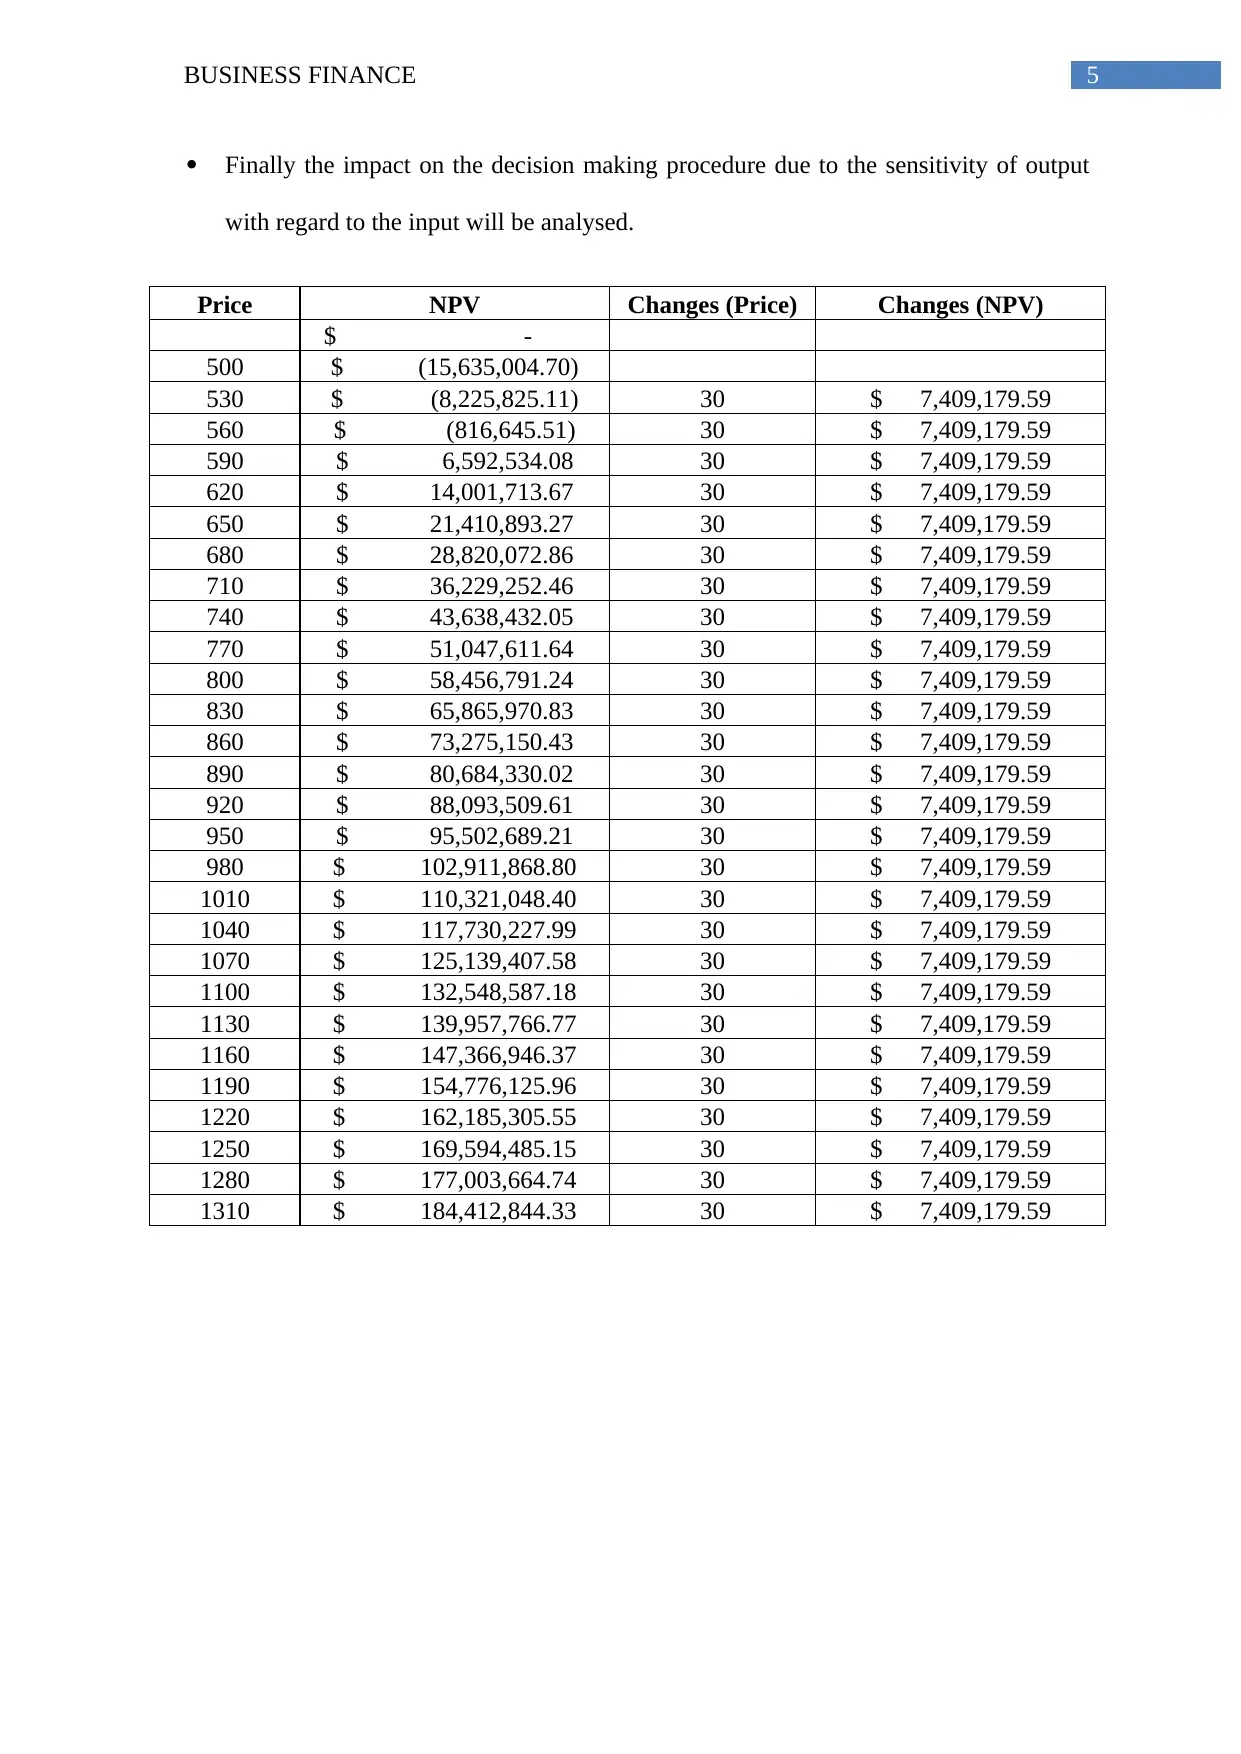
Finally the impact on the decision making procedure due to the sensitivity of output
with regard to the input will be analysed.
Price NPV Changes (Price) Changes (NPV)
$ -
500 $ (15,635,004.70)
530 $ (8,225,825.11) 30 $ 7,409,179.59
560 $ (816,645.51) 30 $ 7,409,179.59
590 $ 6,592,534.08 30 $ 7,409,179.59
620 $ 14,001,713.67 30 $ 7,409,179.59
650 $ 21,410,893.27 30 $ 7,409,179.59
680 $ 28,820,072.86 30 $ 7,409,179.59
710 $ 36,229,252.46 30 $ 7,409,179.59
740 $ 43,638,432.05 30 $ 7,409,179.59
770 $ 51,047,611.64 30 $ 7,409,179.59
800 $ 58,456,791.24 30 $ 7,409,179.59
830 $ 65,865,970.83 30 $ 7,409,179.59
860 $ 73,275,150.43 30 $ 7,409,179.59
890 $ 80,684,330.02 30 $ 7,409,179.59
920 $ 88,093,509.61 30 $ 7,409,179.59
950 $ 95,502,689.21 30 $ 7,409,179.59
980 $ 102,911,868.80 30 $ 7,409,179.59
1010 $ 110,321,048.40 30 $ 7,409,179.59
1040 $ 117,730,227.99 30 $ 7,409,179.59
1070 $ 125,139,407.58 30 $ 7,409,179.59
1100 $ 132,548,587.18 30 $ 7,409,179.59
1130 $ 139,957,766.77 30 $ 7,409,179.59
1160 $ 147,366,946.37 30 $ 7,409,179.59
1190 $ 154,776,125.96 30 $ 7,409,179.59
1220 $ 162,185,305.55 30 $ 7,409,179.59
1250 $ 169,594,485.15 30 $ 7,409,179.59
1280 $ 177,003,664.74 30 $ 7,409,179.59
1310 $ 184,412,844.33 30 $ 7,409,179.59
⊘ This is a preview!⊘
Do you want full access?
Subscribe today to unlock all pages.
Trusted by 1+ million students worldwide
6BUSINESS FINANCE
400 500 600 700 800 900 1000 1100 1200 1300 1400
$(50,000,000.00)
$-
$50,000,000.00
$100,000,000.00
$150,000,000.00
$200,000,000.00
Selling price
N
P
V
Changes in price 4%
Changes in NPV 24%
Sensitivity
555.41
%
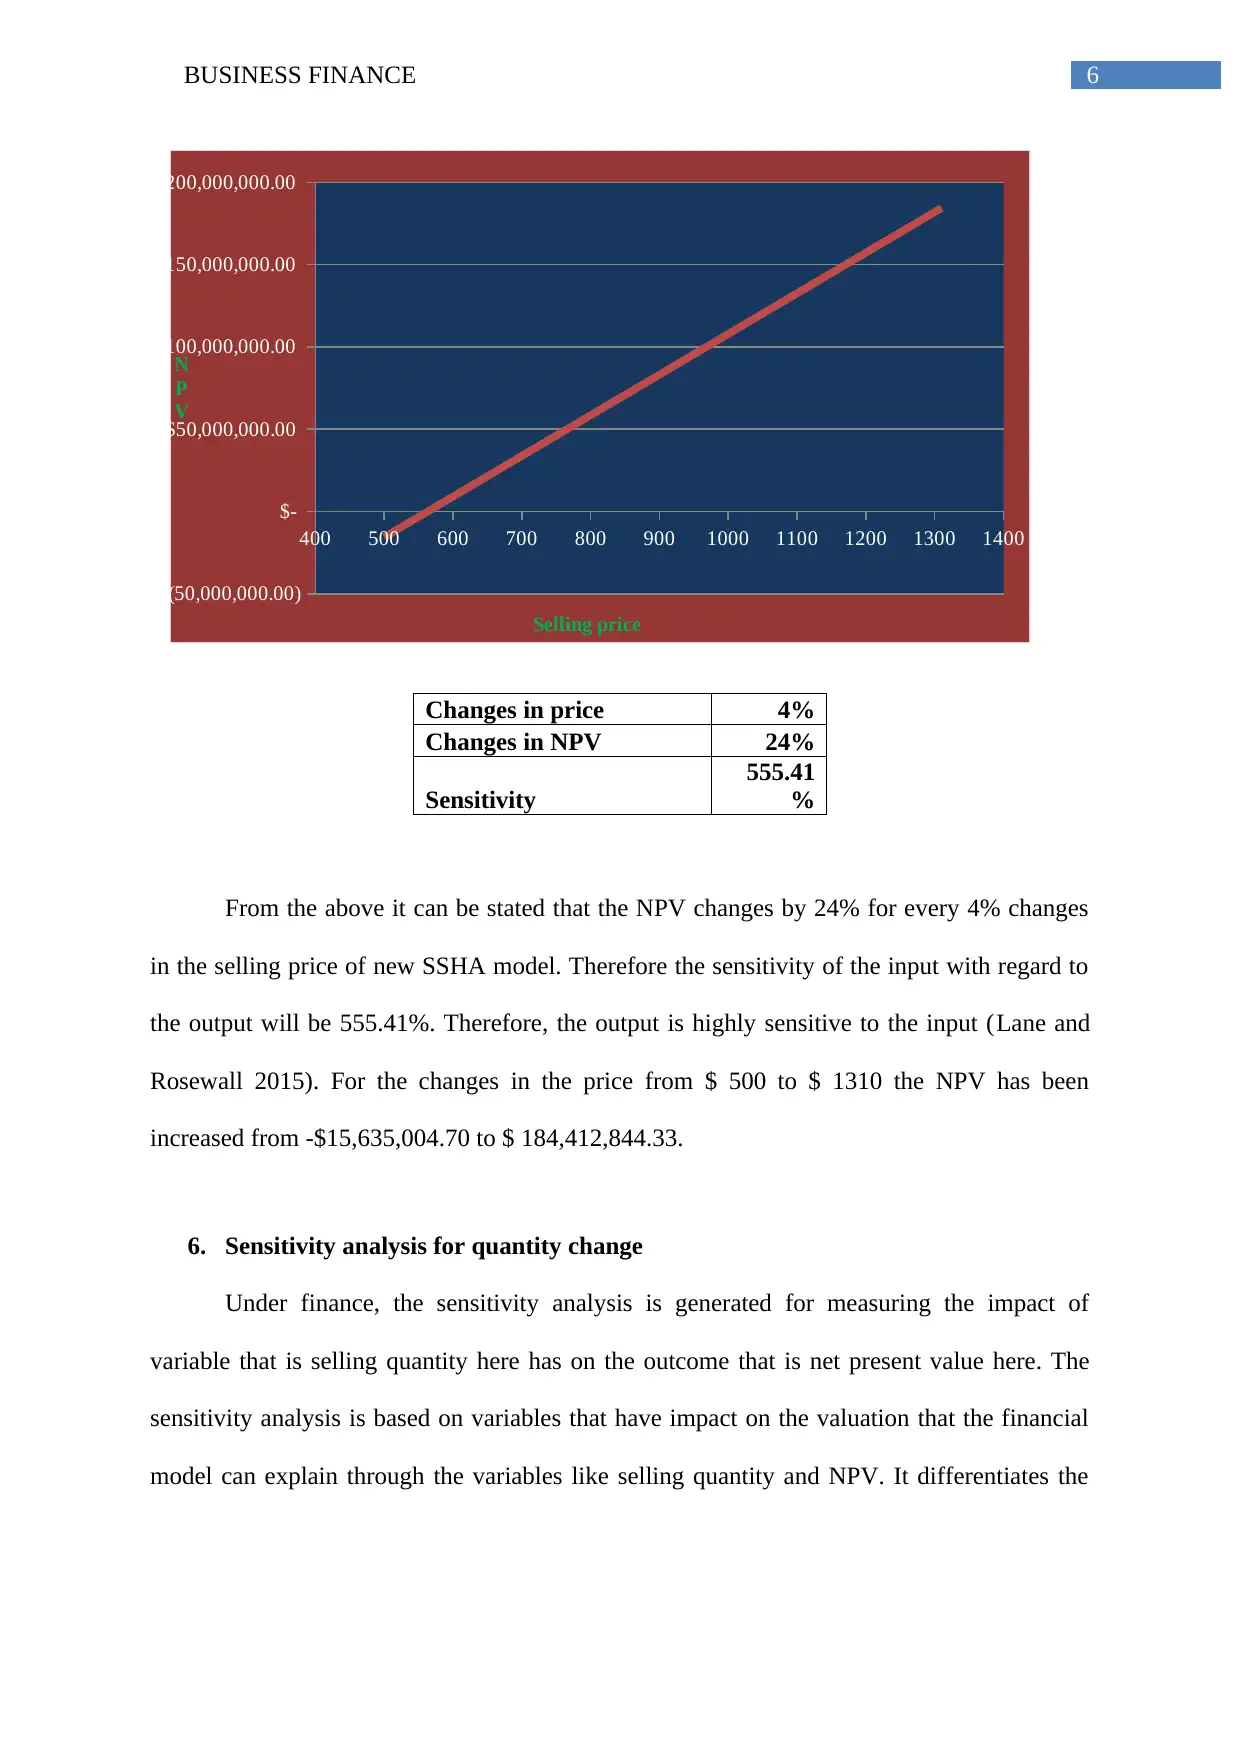
From the above it can be stated that the NPV changes by 24% for every 4% changes
in the selling price of new SSHA model. Therefore the sensitivity of the input with regard to
the output will be 555.41%. Therefore, the output is highly sensitive to the input (Lane and
Rosewall 2015). For the changes in the price from $ 500 to $ 1310 the NPV has been
increased from -$15,635,004.70 to $ 184,412,844.33.
6. Sensitivity analysis for quantity change
Under finance, the sensitivity analysis is generated for measuring the impact of
variable that is selling quantity here has on the outcome that is net present value here. The
sensitivity analysis is based on variables that have impact on the valuation that the financial
model can explain through the variables like selling quantity and NPV. It differentiates the
400 500 600 700 800 900 1000 1100 1200 1300 1400
$(50,000,000.00)
$-
$50,000,000.00
$100,000,000.00
$150,000,000.00
$200,000,000.00
Selling price
N
P
V
Changes in price 4%
Changes in NPV 24%
Sensitivity
555.41
%
From the above it can be stated that the NPV changes by 24% for every 4% changes
in the selling price of new SSHA model. Therefore the sensitivity of the input with regard to
the output will be 555.41%. Therefore, the output is highly sensitive to the input (Lane and
Rosewall 2015). For the changes in the price from $ 500 to $ 1310 the NPV has been
increased from -$15,635,004.70 to $ 184,412,844.33.
6. Sensitivity analysis for quantity change
Under finance, the sensitivity analysis is generated for measuring the impact of
variable that is selling quantity here has on the outcome that is net present value here. The
sensitivity analysis is based on variables that have impact on the valuation that the financial
model can explain through the variables like selling quantity and NPV. It differentiates the
Paraphrase This Document
Need a fresh take? Get an instant paraphrase of this document with our AI Paraphraser
7BUSINESS FINANCE
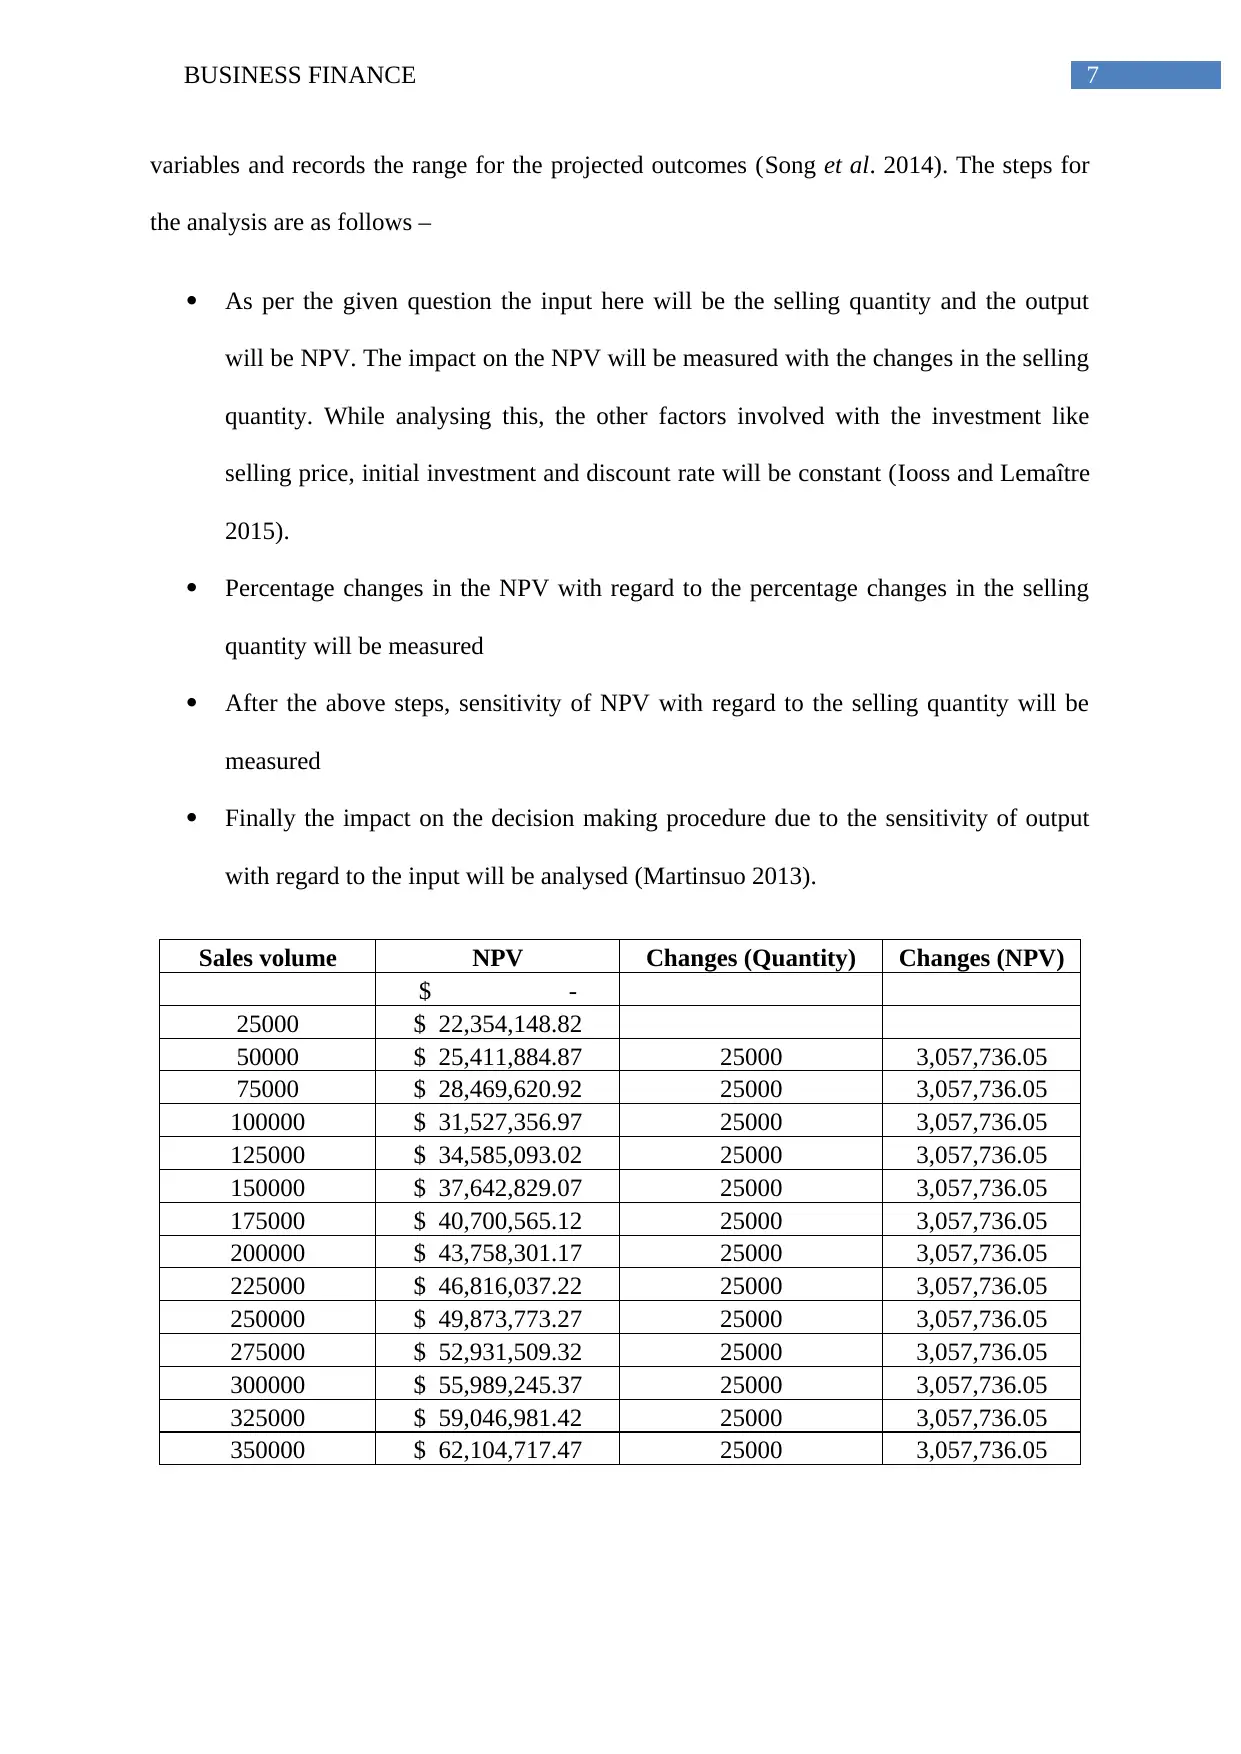
variables and records the range for the projected outcomes (Song et al. 2014). The steps for
the analysis are as follows –
As per the given question the input here will be the selling quantity and the output
will be NPV. The impact on the NPV will be measured with the changes in the selling
quantity. While analysing this, the other factors involved with the investment like
selling price, initial investment and discount rate will be constant (Iooss and Lemaître
2015).
Percentage changes in the NPV with regard to the percentage changes in the selling
quantity will be measured
After the above steps, sensitivity of NPV with regard to the selling quantity will be
measured
Finally the impact on the decision making procedure due to the sensitivity of output
with regard to the input will be analysed (Martinsuo 2013).
Sales volume NPV Changes (Quantity) Changes (NPV)
$ -
25000 $ 22,354,148.82
50000 $ 25,411,884.87 25000 3,057,736.05
75000 $ 28,469,620.92 25000 3,057,736.05
100000 $ 31,527,356.97 25000 3,057,736.05
125000 $ 34,585,093.02 25000 3,057,736.05
150000 $ 37,642,829.07 25000 3,057,736.05
175000 $ 40,700,565.12 25000 3,057,736.05
200000 $ 43,758,301.17 25000 3,057,736.05
225000 $ 46,816,037.22 25000 3,057,736.05
250000 $ 49,873,773.27 25000 3,057,736.05
275000 $ 52,931,509.32 25000 3,057,736.05
300000 $ 55,989,245.37 25000 3,057,736.05
325000 $ 59,046,981.42 25000 3,057,736.05
350000 $ 62,104,717.47 25000 3,057,736.05
8BUSINESS FINANCE
0 50000 100000 150000 200000 250000 300000 350000 400000
$-
$10,000,000.00
$20,000,000.00
$30,000,000.00
$40,000,000.00
$50,000,000.00
$60,000,000.00
$70,000,000.00
Sales volume
N
P
V
Changes in quantity 27%
Changes in NPV 10%
Sensitivity 36.83%
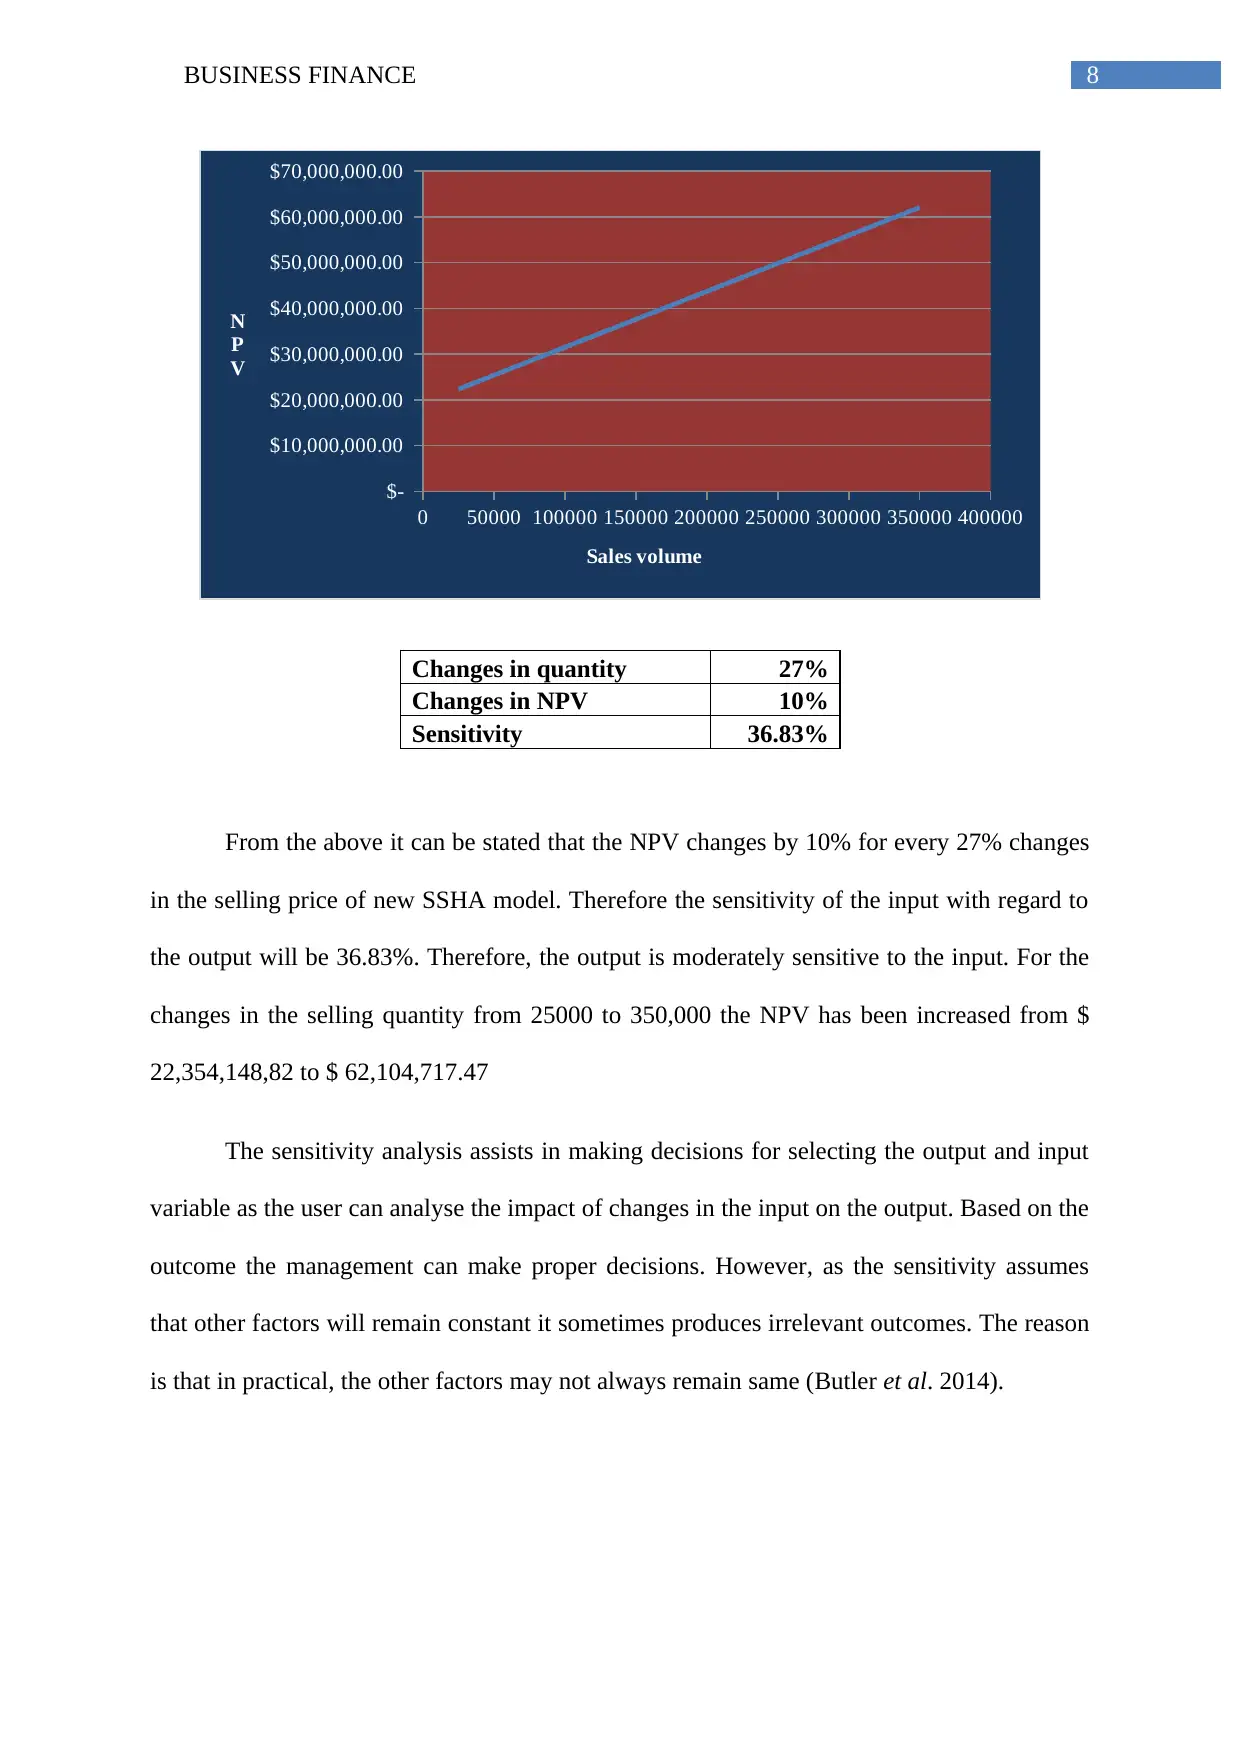
From the above it can be stated that the NPV changes by 10% for every 27% changes
in the selling price of new SSHA model. Therefore the sensitivity of the input with regard to
the output will be 36.83%. Therefore, the output is moderately sensitive to the input. For the
changes in the selling quantity from 25000 to 350,000 the NPV has been increased from $
22,354,148,82 to $ 62,104,717.47
The sensitivity analysis assists in making decisions for selecting the output and input
variable as the user can analyse the impact of changes in the input on the output. Based on the
outcome the management can make proper decisions. However, as the sensitivity assumes
that other factors will remain constant it sometimes produces irrelevant outcomes. The reason
is that in practical, the other factors may not always remain same (Butler et al. 2014).
0 50000 100000 150000 200000 250000 300000 350000 400000
$-
$10,000,000.00
$20,000,000.00
$30,000,000.00
$40,000,000.00
$50,000,000.00
$60,000,000.00
$70,000,000.00
Sales volume
N
P
V
Changes in quantity 27%
Changes in NPV 10%
Sensitivity 36.83%
From the above it can be stated that the NPV changes by 10% for every 27% changes
in the selling price of new SSHA model. Therefore the sensitivity of the input with regard to
the output will be 36.83%. Therefore, the output is moderately sensitive to the input. For the
changes in the selling quantity from 25000 to 350,000 the NPV has been increased from $
22,354,148,82 to $ 62,104,717.47
The sensitivity analysis assists in making decisions for selecting the output and input
variable as the user can analyse the impact of changes in the input on the output. Based on the
outcome the management can make proper decisions. However, as the sensitivity assumes
that other factors will remain constant it sometimes produces irrelevant outcomes. The reason
is that in practical, the other factors may not always remain same (Butler et al. 2014).
⊘ This is a preview!⊘
Do you want full access?
Subscribe today to unlock all pages.
Trusted by 1+ million students worldwide
9BUSINESS FINANCE
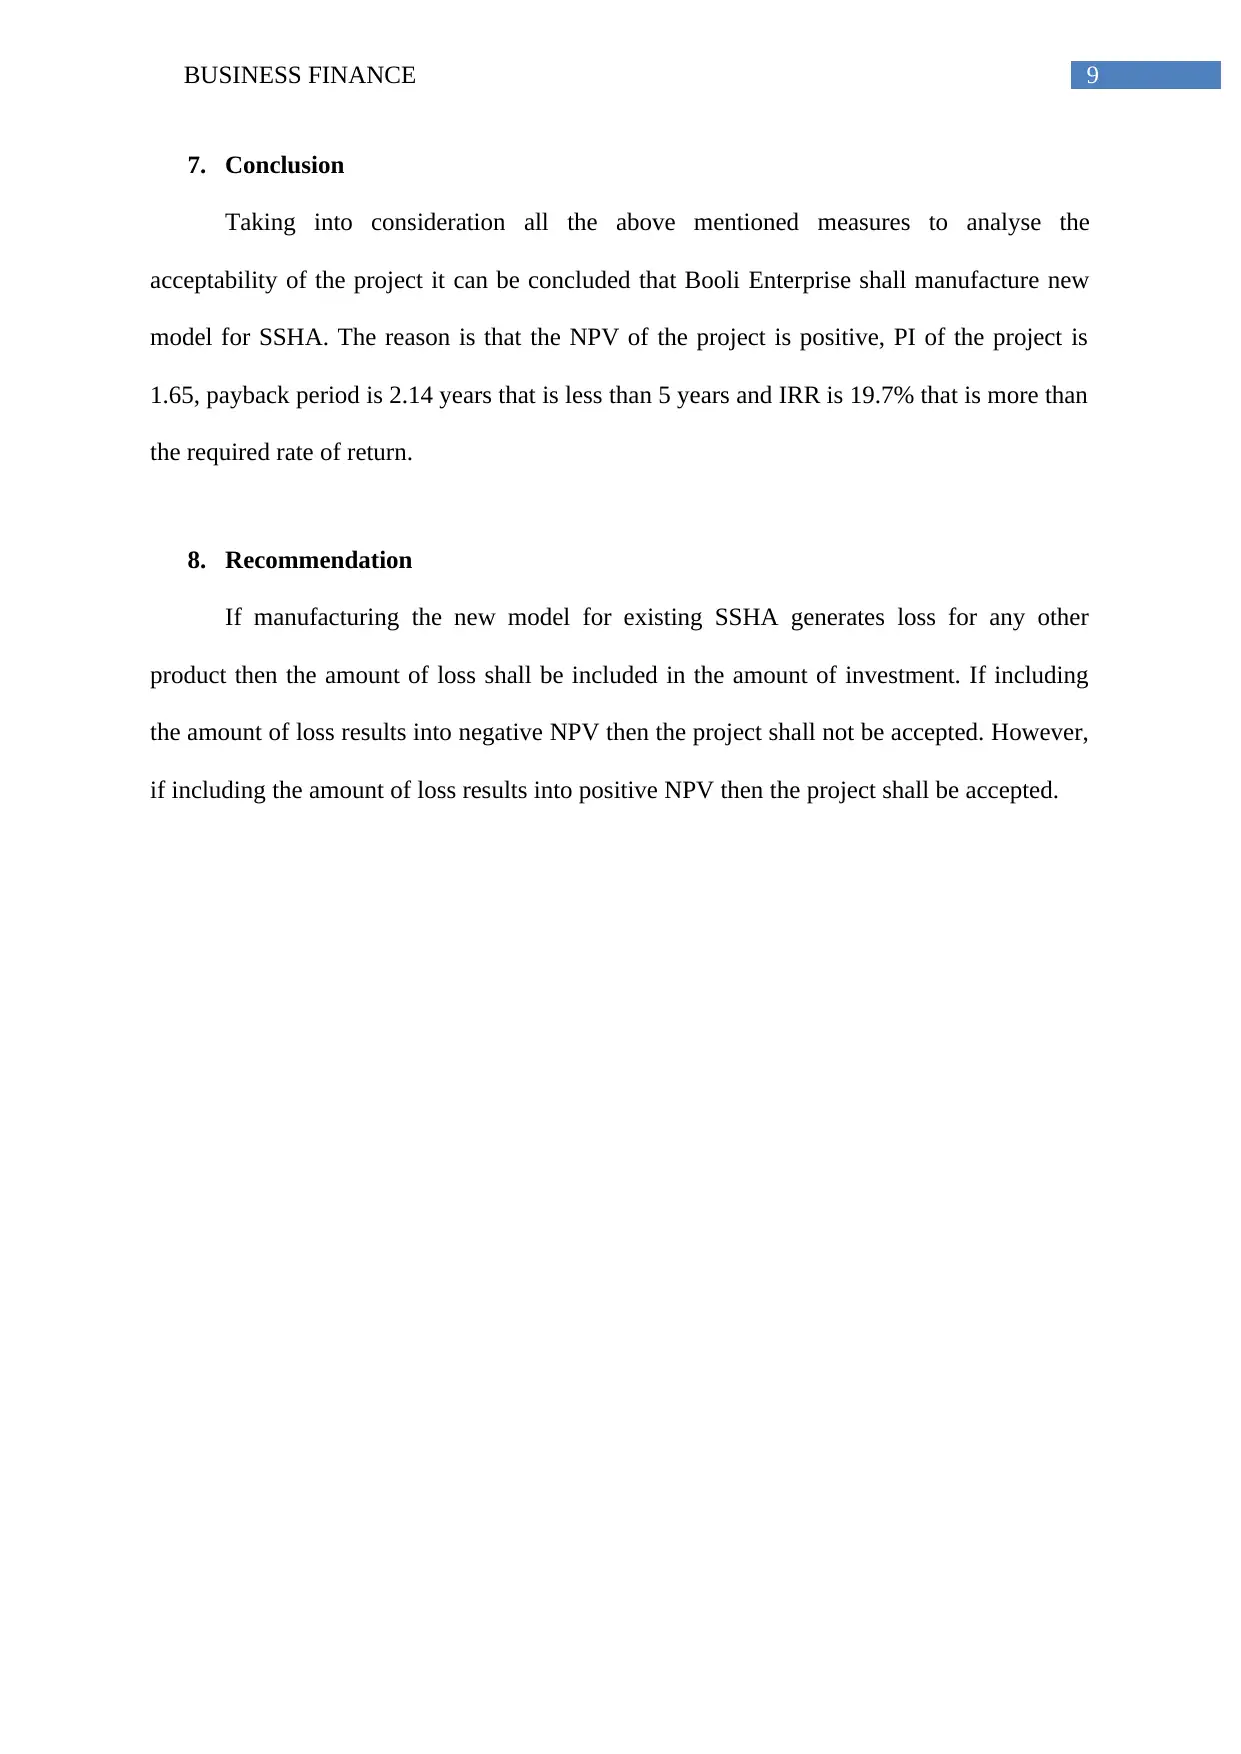
7. Conclusion
Taking into consideration all the above mentioned measures to analyse the
acceptability of the project it can be concluded that Booli Enterprise shall manufacture new
model for SSHA. The reason is that the NPV of the project is positive, PI of the project is
1.65, payback period is 2.14 years that is less than 5 years and IRR is 19.7% that is more than
the required rate of return.
8. Recommendation
If manufacturing the new model for existing SSHA generates loss for any other
product then the amount of loss shall be included in the amount of investment. If including
the amount of loss results into negative NPV then the project shall not be accepted. However,
if including the amount of loss results into positive NPV then the project shall be accepted.
Paraphrase This Document
Need a fresh take? Get an instant paraphrase of this document with our AI Paraphraser
10BUSINESS FINANCE
Reference
Butler, M.P., Reed, P.M., Fisher-Vanden, K., Keller, K. and Wagener, T., 2014. Identifying
parametric controls and dependencies in integrated assessment models using global
sensitivity analysis. Environmental modelling & software, 59, pp.10-29.
DeFusco, R.A., McLeavey, D.W., Pinto, J.E., Anson, M.J. and Runkle, D.E.,
2015. Quantitative investment analysis. John Wiley & Sons.
Goodman, T.H., Neamtiu, M., Shroff, N. and White, H.D., 2013. Management forecast
quality and capital investment decisions. The Accounting Review, 89(1), pp.331-365.
Gorshkov, A.S., Rymkevich, P.P., Nemova, D.V. and Vatin, N.I., 2014. Method of
calculating the payback period of investment for renovation of building facades. Stroitel'stvo
Unikal'nyh Zdanij i Sooruzenij, (2), p.82.
Iooss, B. and Lemaître, P., 2015. A review on global sensitivity analysis methods.
In Uncertainty management in simulation-optimization of complex systems (pp. 101-122).
Springer, Boston, MA.
Lane, K. and Rosewall, T., 2015. Firms’ investment decisions and interest rates. Reserve
Bank of Australia Bulletin. June quarter, pp.1-7.
Leung, B., Springborn, M.R., Turner, J.A. and Brockerhoff, E.G., 2014. Pathway‐level risk
analysis: the net present value of an invasive species policy in the US. Frontiers in Ecology
and the Environment, 12(5), pp.273-279.
Leyman, P. and Vanhoucke, M., 2016. Payment models and net present value optimization
for resource-constrained project scheduling. Computers & Industrial Engineering, 91,
pp.139-153.
11BUSINESS FINANCE
Martinsuo, M., 2013. Project portfolio management in practice and in context. International
Journal of Project Management, 31(6), pp.794-803.
Pasqual, J., Padilla, E. and Jadotte, E., 2013. Equivalence of different profitability criteria
with the net present value. International Journal of Production Economics, 142(1), pp.205-
210.
Ross, S.A., Bianchi, R., Christensen, M., Drew, M., Westerfield, R. and Jordan, B.D.,
2014. Fundamentals of Corporate Finance: Introduction to corporate finance Chapter: 2
Financial statements, taxes and cash flow PART 2 Chapter: 3 Working with financial
statements Chapter: 4 Long-term financial planning and corporate growth PART 3 Chapter: 5
First principles of valuation: TVM Chapter: 6 Valuing shares and bonds PART 4 Chapter: 7
Net present value and other investment criteria Chapter: 8 Making capital investment
decisions Chapter: 9 Project analysis and evaluation PART 5 Chapter: 10 Lessons ....
McGraw-Hill Education (Australia).
Song, Z., Li, Z., Wei, M., Lai, F. and Bai, B., 2014. Sensitivity analysis of water-alternating-
CO2 flooding for enhanced oil recovery in high water cut oil reservoirs. Computers &
Fluids, 99, pp.93-103.
⊘ This is a preview!⊘
Do you want full access?
Subscribe today to unlock all pages.
Trusted by 1+ million students worldwide
1 out of 12
Related Documents


Your All-in-One AI-Powered Toolkit for Academic Success.
+13062052269
info@desklib.com
Available 24*7 on WhatsApp / Email
![[object Object]](/_next/static/media/star-bottom.7253800d.svg)
Unlock your academic potential
Copyright © 2020–2026 A2Z Services. All Rights Reserved. Developed and managed by ZUCOL.