Ask a question from expert
Nike: Global Sports Brand - Shoes, Apparel, Equipment
8 Pages3035 Words189 Views
Added on 2020-12-08
Nike: Global Sports Brand - Shoes, Apparel, Equipment
Added on 2020-12-08
BookmarkShareRelated Documents
NikeCompany Overview: Nike is a multinational firm that is specialized in the design, development,marketing and selling of athletic footwear, apparel, equipment, accessories and services. The company’sheadquarters are located in Oregon, USA.Nike is the world largest supplier of athletics shoes, clothes anda major manufacturer of sport equipment with a revenue of 34.3 billion dollars in 2017 (source:NASDAQ) and it employed more than 74 400 people worldwide. Their success is due to the number ofsport partnership they have with the official sports teams, the players... The major competitors in thismarket are Adidas, Puma and Under Armour.Company History: Phil Knight and Bill Bowerman, a track runner and his coach, founded Blue RibbonsSports on January 20th, 1964. They earned a total of $8,000, selling 1,300 pairs of running shoes, andofficially became Nike Inc. on May 30st, 1971.Product: The core product of Nike is sports shoes designed for specific sports along with a wide range ofsports equipment entering the following categories : Running, Basketball, Outdoor activities, Tennis,Golf, Soccer, Baseball, American Football, Volleyball.Organization: Nike Inc. has adopted a corporate structure, flexible enough to enable adjustments whenneeded for regional variations in demand. It is called a geographic divisional organizational structure,which main features are : global corporate leadership (worldwide brand decisions), semi-autonomousgeographic divisions (North America, Western Europe, Central and Eastern Europe, Greater China,Japan, Emerging markets), and global division for Converse (managing Converse worldwide) and one forNike’s brand licensing.Recent strategyThe last strategy adopted by Nike is an advertising strategy, they spend around 3 billion dollars inadvertising each year. Their concept is to promote their new products endorsing celebrities. Forexample for soccer boots they took Cristiano Ronaldo, for golf they took Tiger Woods, for theBasketBall they chose Lebron James and Michael Jordan.They try to focus on the technologies producing for example a shoe that will auto-lace when youput it in your feet, they were working on it during 10 years.Nike provides also a wide variety of products to a large number of sports to capture great marketshare and try to catch a lot of sports celebrity, to attract consumers showing them that there areonly the best who wear the nike brand.Perspectives50 billion dollars in annual revenue by 2020Nike is planning to expand Jordan Brand outside basketball and double its salesNike is trying to ignite females sneaker culturethey are working on a 3D printed cushioning system they would like to conquer the chinese market and to be the best worldwide.Key facts:Nike is actually the Greek goddess of VictoryThe company initially operated as a distributor for the Japanese shoe maker Onitsuka Tiger,which then became ASICSBy 1980, Nike had reached a 50% market share in the U.S. athletic shoe market, and the companywent public in December of that yearIt owns four key subsidiaries : Cole Haan, Hurley International, Converse Inc and UmbroMichael Jordan makes more money from Nike annually tha, all of the Nike factory workers inMalaysia combined.Income Statement Ratios:Analysis ofRatioFormula201520162017Industry orcompetitors 2017ProfitabilitySales Growth(Salesn+1)−(Salesn)Salesn5.80%6.10%5.96%2.22%Gross profitmarginNetSales−COGSNetSales45.37%46.24%44.58%47.6%
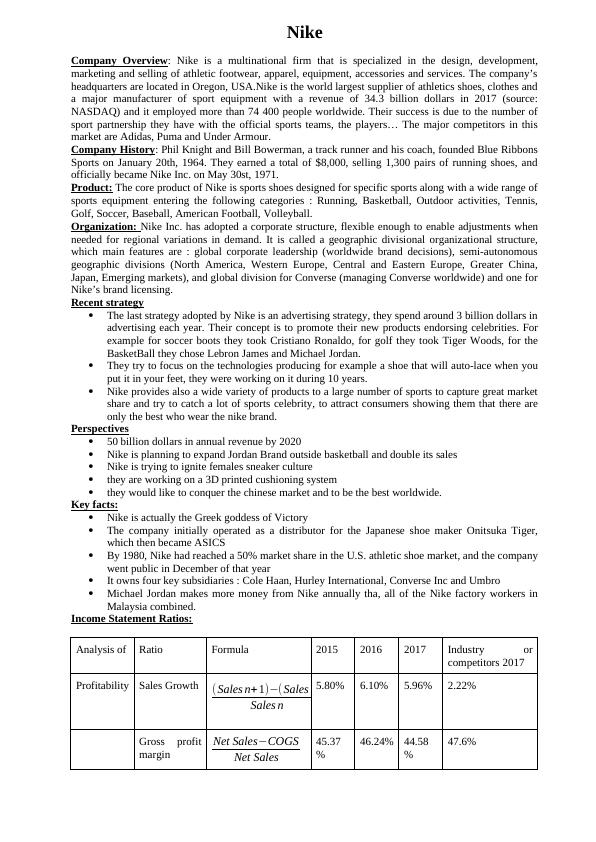
Operatingmargin EBITNetSales13.64%13.91%13.83%13.08%Return onsales NetincomeNetSales11.61%12.34%5.3%First of all, there is an increase in sales from 5.80% in 2015 to 6.10% in 2016 but a decrease in 2017(5.96%). However, the sales growth stays above the industry and competitors, so Nike is performing well.The gross profit margin measures the efficiency and it is expressed as a percentage of sales. It Indicateshow much profit a company makes after paying off its Cost of Goods Sold. It has increased from 2015 to2016 but then decreases from 2016 to 2017. For instance, the company’s gross profit margin in 2017 is abit lower than the industry, so a lower gross profit margin could indicate that the company isunderpricing. The higher the gross profit margin the more efficient a company is so here we can see that itis a bit less efficient than the industry. Moreover, the operating marginmeasures the ability to translate sales into profit after consideration ofoperating expenses. Here we can see a slight increase from 2015 to 2016 but a decrease in 2017 comparedto 2016. It still remains quite stable over the years. In 2017, it stays above the average of the market so itmore profitable than the average industry. In relation to the ROS, there is an important decrease from 12,34% in 2016 to 5,3% in 2017, so we couldsay that the ability to translate sales into profit (after consideration of all expenses and revenues, includinginterest, taxes, and non-operating items) has decrease. We need further examination of the financial healthof the company to understand this decrease.Balance Sheet Ratios :Analysis ofRatioFormula201520162017Industry orcompetitors2017SolvencyDebt toequityTotaldebt(¿<liabilities)Totalshareholders'equity0.750.871.300.2TIEEBITInterestPayments240.6times84.6times82.22timesLongtermdebt tooperating cash¿Debt(LDT)Operatingcash(¿Netincome+depreciation)1.21years1.52years5.6 yearsLiquidityCurrentratio(intimes)CurrentassetsCurrentliabilities3.043.062.463.06QuickratioCash+STinvestments+ARCurrentliabilities2.211.901.670.8NetWorkingCapitalCurrent assets – Current liabilities9667000105870009094000AveragecollectionperiodARSales∗36036.0438.5434.60
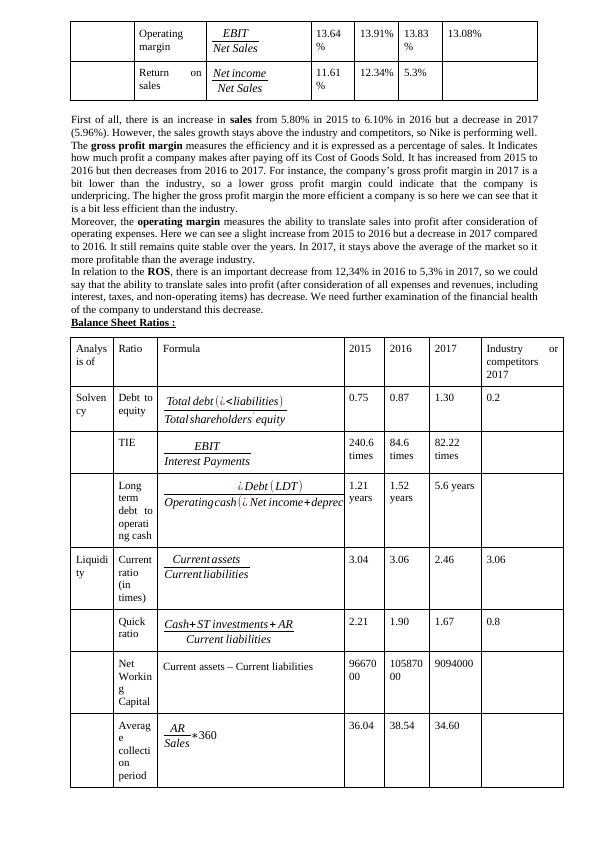
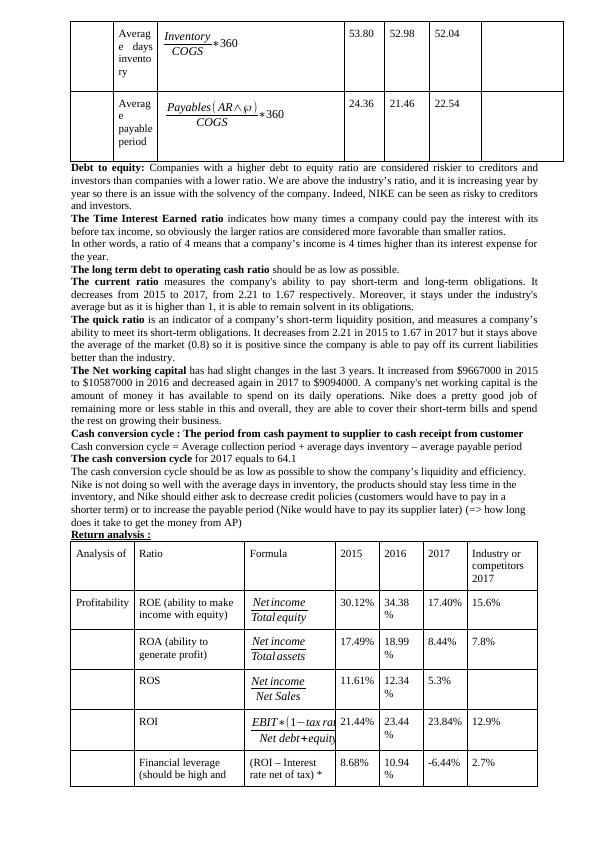
Average daysinventory InventoryCOGS∗36053.8052.9852.04Averagepayableperiod Payables(AR∧℘)COGS∗36024.3621.4622.54Debt to equity:Companies with a higher debt to equity ratio are considered riskier to creditors andinvestors than companies with a lower ratio. We are above the industry’s ratio, and it is increasing year byyear so there is an issue with the solvency of the company. Indeed, NIKE can be seen as risky to creditorsand investors.The Time Interest Earnedratio indicates how many times a company could pay the interest with itsbefore tax income, so obviously the larger ratios are considered more favorable than smaller ratios.In other words, a ratio of 4 means that a company’s income is 4 times higher than its interest expense forthe year.The long term debt to operating cash ratio should be as low as possible.The current ratio measures the company's ability to pay short-term and long-term obligations. Itdecreases from 2015 to 2017, from 2.21 to 1.67 respectively. Moreover, it stays under the industry'saverage but as it is higher than 1, it is able to remain solvent in its obligations.The quick ratio is an indicator of a company’s short-term liquidity position, and measures a company’sability to meet its short-term obligations. It decreases from 2.21 in 2015 to 1.67 in 2017 but it stays abovethe average of the market (0.8) so it is positive since the company is able to pay off its current liabilitiesbetter than the industry.The Net working capital has had slight changes in the last 3 years. It increased from $9667000 in 2015to $10587000 in 2016 and decreased again in 2017 to $9094000. A company's net working capital is theamount of money it has available to spend on its daily operations. Nike does a pretty good job ofremaining more or less stable in this and overall, they are able to cover their short-term bills and spendthe rest on growing their business.Cash conversion cycle : The period from cash payment to supplier to cash receipt from customerCash conversion cycle = Average collection period + average days inventory – average payable period The cash conversion cycle for 2017 equals to 64.1 The cash conversion cycle should be as low as possible to show the company’s liquidity and efficiency. Nike is not doing so well with the average days in inventory, the products should stay less time in the inventory, and Nike should either ask to decrease credit policies (customers would have to pay in a shorter term) or to increase the payable period (Nike would have to pay its supplier later) (=> how long does it take to get the money from AP)Return analysis:Analysis ofRatioFormula201520162017Industry or competitors 2017ProfitabilityROE (ability to make income with equity)NetincomeTotalequity30.12%34.38%17.40%15.6%ROA (ability to generate profit)NetincomeTotalassets17.49%18.99%8.44%7.8%ROSNetincomeNetSales11.61%12.34%5.3%ROIEBIT∗(1−taxrate)Netdebt+equity21.44%23.44%23.84%12.9%Financial leverage(should be high and (ROI – Interest rate net of tax) *8.68%10.94%-6.44%2.7%
End of preview
Want to access all the pages? Upload your documents or become a member.
Related Documents
Financial Statement Analysis of Nike Inc.lg...
|11
|3323
|282
Globalization of Nike Companylg...
|17
|4170
|69
Report on the Company Nikelg...
|14
|2435
|402
Brand Management of Nikelg...
|14
|4220
|487
Nike: Product Design and Quality Managementlg...
|22
|11165
|36
Principles and Practice of Marketing: Marketing Planlg...
|13
|3142
|36