Normal Distribution Study Guide: SAT Scores and Z-Scores Analysis
VerifiedAdded on 2022/08/20
|8
|1282
|20
Homework Assignment
AI Summary
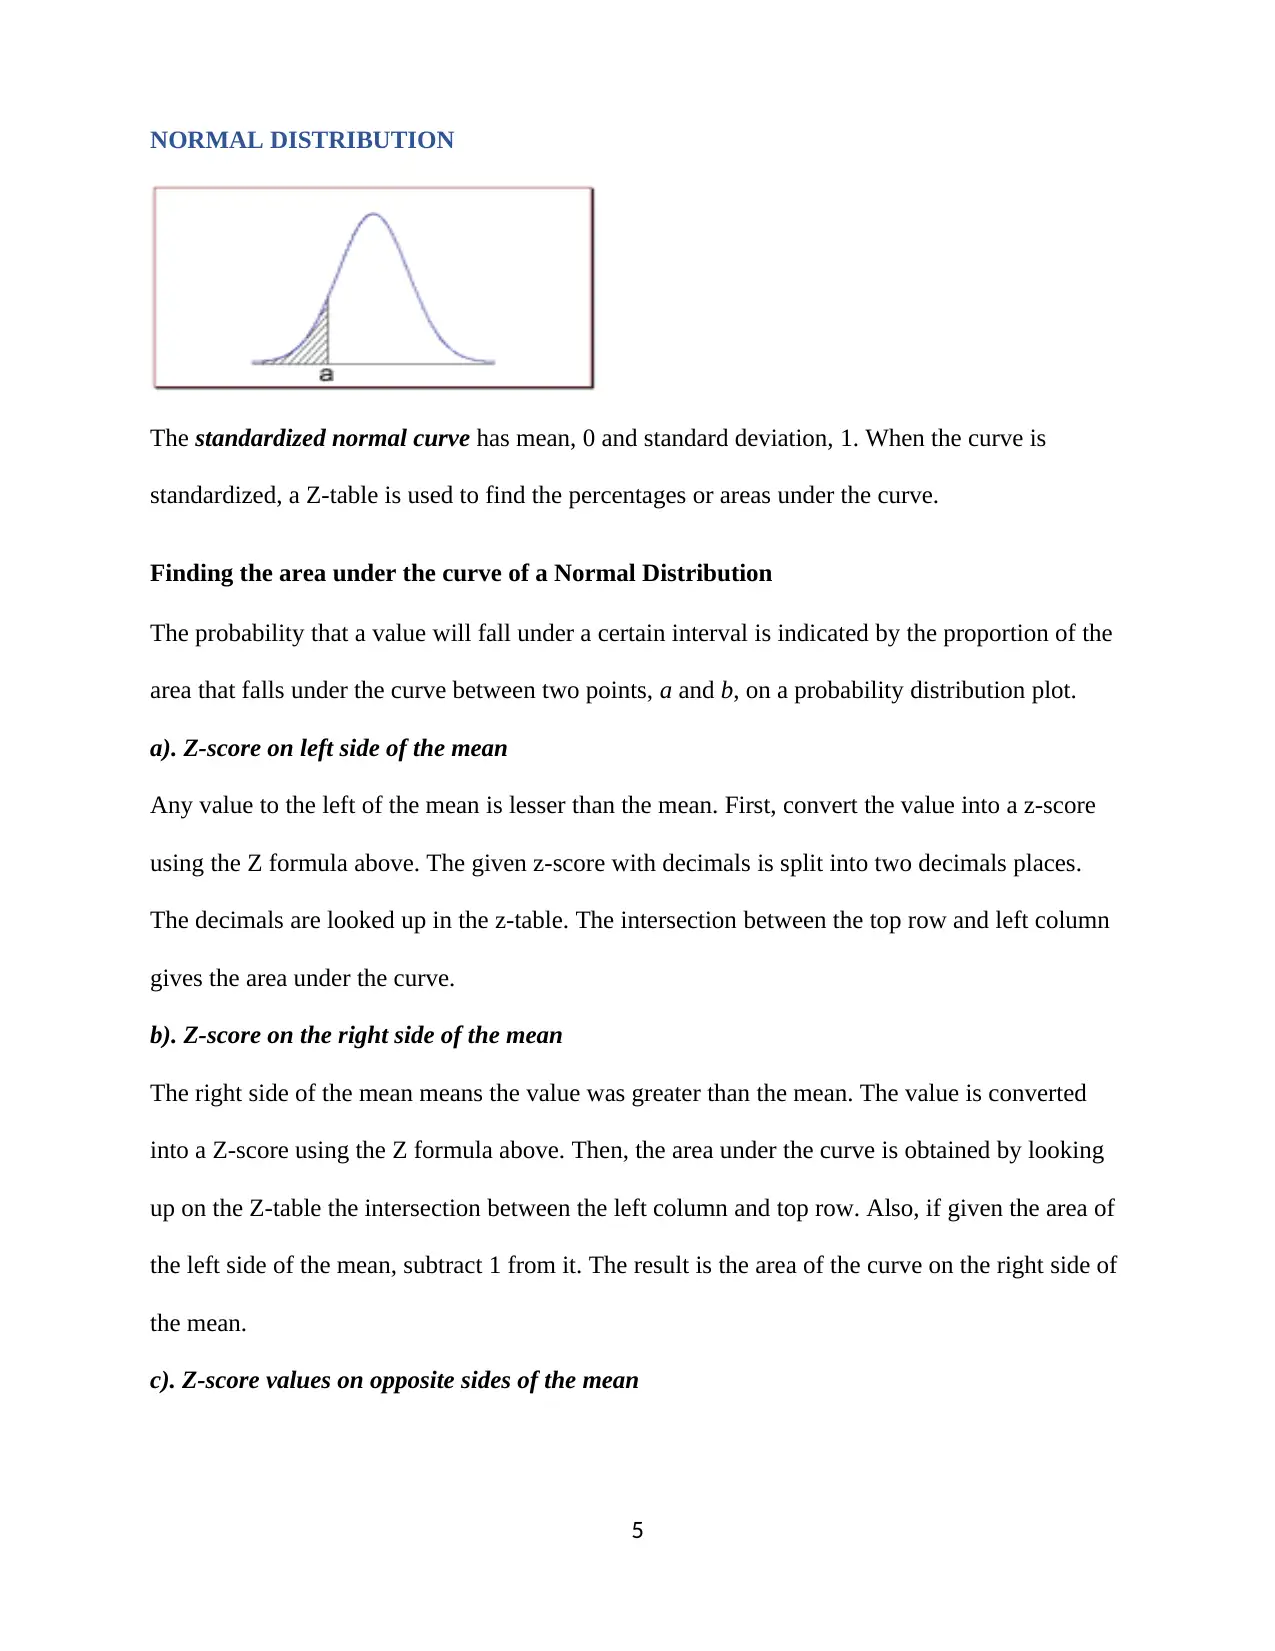
This assignment provides a comprehensive study guide on the normal distribution, tailored for understanding SAT scores and probability. It begins with an overview of the normal distribution, defining key terms such as mean, standard deviation, and z-scores, and explaining the characteristics of a normal distribution, including its symmetrical bell-shaped curve and the empirical rule (68-95-99.7 rule). The guide then details the standard normal curve and how to find areas under the curve using z-scores, covering scenarios where the z-score is to the left, right, or between two z-scores relative to the mean. The assignment includes a practical application using statewide math SAT scores, calculating the probability of a student scoring between 400 and 600, and determining the SAT score corresponding to the 85th percentile, complete with step-by-step solutions and references.
1 out of 8
Related Documents


Your All-in-One AI-Powered Toolkit for Academic Success.
+13062052269
info@desklib.com
Available 24*7 on WhatsApp / Email
![[object Object]](/_next/static/media/star-bottom.7253800d.svg)
Copyright © 2020–2026 A2Z Services. All Rights Reserved. Developed and managed by ZUCOL.