Normalized Difference Vegetation Index
VerifiedAdded on 2022/09/12
|6
|973
|20
AI Summary
Contribute Materials
Your contribution can guide someone’s learning journey. Share your
documents today.
Running head: IMAGE PROCESSING
Image Processing
Name of the Student
Name of the University
Author Note
Image Processing
Name of the Student
Name of the University
Author Note
Secure Best Marks with AI Grader
Need help grading? Try our AI Grader for instant feedback on your assignments.
1IMAGE PROCESSING
The Normalized Difference Vegetation Index (NDVI) is a commonly used vegetation
index in the remote sensing community. What are some other vegetation indexes? What
platform/sensor were they developed for and what is their application?
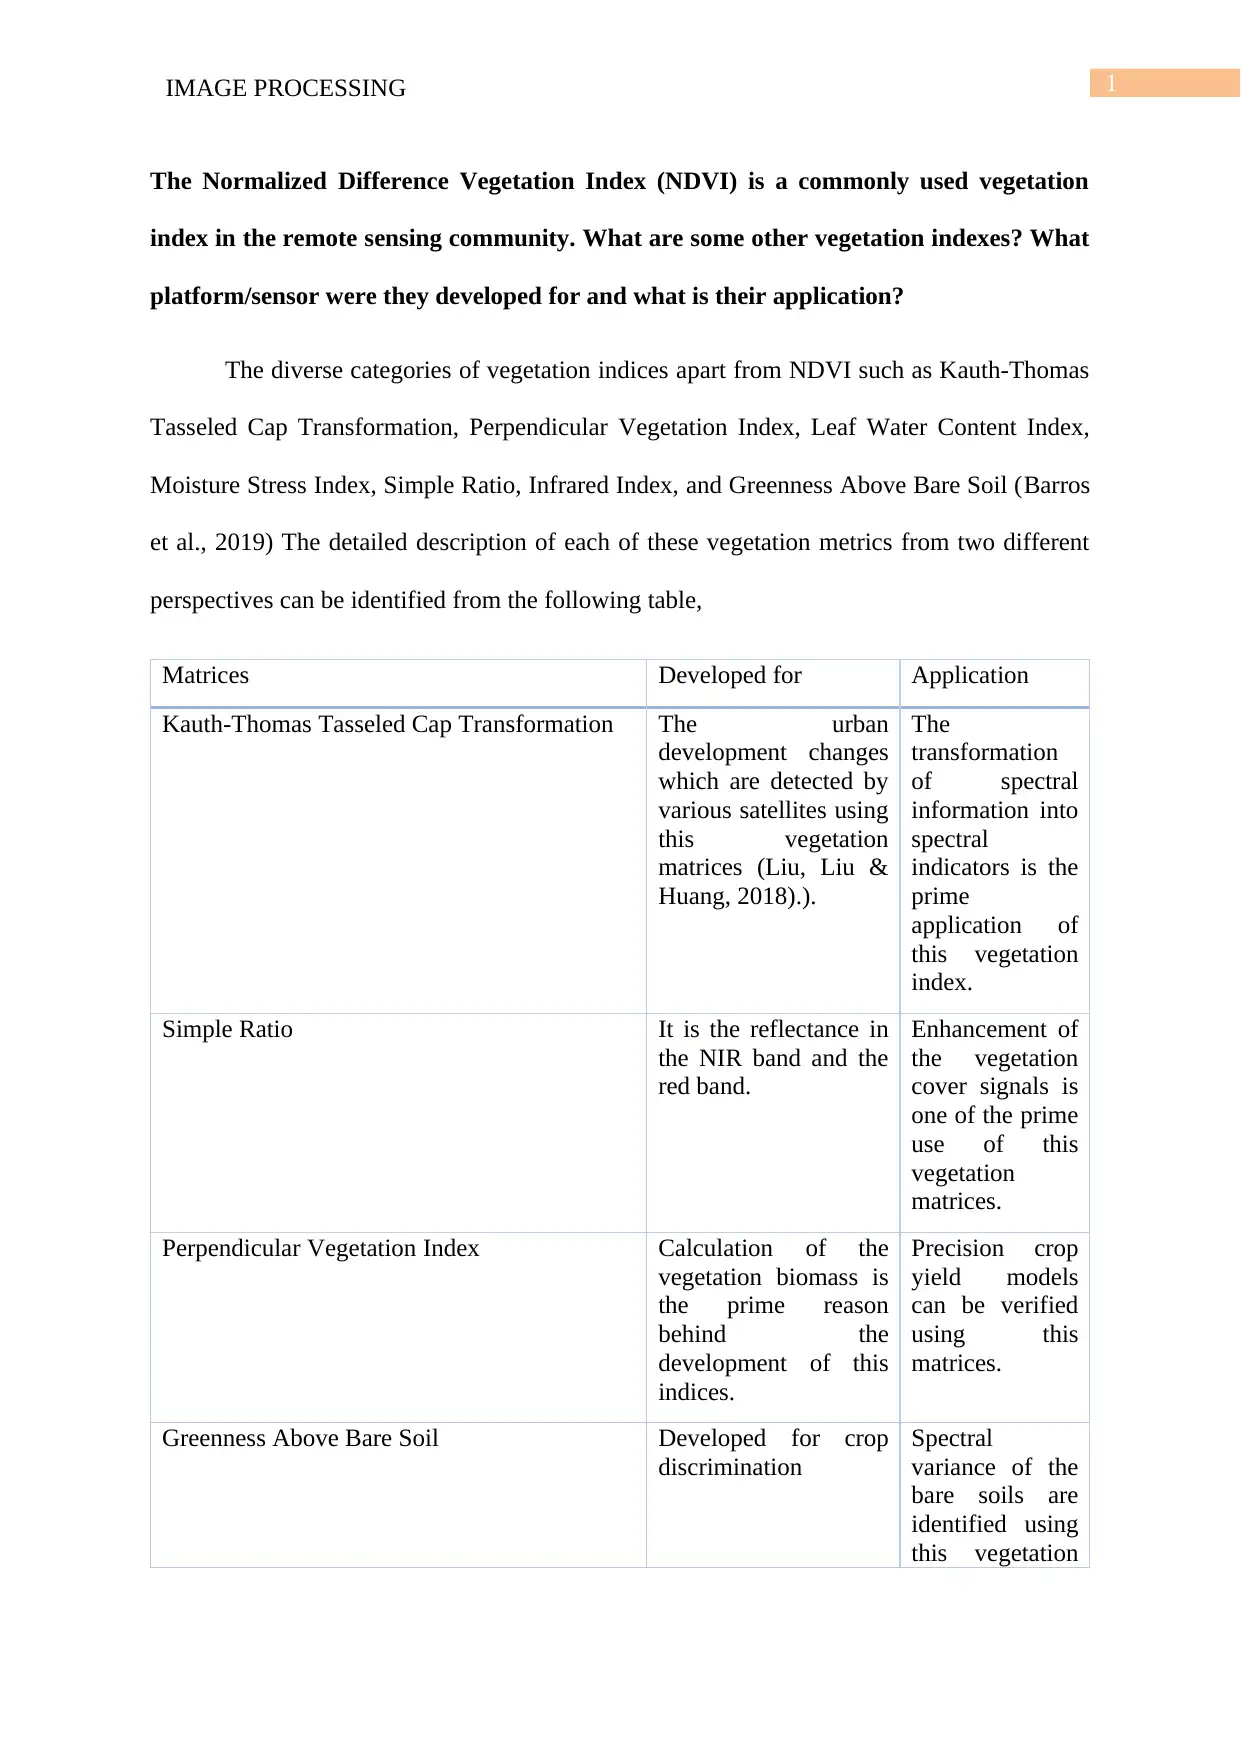
The diverse categories of vegetation indices apart from NDVI such as Kauth-Thomas
Tasseled Cap Transformation, Perpendicular Vegetation Index, Leaf Water Content Index,
Moisture Stress Index, Simple Ratio, Infrared Index, and Greenness Above Bare Soil (Barros
et al., 2019) The detailed description of each of these vegetation metrics from two different
perspectives can be identified from the following table,
Matrices Developed for Application
Kauth-Thomas Tasseled Cap Transformation The urban
development changes
which are detected by
various satellites using
this vegetation
matrices (Liu, Liu &
Huang, 2018).).
The
transformation
of spectral
information into
spectral
indicators is the
prime
application of
this vegetation
index.
Simple Ratio It is the reflectance in
the NIR band and the
red band.
Enhancement of
the vegetation
cover signals is
one of the prime
use of this
vegetation
matrices.
Perpendicular Vegetation Index Calculation of the
vegetation biomass is
the prime reason
behind the
development of this
indices.
Precision crop
yield models
can be verified
using this
matrices.
Greenness Above Bare Soil Developed for crop
discrimination
Spectral
variance of the
bare soils are
identified using
this vegetation
The Normalized Difference Vegetation Index (NDVI) is a commonly used vegetation
index in the remote sensing community. What are some other vegetation indexes? What
platform/sensor were they developed for and what is their application?
The diverse categories of vegetation indices apart from NDVI such as Kauth-Thomas
Tasseled Cap Transformation, Perpendicular Vegetation Index, Leaf Water Content Index,
Moisture Stress Index, Simple Ratio, Infrared Index, and Greenness Above Bare Soil (Barros
et al., 2019) The detailed description of each of these vegetation metrics from two different
perspectives can be identified from the following table,
Matrices Developed for Application
Kauth-Thomas Tasseled Cap Transformation The urban
development changes
which are detected by
various satellites using
this vegetation
matrices (Liu, Liu &
Huang, 2018).).
The
transformation
of spectral
information into
spectral
indicators is the
prime
application of
this vegetation
index.
Simple Ratio It is the reflectance in
the NIR band and the
red band.
Enhancement of
the vegetation
cover signals is
one of the prime
use of this
vegetation
matrices.
Perpendicular Vegetation Index Calculation of the
vegetation biomass is
the prime reason
behind the
development of this
indices.
Precision crop
yield models
can be verified
using this
matrices.
Greenness Above Bare Soil Developed for crop
discrimination
Spectral
variance of the
bare soils are
identified using
this vegetation
2IMAGE PROCESSING
matrices
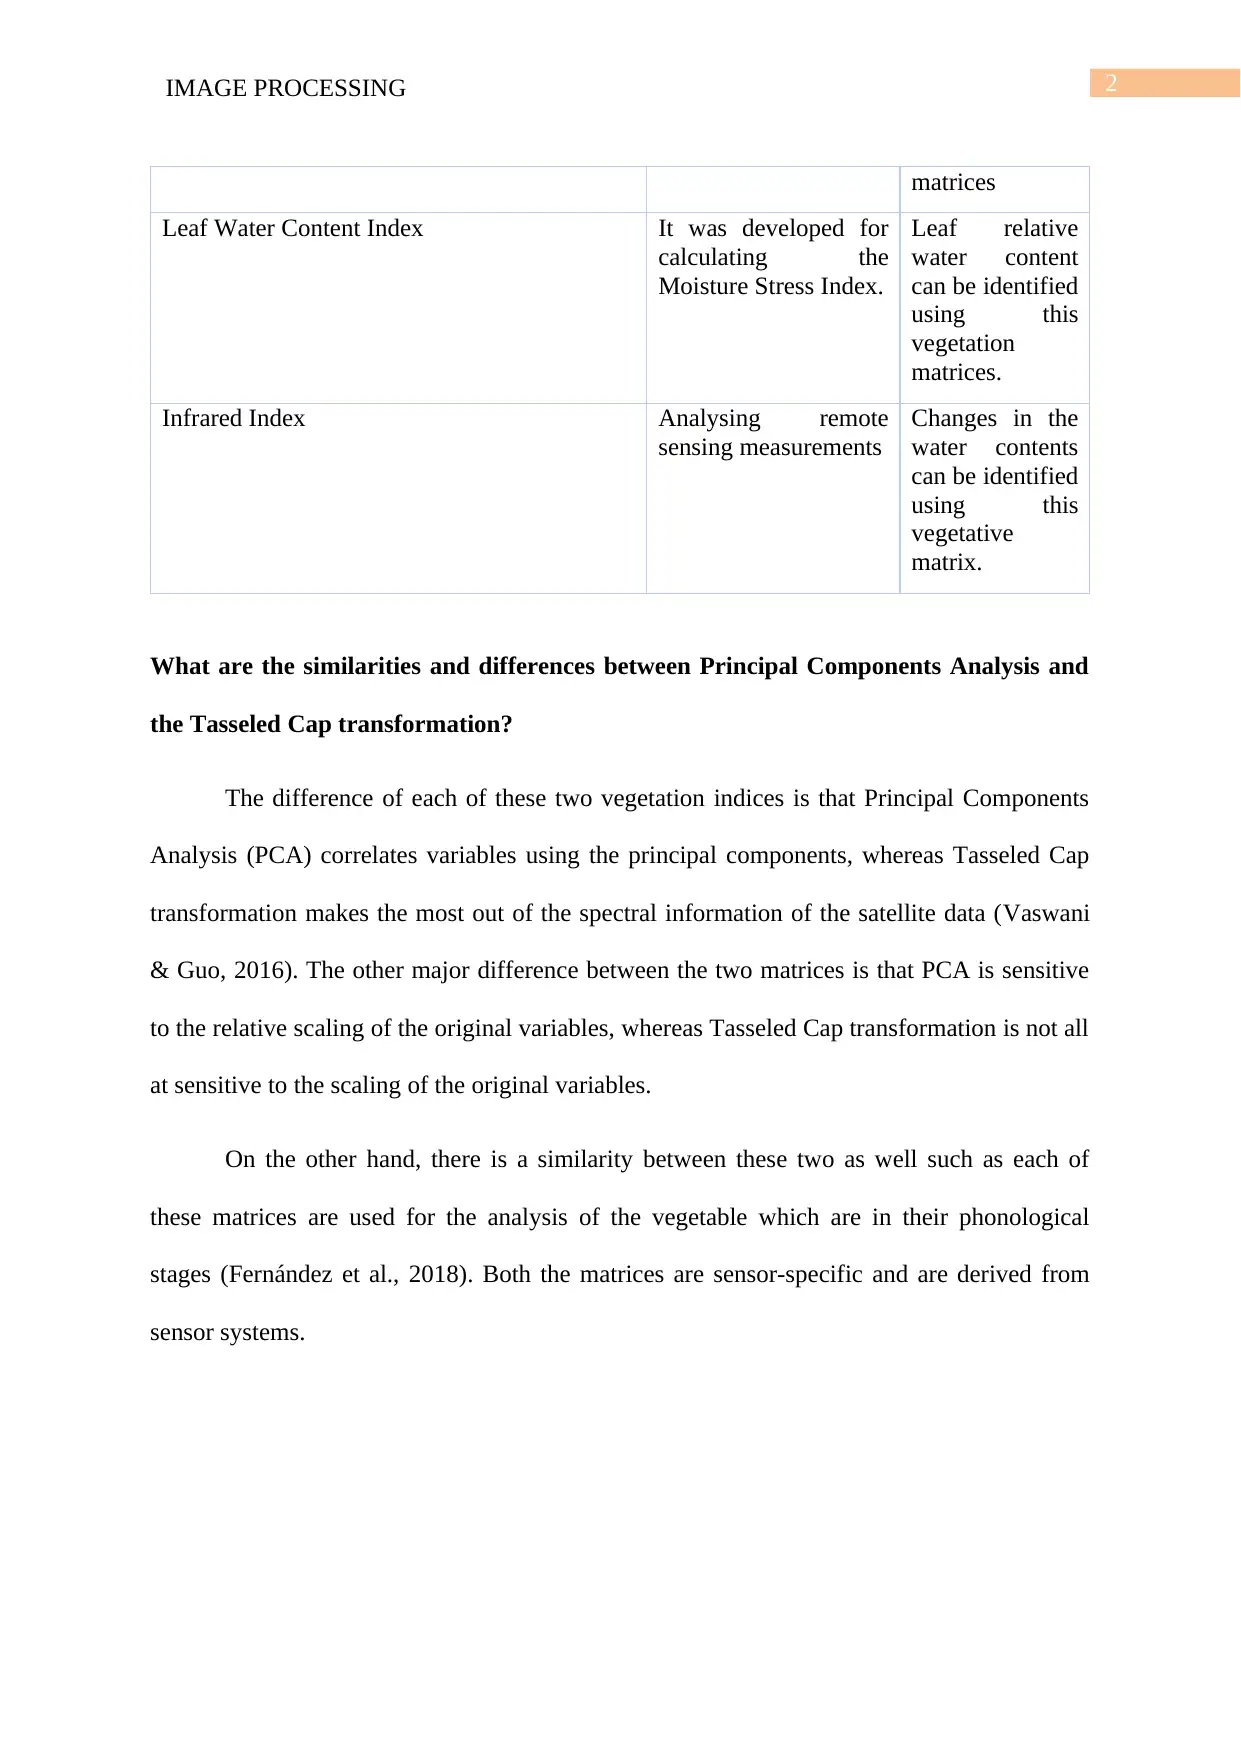
Leaf Water Content Index It was developed for
calculating the
Moisture Stress Index.
Leaf relative
water content
can be identified
using this
vegetation
matrices.
Infrared Index Analysing remote
sensing measurements
Changes in the
water contents
can be identified
using this
vegetative
matrix.
What are the similarities and differences between Principal Components Analysis and
the Tasseled Cap transformation?
The difference of each of these two vegetation indices is that Principal Components
Analysis (PCA) correlates variables using the principal components, whereas Tasseled Cap
transformation makes the most out of the spectral information of the satellite data (Vaswani
& Guo, 2016). The other major difference between the two matrices is that PCA is sensitive
to the relative scaling of the original variables, whereas Tasseled Cap transformation is not all
at sensitive to the scaling of the original variables.
On the other hand, there is a similarity between these two as well such as each of
these matrices are used for the analysis of the vegetable which are in their phonological
stages (Fernández et al., 2018). Both the matrices are sensor-specific and are derived from
sensor systems.
matrices
Leaf Water Content Index It was developed for
calculating the
Moisture Stress Index.
Leaf relative
water content
can be identified
using this
vegetation
matrices.
Infrared Index Analysing remote
sensing measurements
Changes in the
water contents
can be identified
using this
vegetative
matrix.
What are the similarities and differences between Principal Components Analysis and
the Tasseled Cap transformation?
The difference of each of these two vegetation indices is that Principal Components
Analysis (PCA) correlates variables using the principal components, whereas Tasseled Cap
transformation makes the most out of the spectral information of the satellite data (Vaswani
& Guo, 2016). The other major difference between the two matrices is that PCA is sensitive
to the relative scaling of the original variables, whereas Tasseled Cap transformation is not all
at sensitive to the scaling of the original variables.
On the other hand, there is a similarity between these two as well such as each of
these matrices are used for the analysis of the vegetable which are in their phonological
stages (Fernández et al., 2018). Both the matrices are sensor-specific and are derived from
sensor systems.
3IMAGE PROCESSING
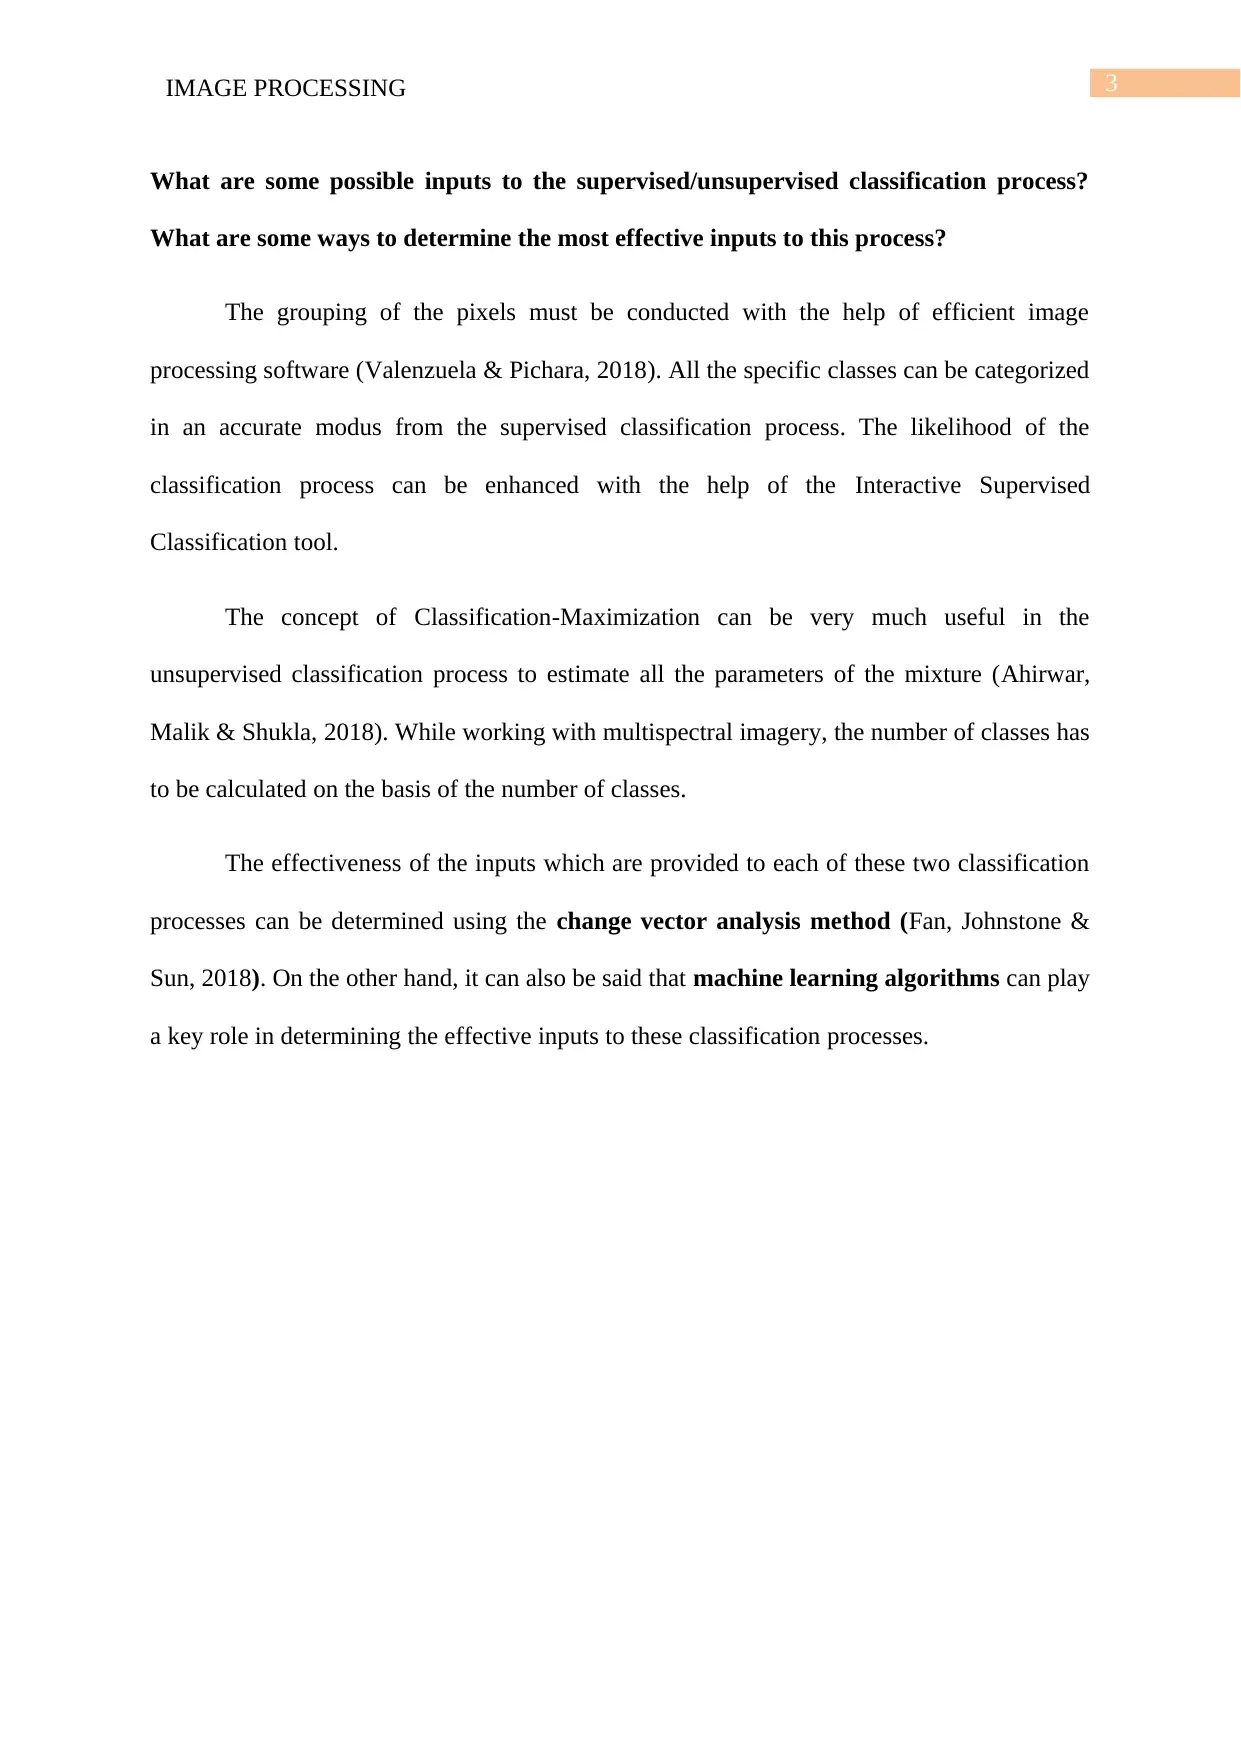
What are some possible inputs to the supervised/unsupervised classification process?
What are some ways to determine the most effective inputs to this process?
The grouping of the pixels must be conducted with the help of efficient image
processing software (Valenzuela & Pichara, 2018). All the specific classes can be categorized
in an accurate modus from the supervised classification process. The likelihood of the
classification process can be enhanced with the help of the Interactive Supervised
Classification tool.
The concept of Classification-Maximization can be very much useful in the
unsupervised classification process to estimate all the parameters of the mixture (Ahirwar,
Malik & Shukla, 2018). While working with multispectral imagery, the number of classes has
to be calculated on the basis of the number of classes.
The effectiveness of the inputs which are provided to each of these two classification
processes can be determined using the change vector analysis method (Fan, Johnstone &
Sun, 2018). On the other hand, it can also be said that machine learning algorithms can play
a key role in determining the effective inputs to these classification processes.
Secure Best Marks with AI Grader
Need help grading? Try our AI Grader for instant feedback on your assignments.
4IMAGE PROCESSING
Reference
Ahirwar, R., Malik, M. S., & Shukla, J. P. (2018). Development of Hybrid Unsupervised
Classification Techniques for Accuracy enhancement of Land Use/Land Cover
Mapping Using Geo-spatial Technology: Hoshangabad, District Madhya Pradesh
India. Geoinfor Geostat: An Overview 6: 3. of, 7, 2.
Barros, J. M., Buitelaar, P., Duggan, J., & Rebholz-Schuhmann, D. (2019, November).
Unsupervised Classification of Health Content on Reddit. In Proceedings of the 9th
International Conference on Digital Public Health (pp. 85-89).
Fan, Z., Johnstone, I. M., & Sun, Y. (2018). Spiked covariances and principal components
analysis in high-dimensional random effects models. arXiv preprint
arXiv:1806.09529.
Fernández, S., Cotos-Yáñez, T., Roca-Pardiñas, J., & Ordóñez, C. (2018). Geographically
weighted principal components analysis to assess diffuse pollution sources of soil
heavy metal: application to rough mountain areas in Northwest Spain. Geoderma,
311, 120-129.
Liu, Q., Liu, G., & Huang, C. (2018). Monitoring desertification processes in Mongolian
Plateau using MODIS tasseled cap transformation and TGSI time series. Journal of
arid land, 10(1), 12-26.
Valenzuela, L., & Pichara, K. (2018). Unsupervised classification of variable stars. Monthly
Notices of the Royal Astronomical Society, 474(3), 3259-3272.
Vaswani, N., & Guo, H. (2016). Correlated-PCA: principal components' analysis when data
and noise are correlated. In Advances in Neural Information Processing Systems (pp.
1768-1776).
5IMAGE PROCESSING
1 out of 6
Your All-in-One AI-Powered Toolkit for Academic Success.
+13062052269
info@desklib.com
Available 24*7 on WhatsApp / Email
![[object Object]](/_next/static/media/star-bottom.7253800d.svg)
Unlock your academic potential
© 2024 | Zucol Services PVT LTD | All rights reserved.