Desklib - Online Library for Study Material
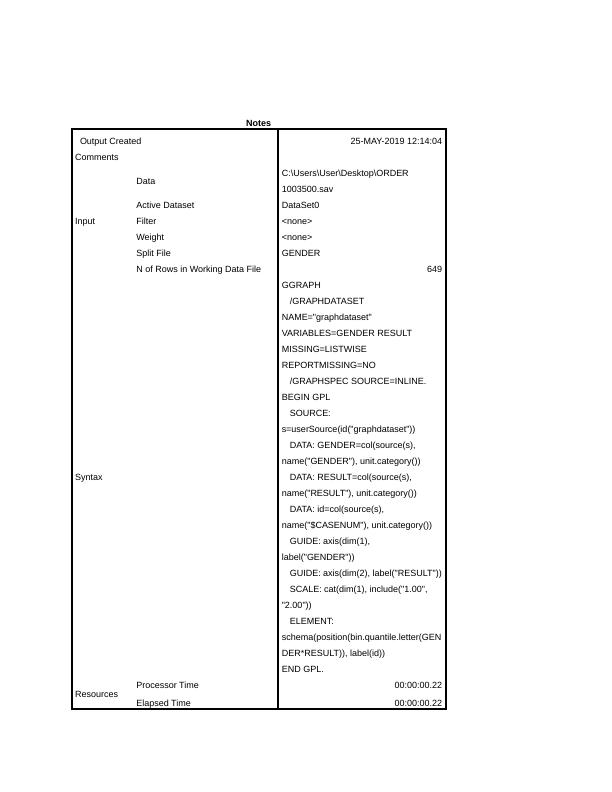
A researcher is interested in the factors that may explain the academic achievement of first year Business students. With the university’s support, the researcher developed a standardised test that was to be undertaken by a random sample of students. The test contained questions related to the core business units of accountancy, marketing, management and statistics, and was administered towards the end of the each students first year of study. In addition to answering the test, the students were asked questions on their gender, age, mother’s highest level of education, whether the student was currently in a ‘romantic’ relationship. Students were also asked to report the number of instances where they did not attend either a lecture or a tutorial. In total, 649 students sat the test and a portion of the dataset1,2 is presented below:
Added on 2023-03-31
About This Document
Desklib - Online Library for Study Material
A researcher is interested in the factors that may explain the academic achievement of first year Business students. With the university’s support, the researcher developed a standardised test that was to be undertaken by a random sample of students. The test contained questions related to the core business units of accountancy, marketing, management and statistics, and was administered towards the end of the each students first year of study. In addition to answering the test, the students were asked questions on their gender, age, mother’s highest level of education, whether the student was currently in a ‘romantic’ relationship. Students were also asked to report the number of instances where they did not attend either a lecture or a tutorial. In total, 649 students sat the test and a portion of the dataset1,2 is presented below:
Added on 2023-03-31
End of preview
Want to access all the pages? Upload your documents or become a member.