Introduction to Biostatistics 401077: Assignment 1, Autumn 2020
VerifiedAdded on 2022/09/07
|6
|892
|17
Homework Assignment
AI Summary
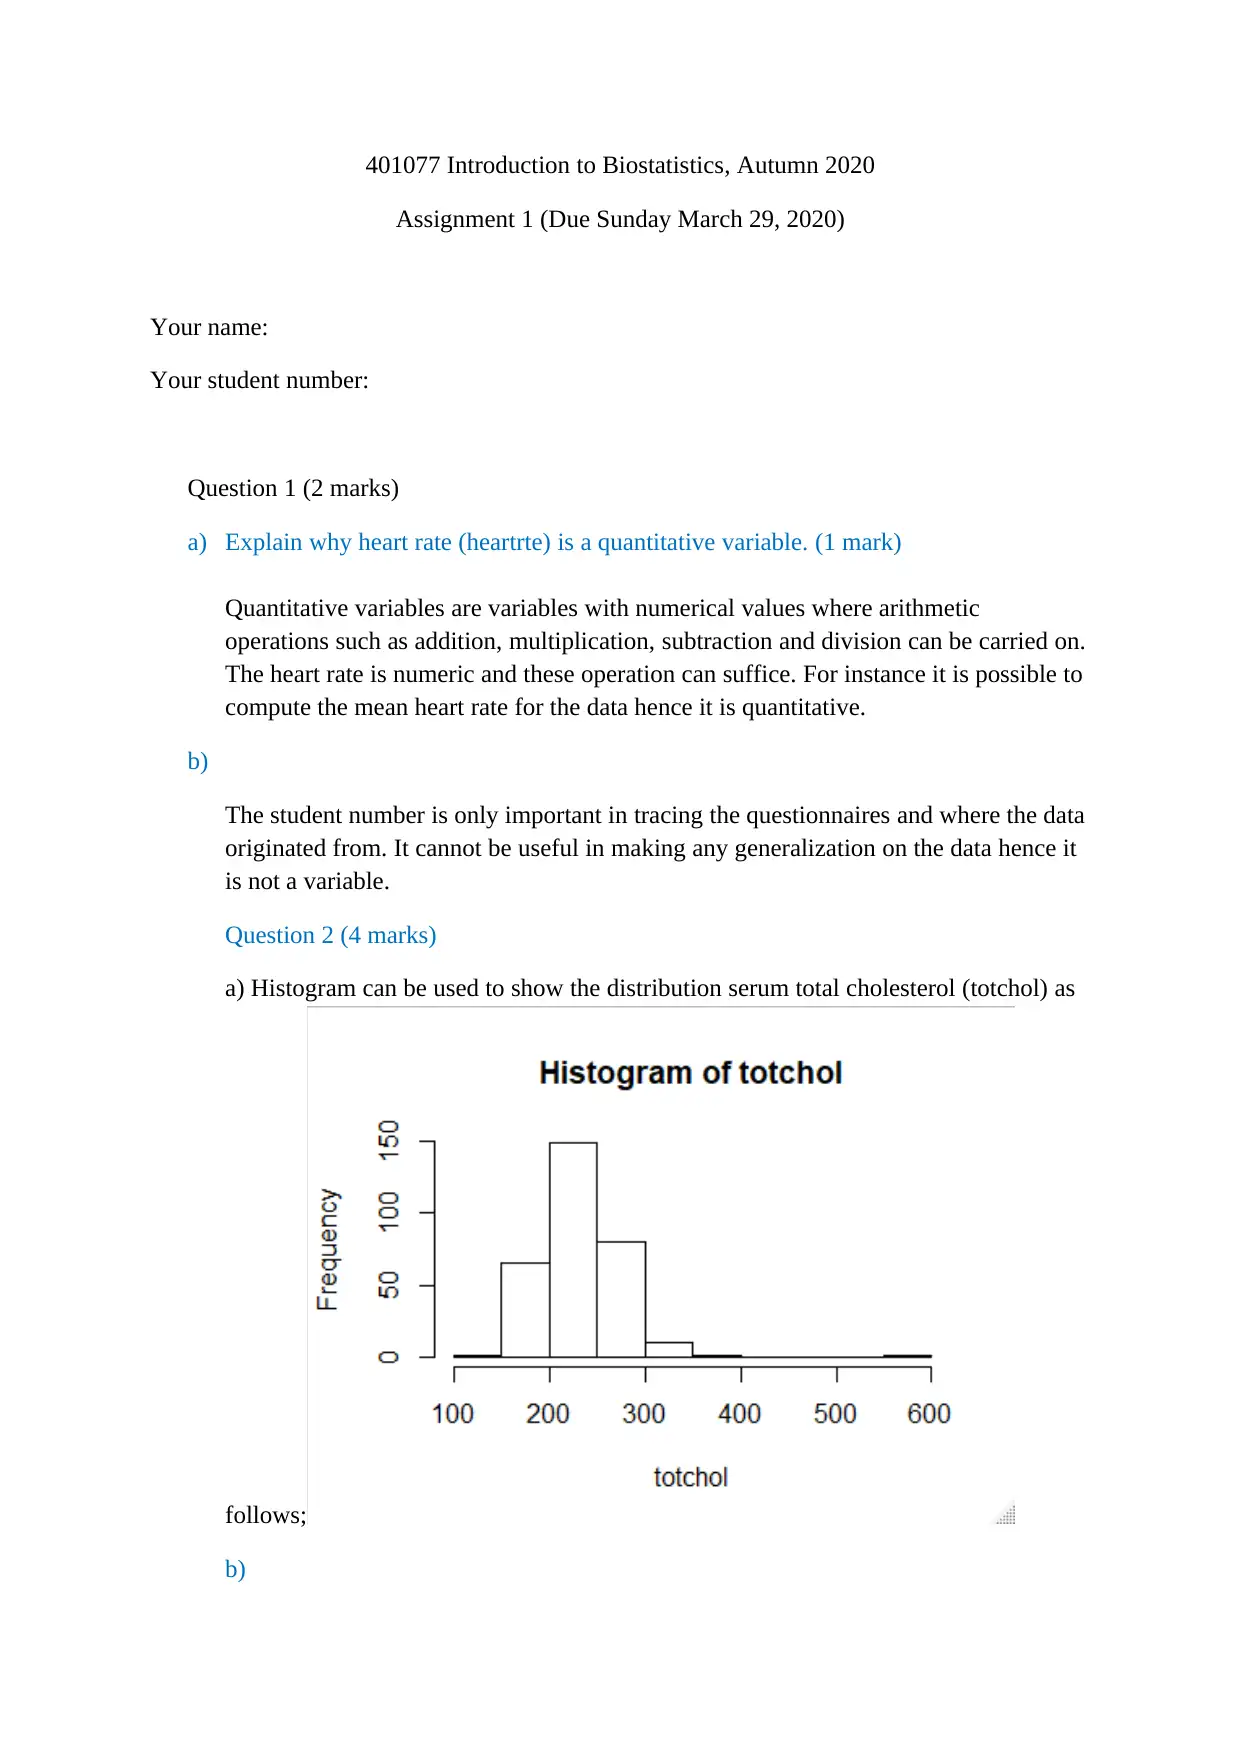
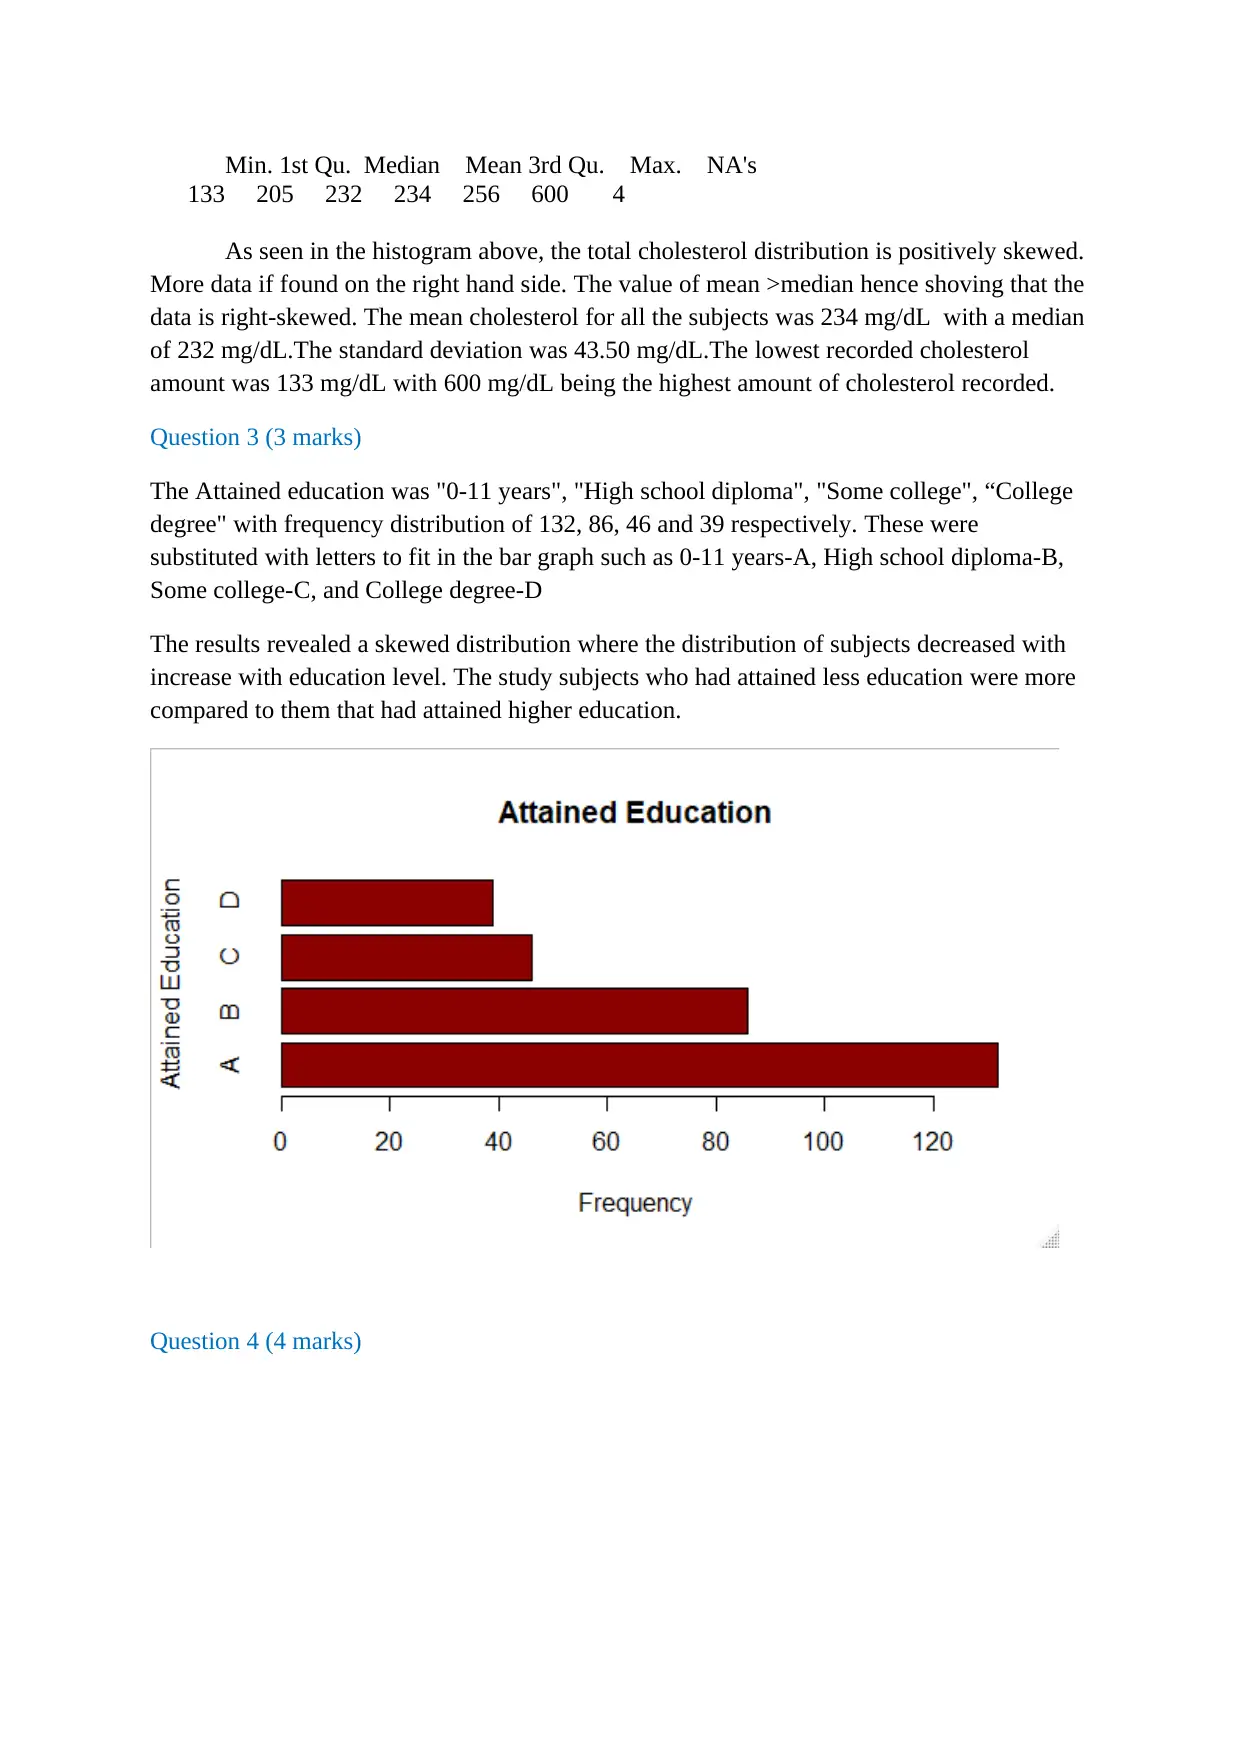
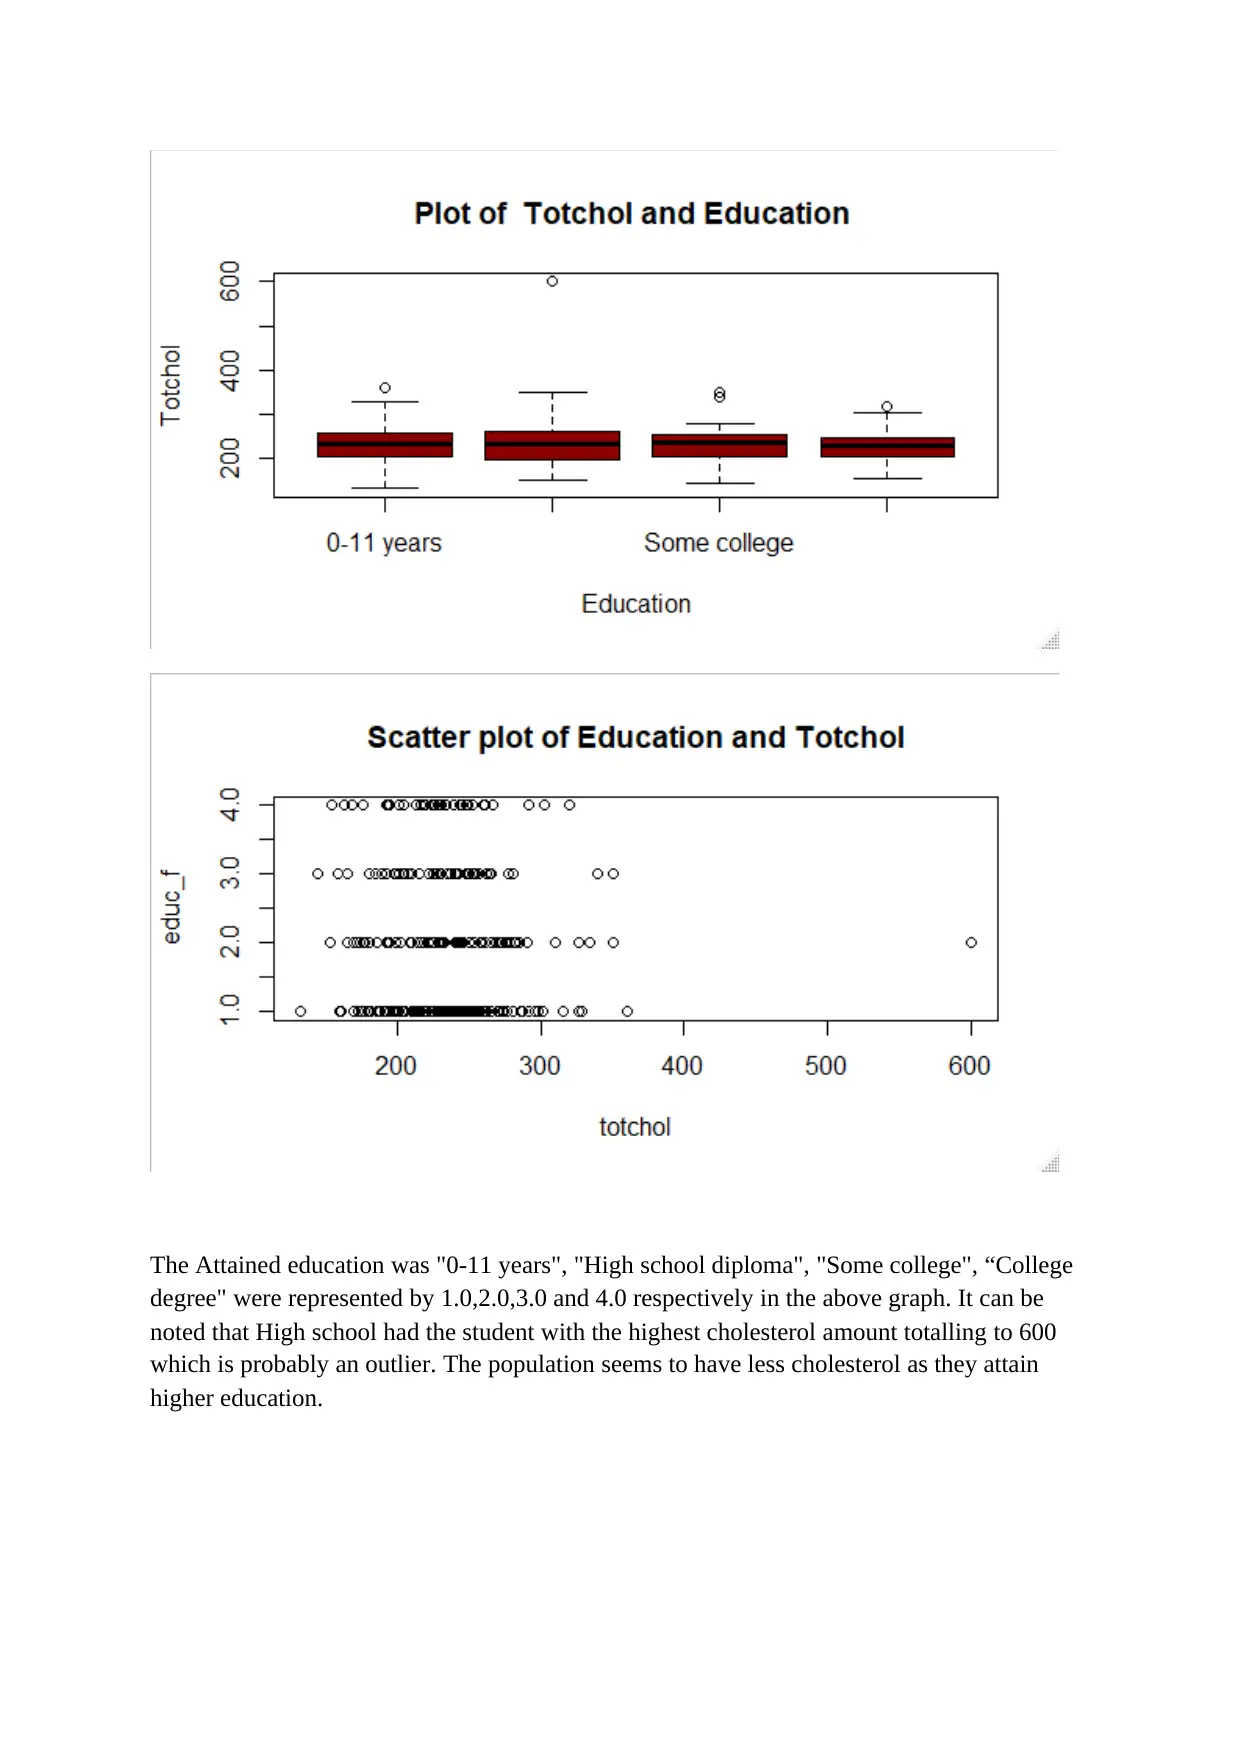
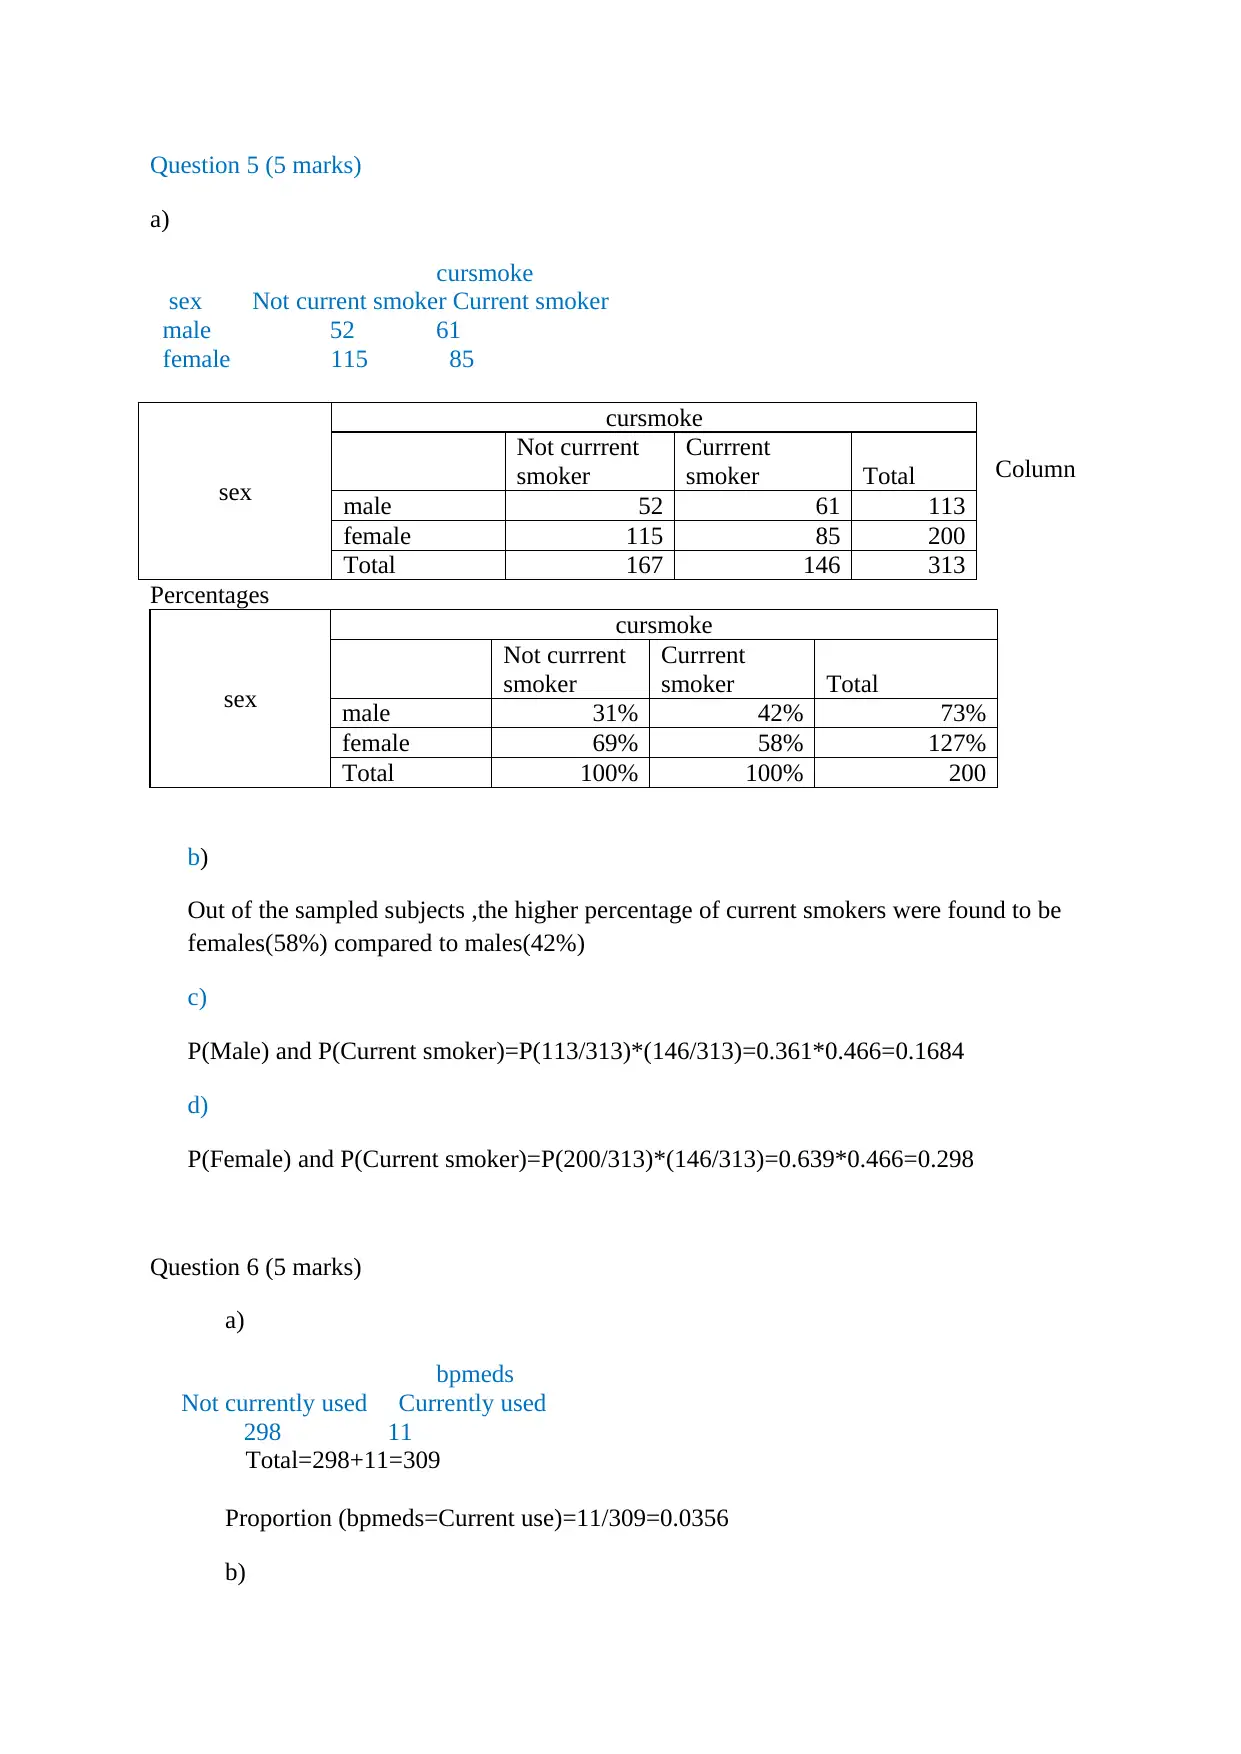
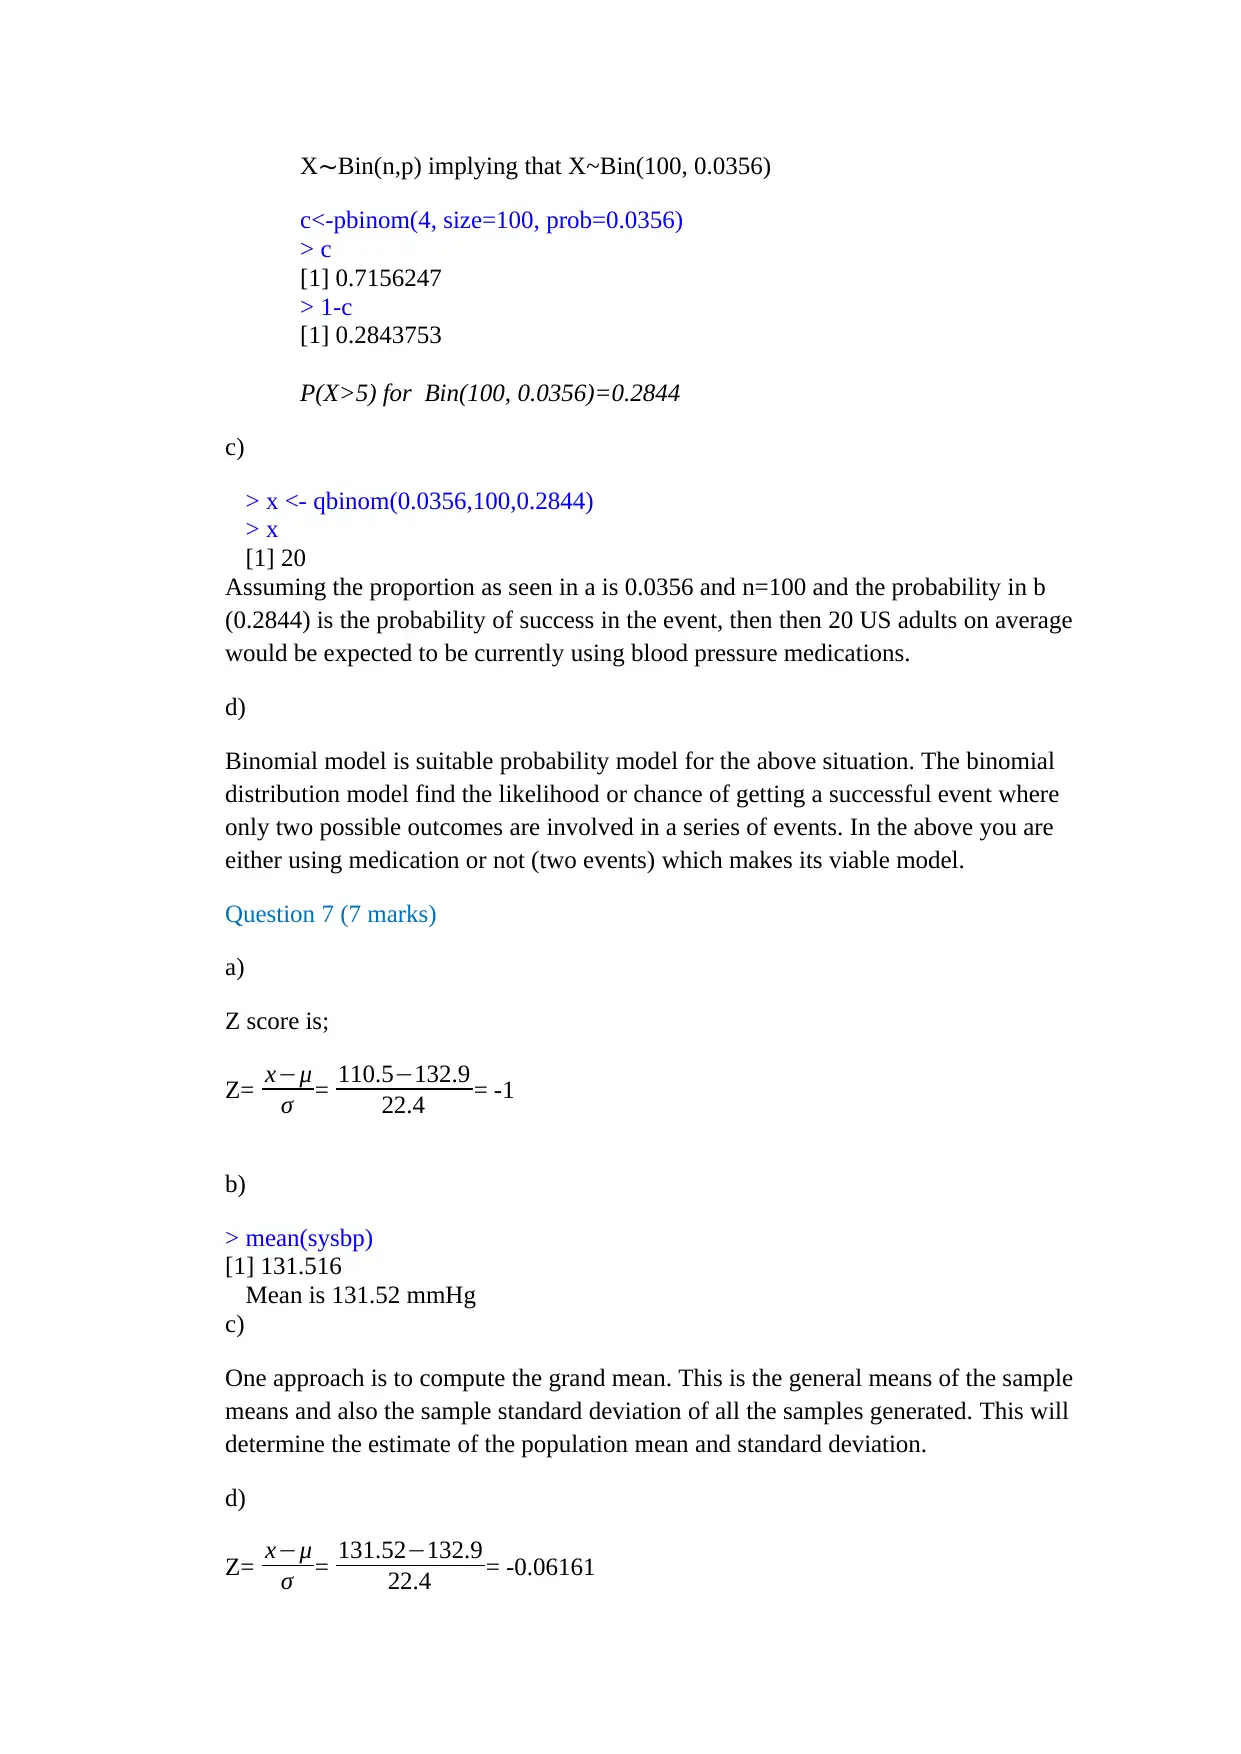
This document presents a comprehensive solution to a biostatistics assignment. The assignment analyzes a dataset from the Framingham Study, exploring quantitative variables like heart rate and serum cholesterol, and explaining why student numbers are not variables. It includes the creation of his...

401077 Introduction to Biostatistics, Autumn 2020
Assignment 1 (Due Sunday March 29, 2020)
Your name:
Your student number:
Question 1 (2 marks)
a) Explain why heart rate (heartrte) is a quantitative variable. (1 mark)
Quantitative variables are variables with numerical values where arithmetic
operations such as addition, multiplication, subtraction and division can be carried on.
The heart rate is numeric and these operation can suffice. For instance it is possible to
compute the mean heart rate for the data hence it is quantitative.
b)
The student number is only important in tracing the questionnaires and where the data
originated from. It cannot be useful in making any generalization on the data hence it
is not a variable.
Question 2 (4 marks)
a) Histogram can be used to show the distribution serum total cholesterol (totchol) as
follows;
b)
Paraphrase This Document
Need a fresh take? Get an instant paraphrase of this document with our AI Paraphraser

Min. 1st Qu. Median Mean 3rd Qu. Max. NA's
133 205 232 234 256 600 4
As seen in the histogram above, the total cholesterol distribution is positively skewed.
More data if found on the right hand side. The value of mean >median hence shoving that the
data is right-skewed. The mean cholesterol for all the subjects was 234 mg/dL with a median
of 232 mg/dL.The standard deviation was 43.50 mg/dL.The lowest recorded cholesterol
amount was 133 mg/dL with 600 mg/dL being the highest amount of cholesterol recorded.
Question 3 (3 marks)
The Attained education was "0-11 years", "High school diploma", "Some college", “College
degree" with frequency distribution of 132, 86, 46 and 39 respectively. These were
substituted with letters to fit in the bar graph such as 0-11 years-A, High school diploma-B,
Some college-C, and College degree-D
The results revealed a skewed distribution where the distribution of subjects decreased with
increase with education level. The study subjects who had attained less education were more
compared to them that had attained higher education.
Question 4 (4 marks)

The Attained education was "0-11 years", "High school diploma", "Some college", “College
degree" were represented by 1.0,2.0,3.0 and 4.0 respectively in the above graph. It can be
noted that High school had the student with the highest cholesterol amount totalling to 600
which is probably an outlier. The population seems to have less cholesterol as they attain
higher education.
degree" were represented by 1.0,2.0,3.0 and 4.0 respectively in the above graph. It can be
noted that High school had the student with the highest cholesterol amount totalling to 600
which is probably an outlier. The population seems to have less cholesterol as they attain
higher education.
⊘ This is a preview!⊘
Do you want full access?
Subscribe today to unlock all pages.

Trusted by 1+ million students worldwide

Question 5 (5 marks)
a)
cursmoke
sex Not current smoker Current smoker
male 52 61
female 115 85
Column
Percentages
sex
cursmoke
Not currrent
smoker
Currrent
smoker Total
male 31% 42% 73%
female 69% 58% 127%
Total 100% 100% 200
b)
Out of the sampled subjects ,the higher percentage of current smokers were found to be
females(58%) compared to males(42%)
c)
P(Male) and P(Current smoker)=P(113/313)*(146/313)=0.361*0.466=0.1684
d)
P(Female) and P(Current smoker)=P(200/313)*(146/313)=0.639*0.466=0.298
Question 6 (5 marks)
a)
bpmeds
Not currently used Currently used
298 11
Total=298+11=309
Proportion (bpmeds=Current use)=11/309=0.0356
b)
sex
cursmoke
Not currrent
smoker
Currrent
smoker Total
male 52 61 113
female 115 85 200
Total 167 146 313
a)
cursmoke
sex Not current smoker Current smoker
male 52 61
female 115 85
Column
Percentages
sex
cursmoke
Not currrent
smoker
Currrent
smoker Total
male 31% 42% 73%
female 69% 58% 127%
Total 100% 100% 200
b)
Out of the sampled subjects ,the higher percentage of current smokers were found to be
females(58%) compared to males(42%)
c)
P(Male) and P(Current smoker)=P(113/313)*(146/313)=0.361*0.466=0.1684
d)
P(Female) and P(Current smoker)=P(200/313)*(146/313)=0.639*0.466=0.298
Question 6 (5 marks)
a)
bpmeds
Not currently used Currently used
298 11
Total=298+11=309
Proportion (bpmeds=Current use)=11/309=0.0356
b)
sex
cursmoke
Not currrent
smoker
Currrent
smoker Total
male 52 61 113
female 115 85 200
Total 167 146 313
Paraphrase This Document
Need a fresh take? Get an instant paraphrase of this document with our AI Paraphraser

X∼Bin(n,p) implying that X~Bin(100, 0.0356)
c<-pbinom(4, size=100, prob=0.0356)
> c
[1] 0.7156247
> 1-c
[1] 0.2843753
P(X>5) for Bin(100, 0.0356)=0.2844
c)
> x <- qbinom(0.0356,100,0.2844)
> x
[1] 20
Assuming the proportion as seen in a is 0.0356 and n=100 and the probability in b
(0.2844) is the probability of success in the event, then then 20 US adults on average
would be expected to be currently using blood pressure medications.
d)
Binomial model is suitable probability model for the above situation. The binomial
distribution model find the likelihood or chance of getting a successful event where
only two possible outcomes are involved in a series of events. In the above you are
either using medication or not (two events) which makes its viable model.
Question 7 (7 marks)
a)
Z score is;
Z= x−μ
σ = 110.5−132.9
22.4 = -1
b)
> mean(sysbp)
[1] 131.516
Mean is 131.52 mmHg
c)
One approach is to compute the grand mean. This is the general means of the sample
means and also the sample standard deviation of all the samples generated. This will
determine the estimate of the population mean and standard deviation.
d)
Z= x−μ
σ = 131.52−132.9
22.4 = -0.06161

e)
> mean(sysbp<132.52)
[1] 0.5878594
=184/313=0.5878 i.e 58.79%
> mean(sysbp<132.52)
[1] 0.5878594
=184/313=0.5878 i.e 58.79%
⊘ This is a preview!⊘
Do you want full access?
Subscribe today to unlock all pages.

Trusted by 1+ million students worldwide
1 out of 6

Your All-in-One AI-Powered Toolkit for Academic Success.
+13062052269
info@desklib.com
Available 24*7 on WhatsApp / Email
Unlock your academic potential
© 2024 | Zucol Services PVT LTD | All rights reserved.