Numeracy and Data Analysis
VerifiedAdded on 2022/11/24
|11
|1408
|462
AI Summary
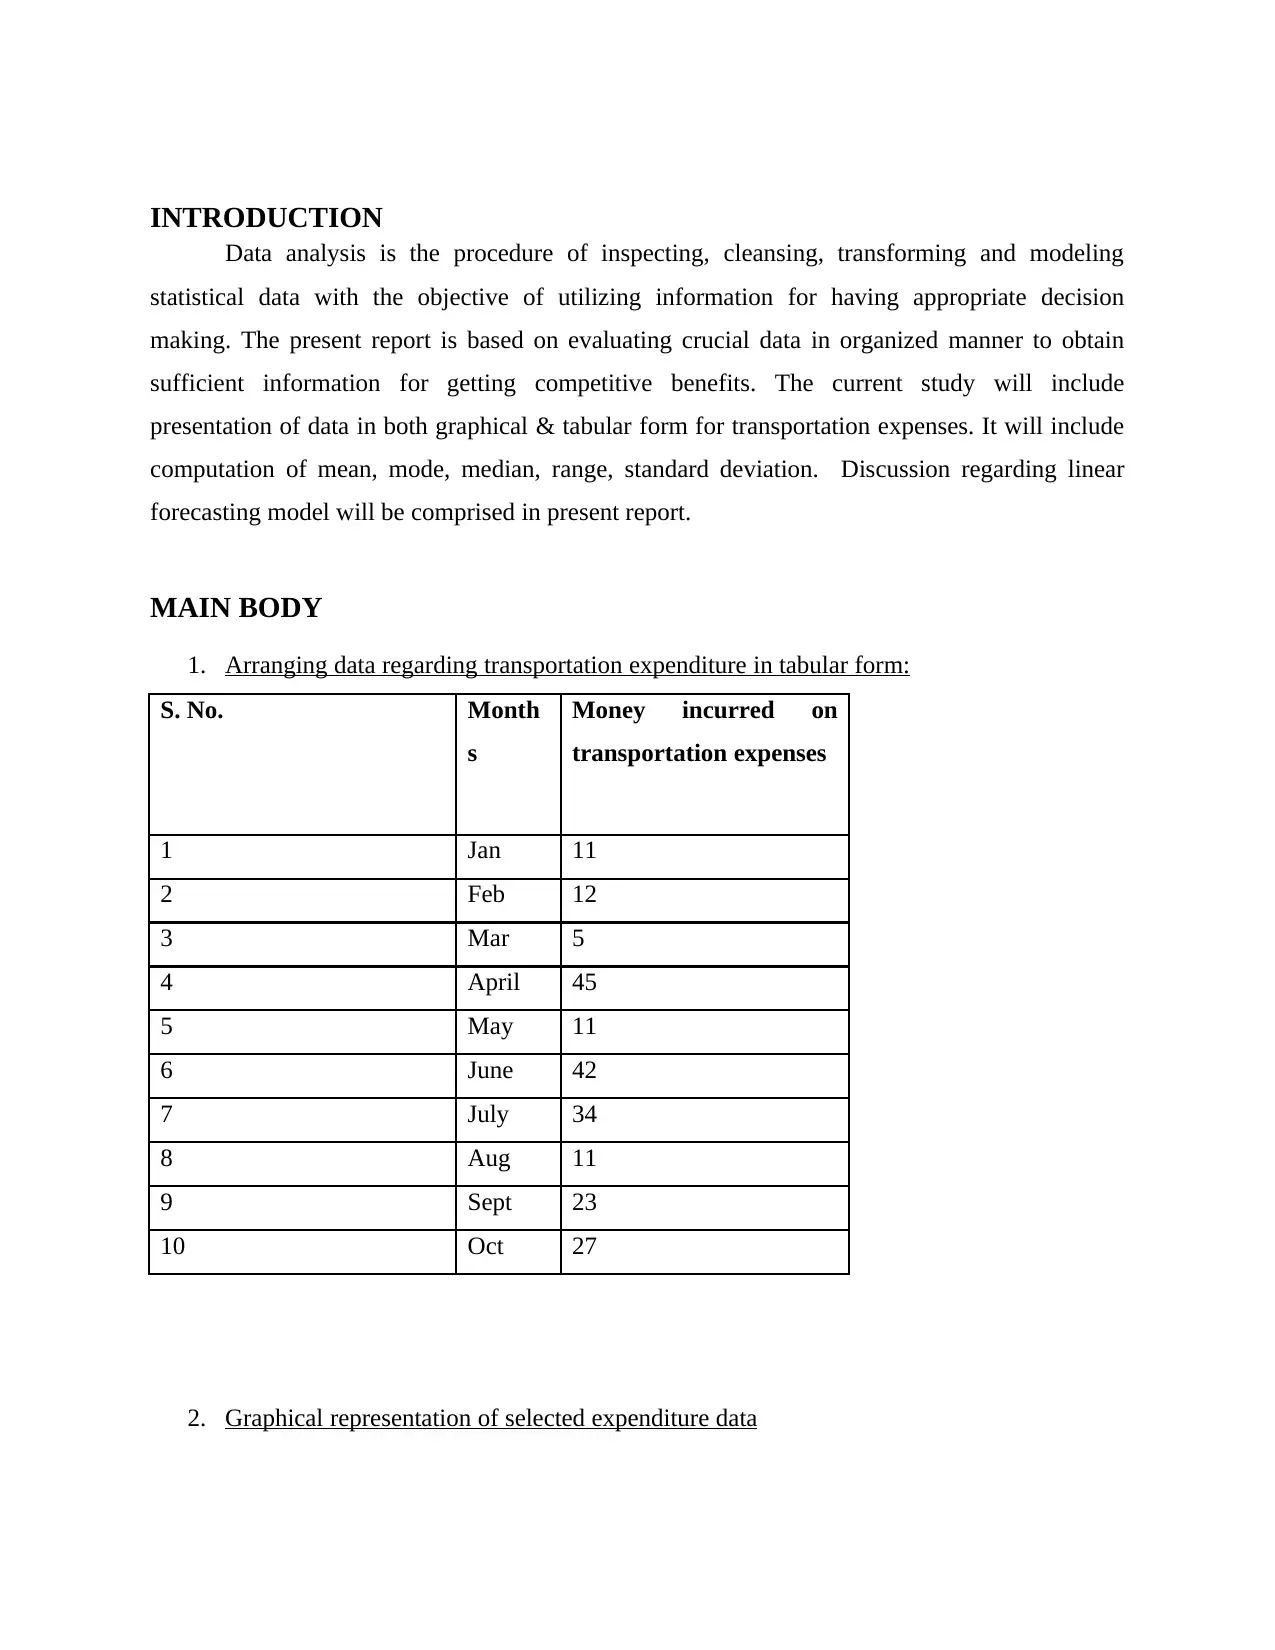
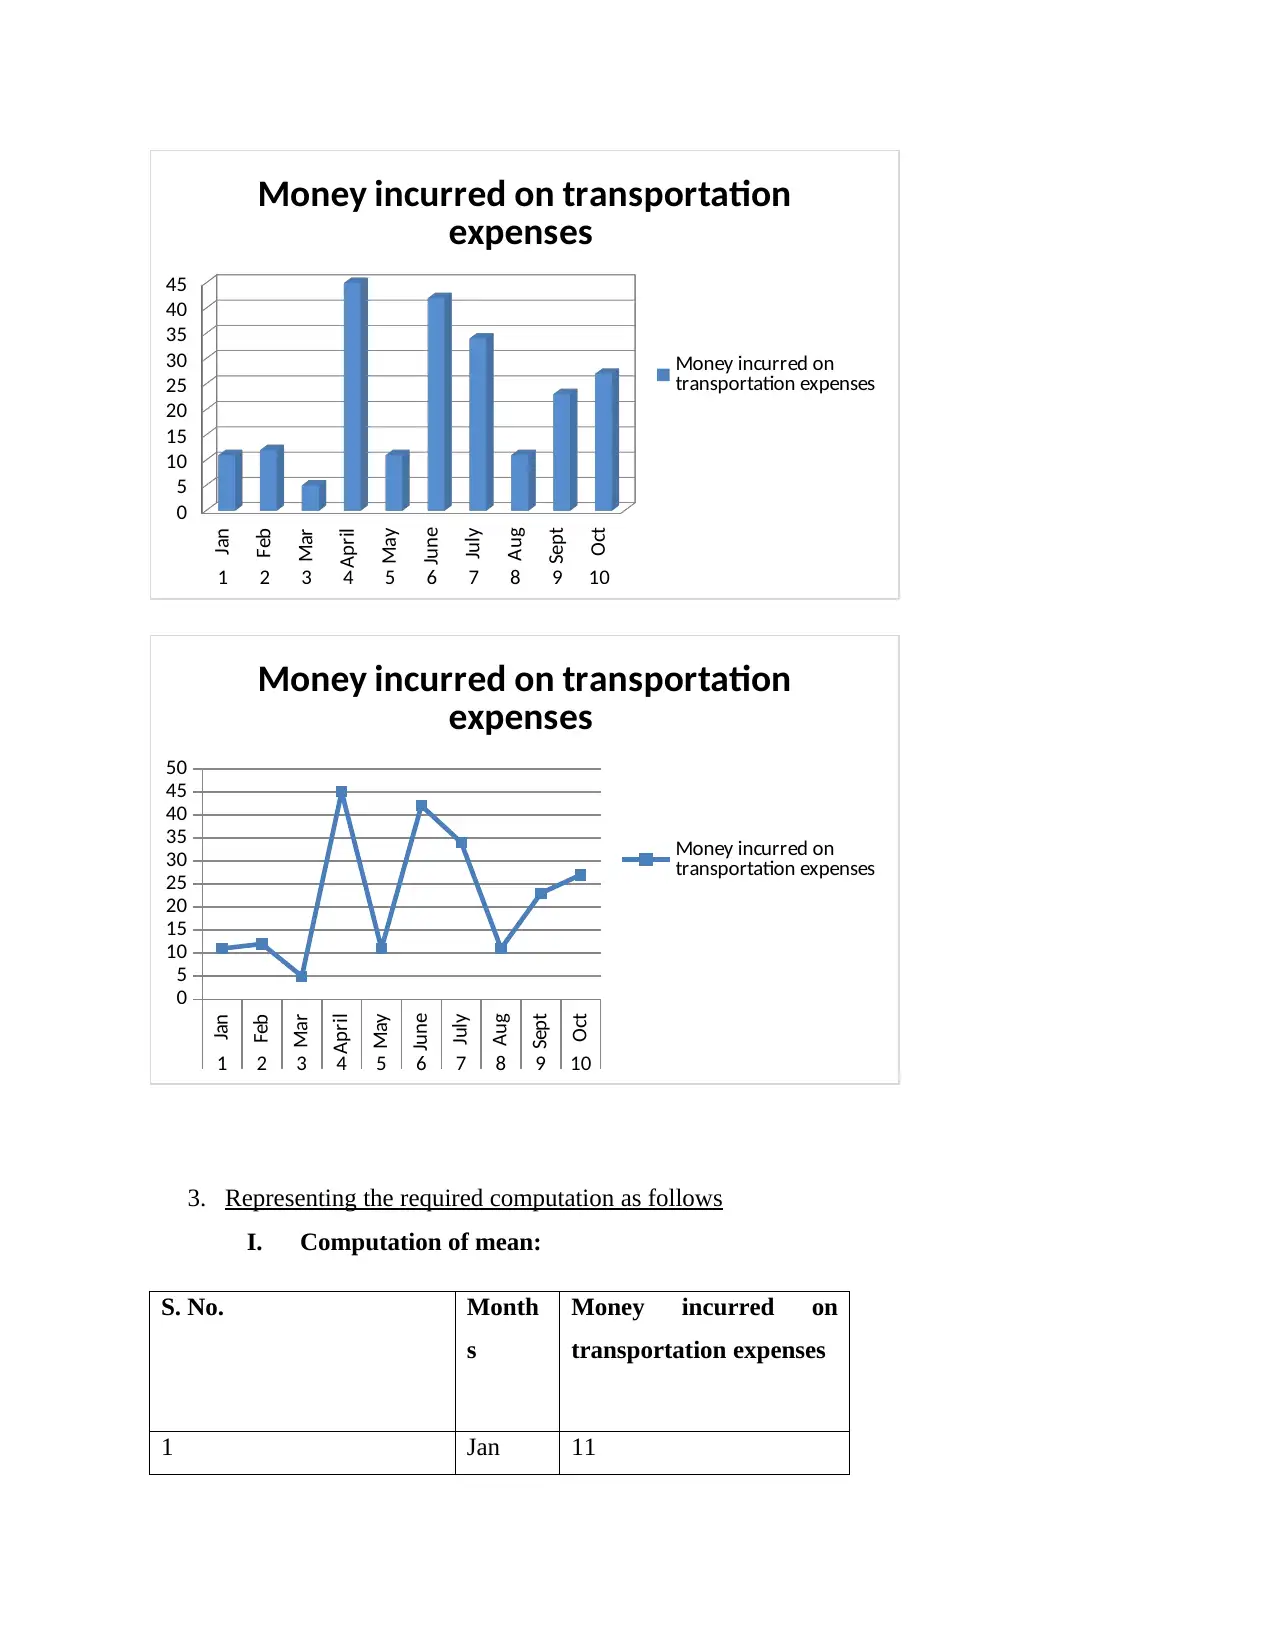
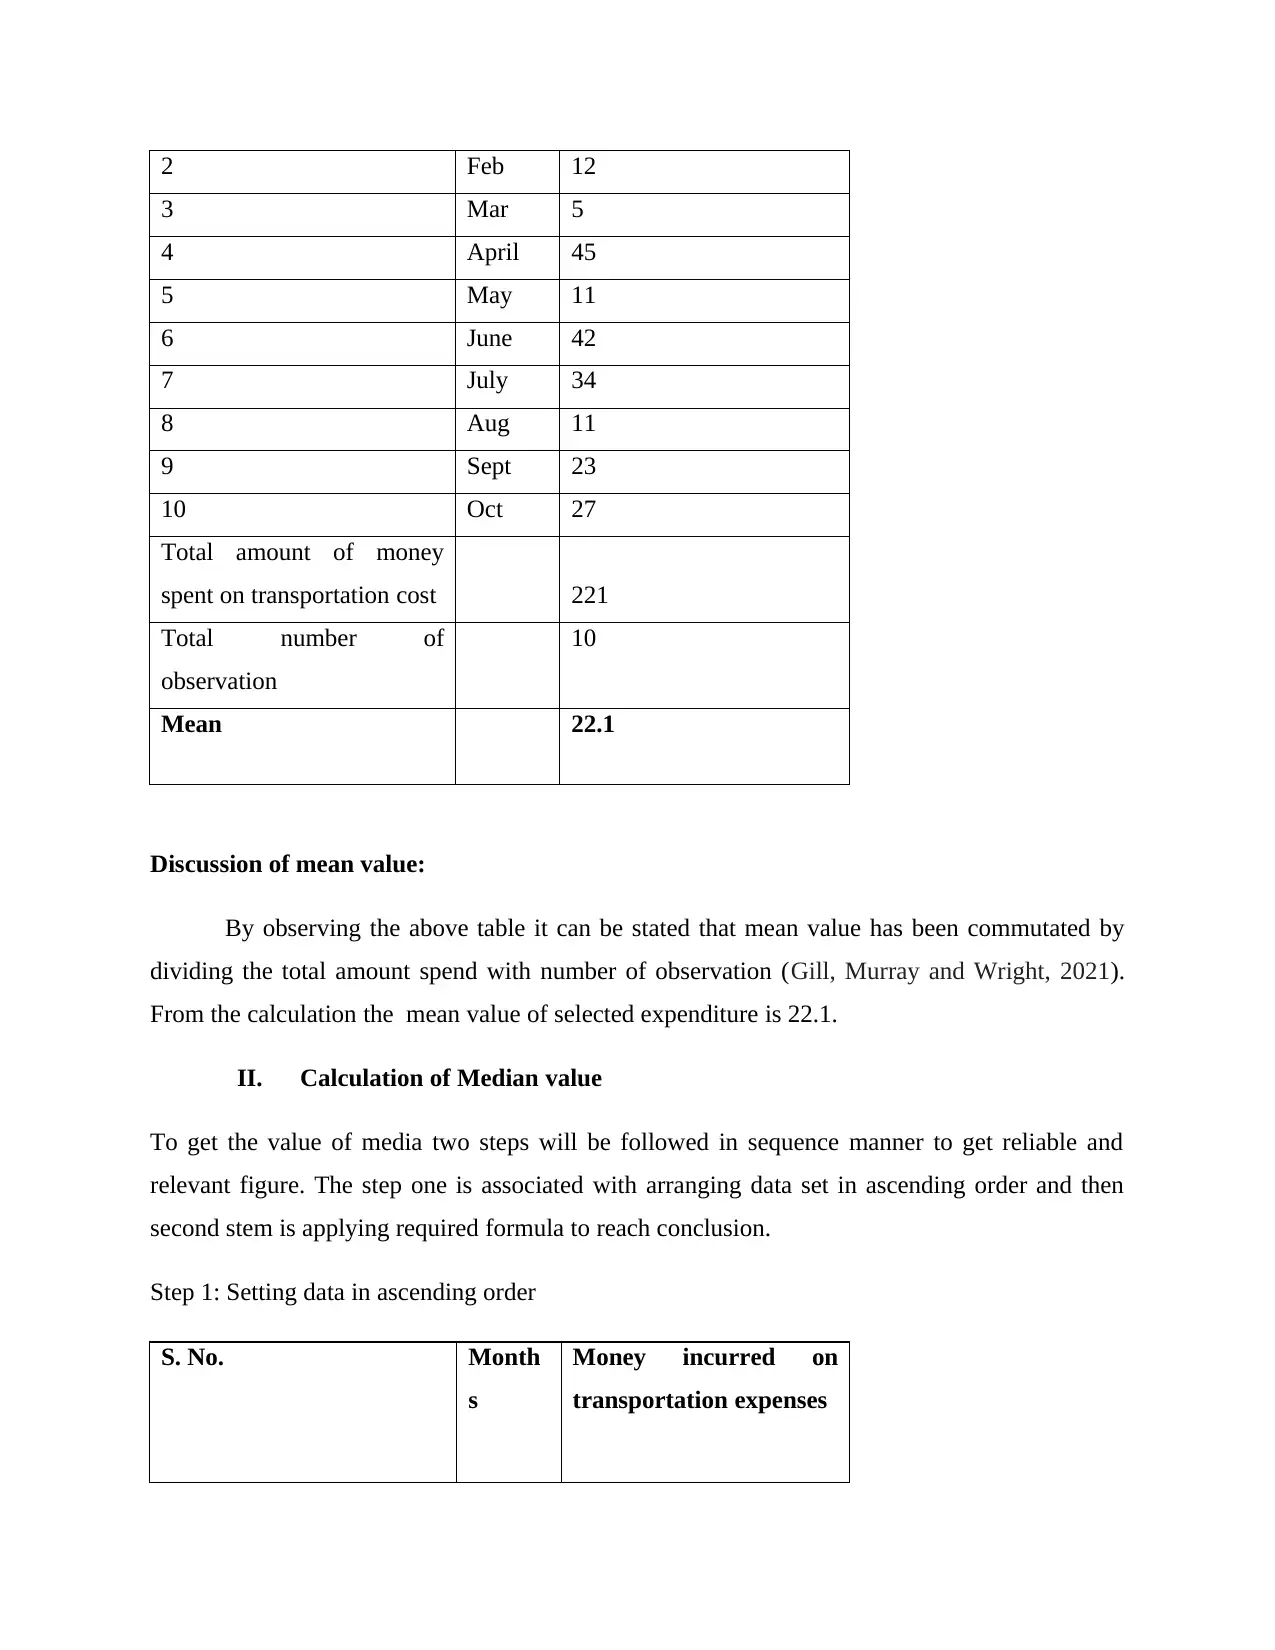
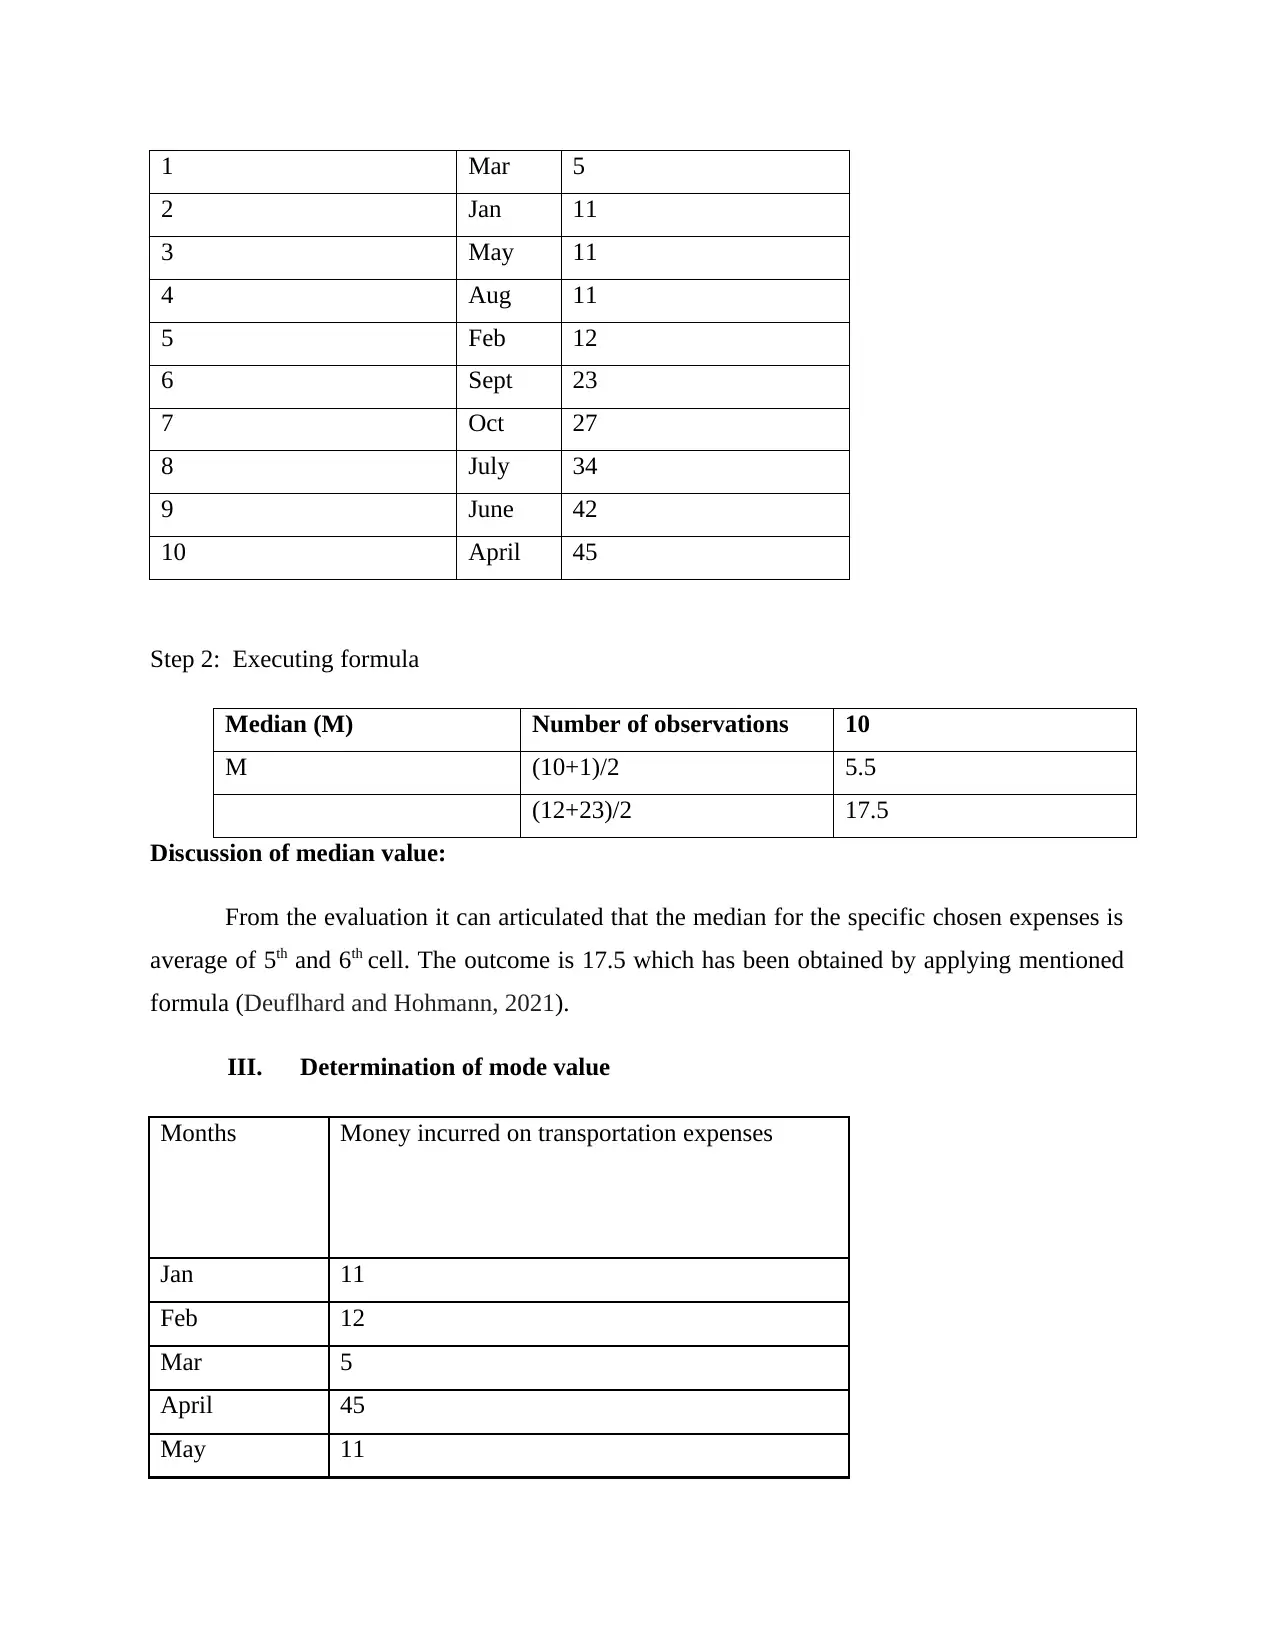
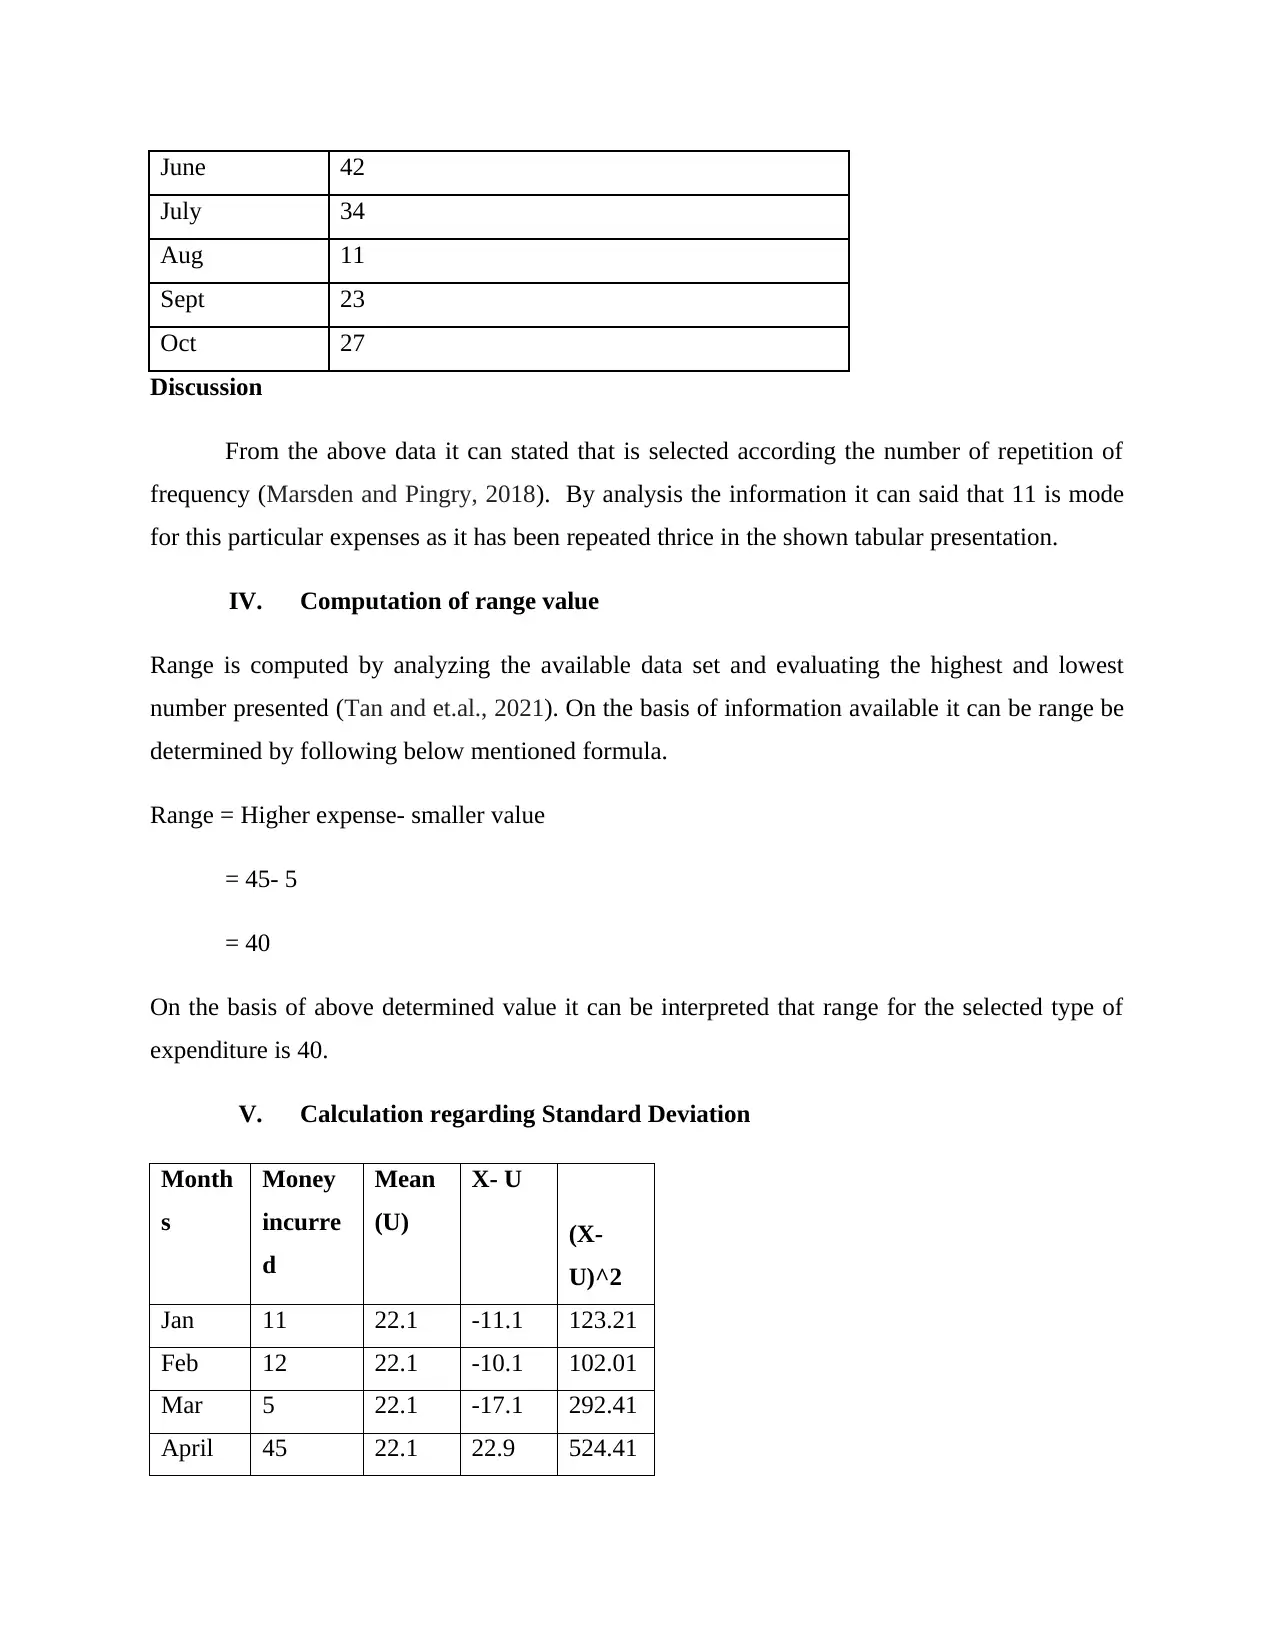
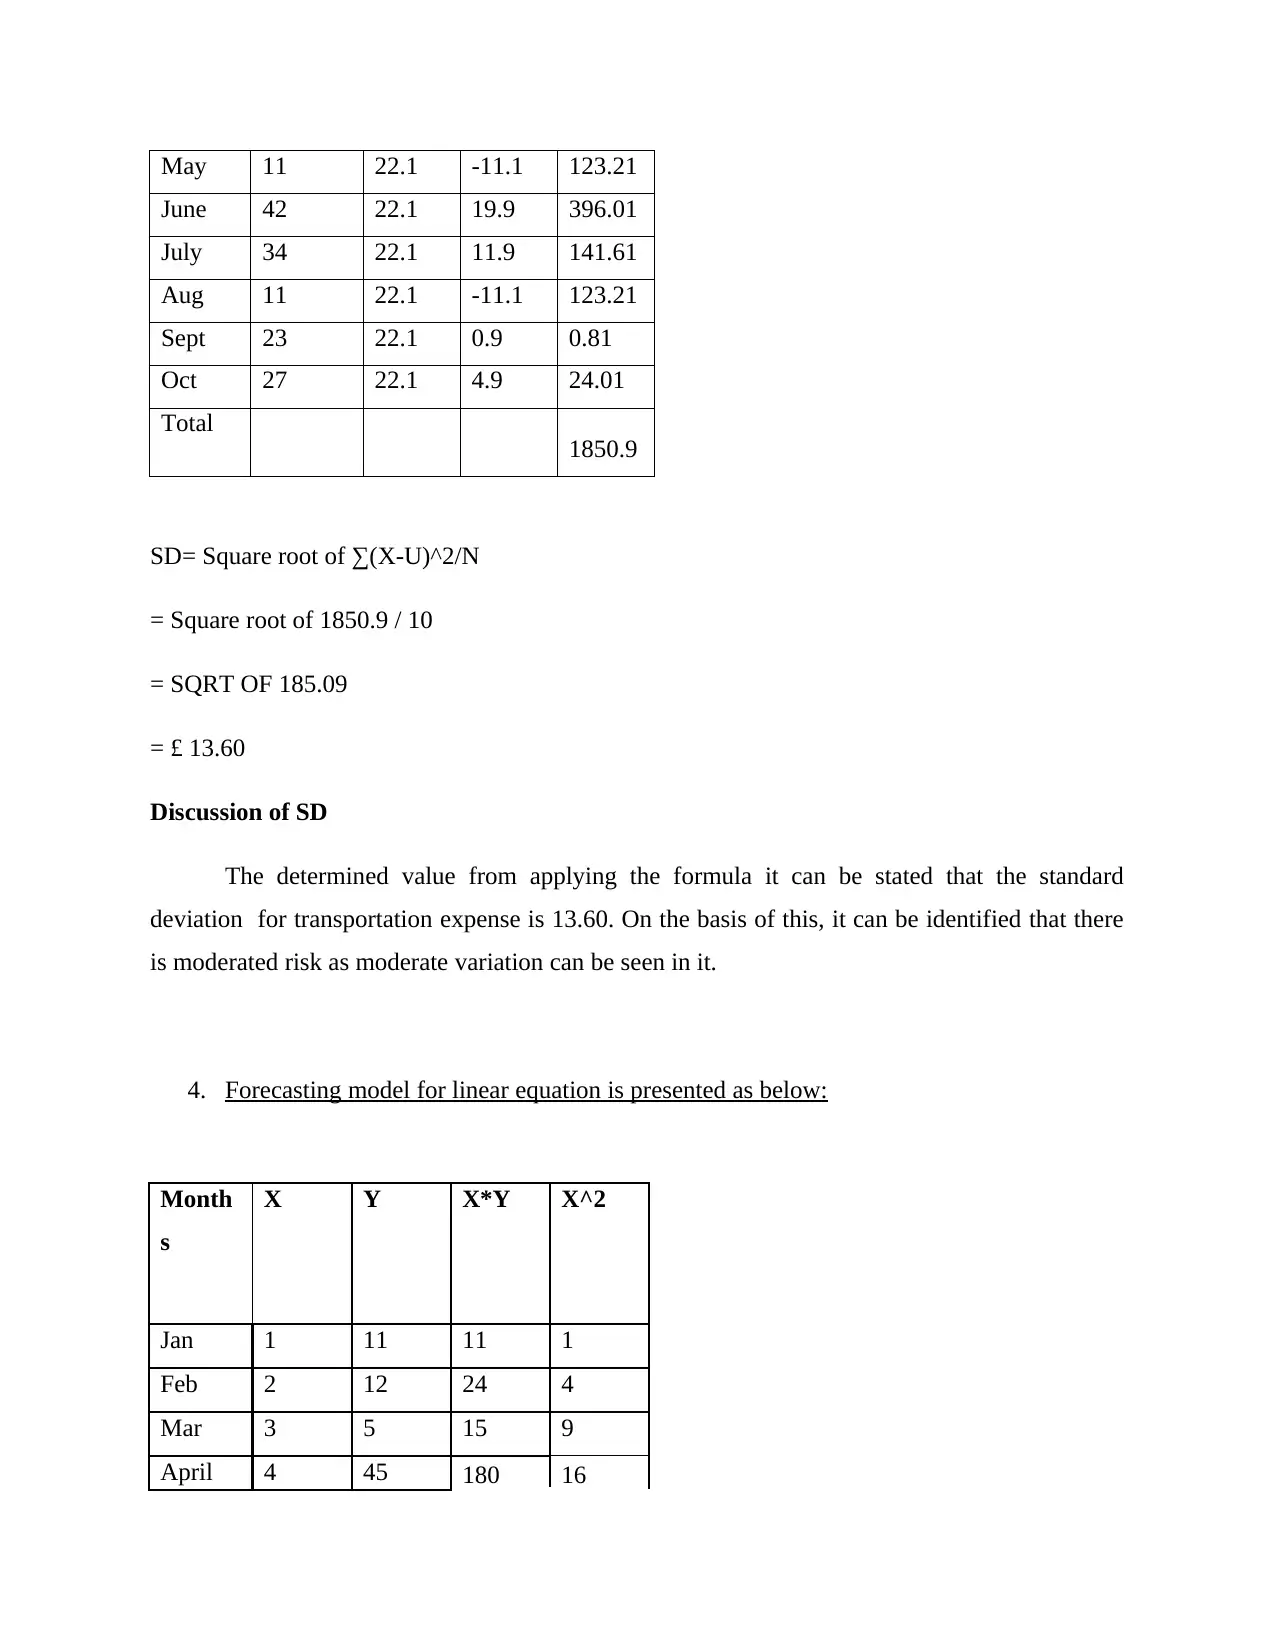
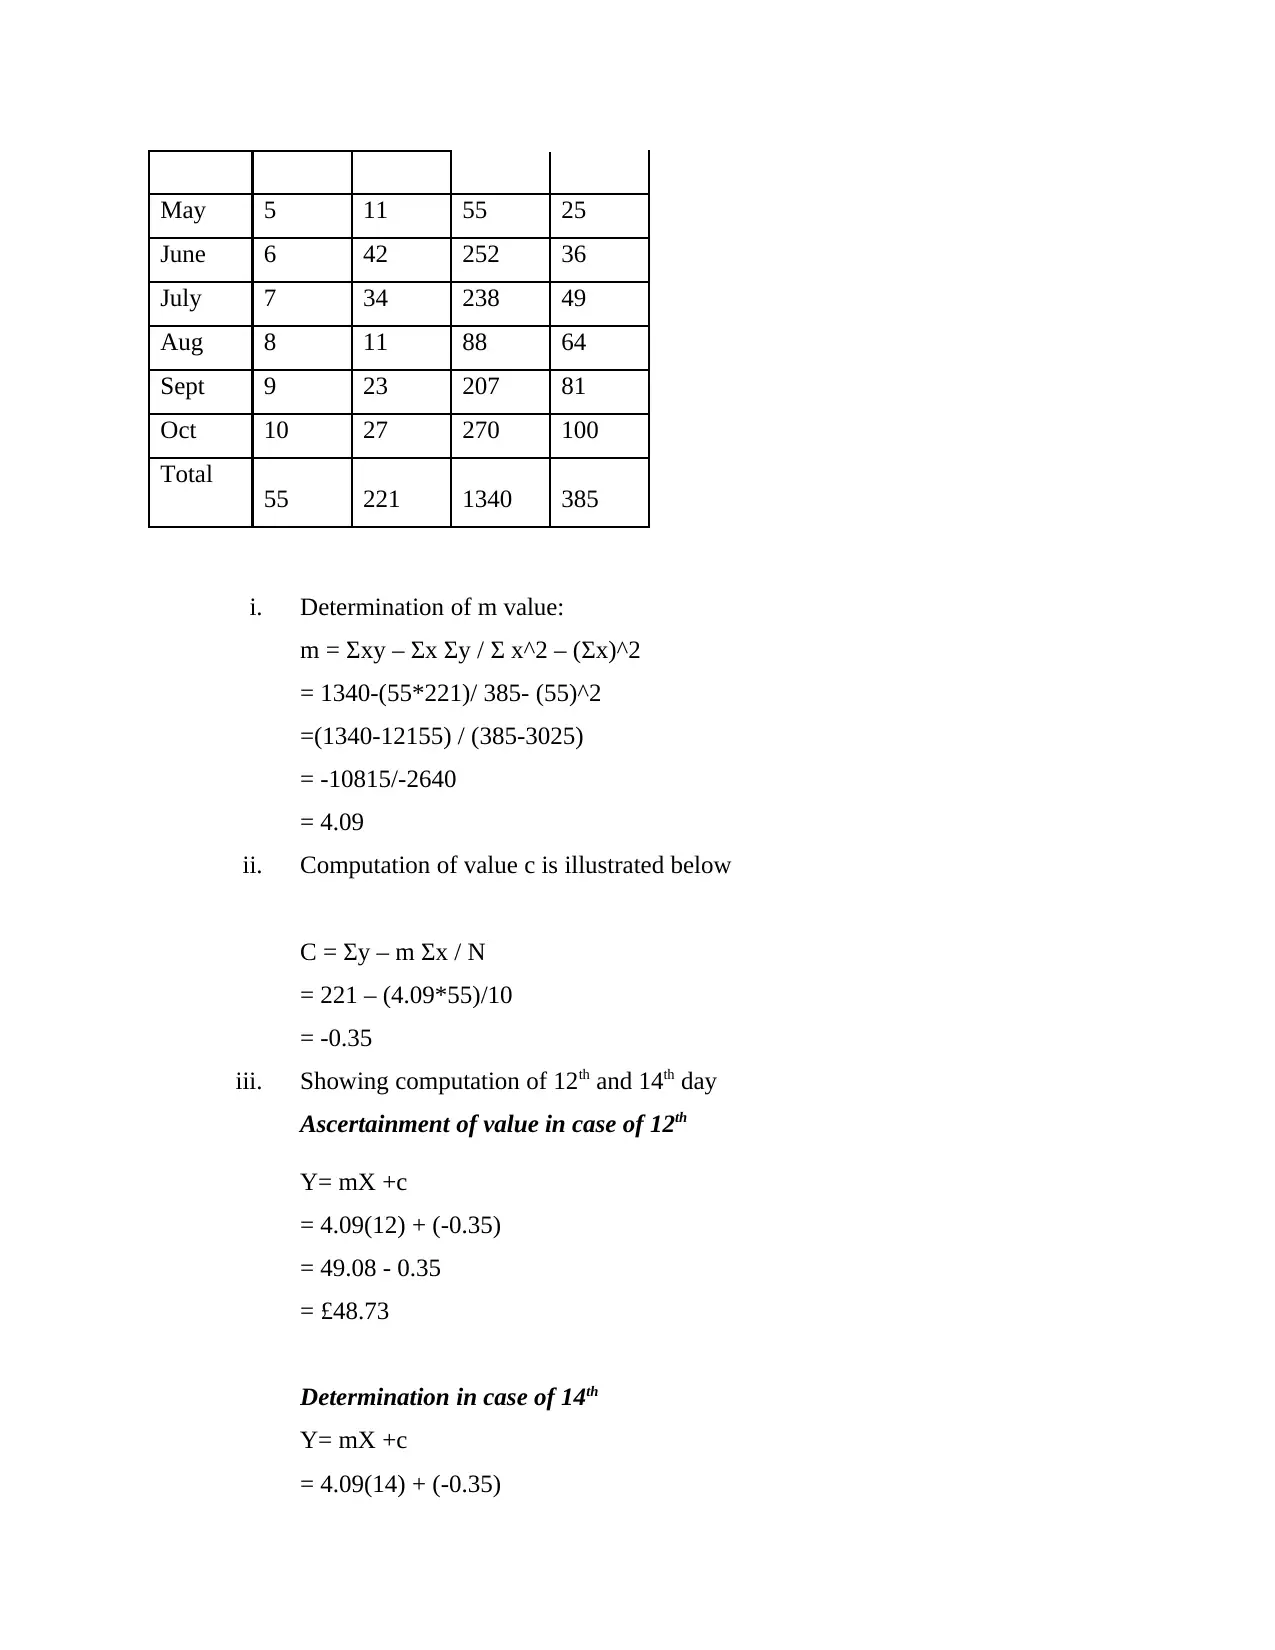
This report focuses on the importance of numerical and data analysis in decision making. It includes arranging data in tabular and graphical form, computation of mean, mode, median, range, and standard deviation. Additionally, it presents a forecasting model for linear equations.
Contribute Materials
Your contribution can guide someone’s learning journey. Share your
documents today.
1 out of 11
Related Documents


Your All-in-One AI-Powered Toolkit for Academic Success.
+13062052269
info@desklib.com
Available 24*7 on WhatsApp / Email
![[object Object]](/_next/static/media/star-bottom.7253800d.svg)
© 2024 | Zucol Services PVT LTD | All rights reserved.