Numeracy & Data Analysis: Linear Forecasting & Calculations
VerifiedAdded on 2023/06/11
|10
|1283
|414
Report
AI Summary
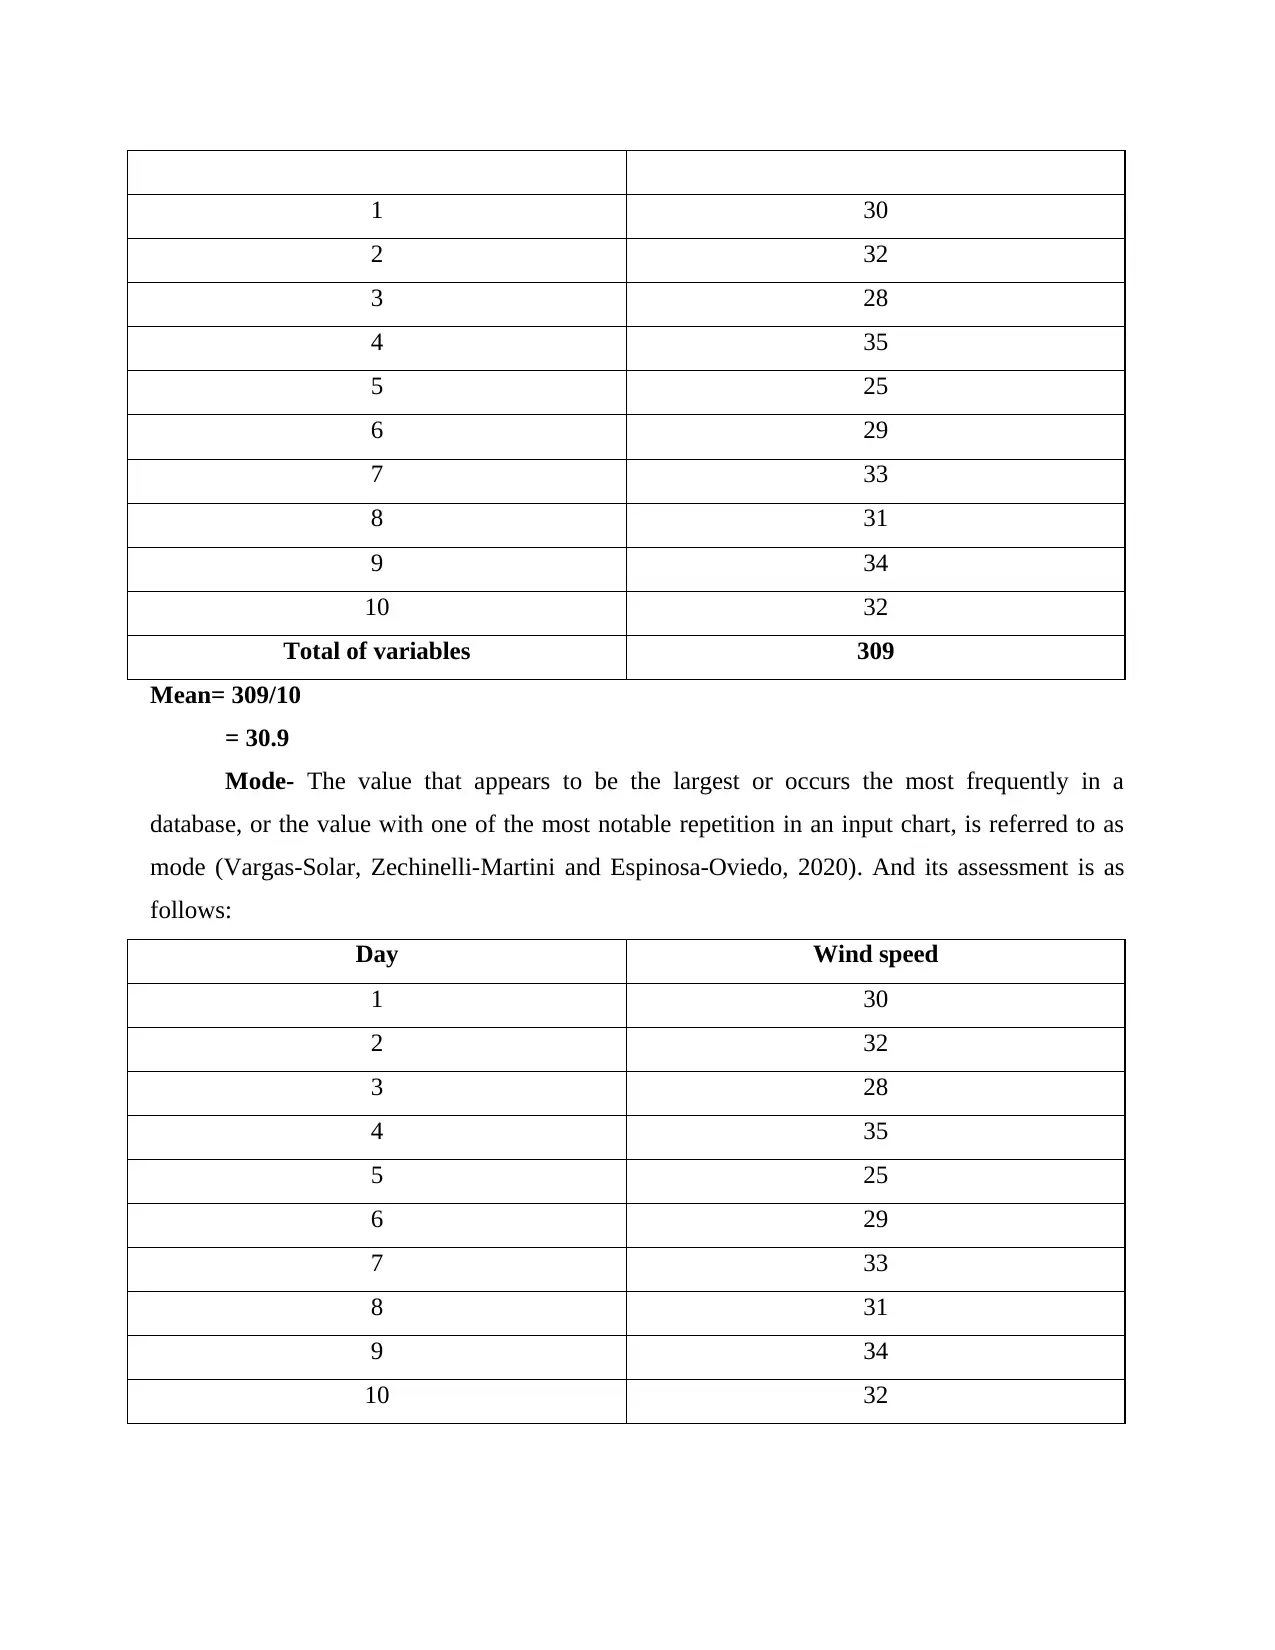
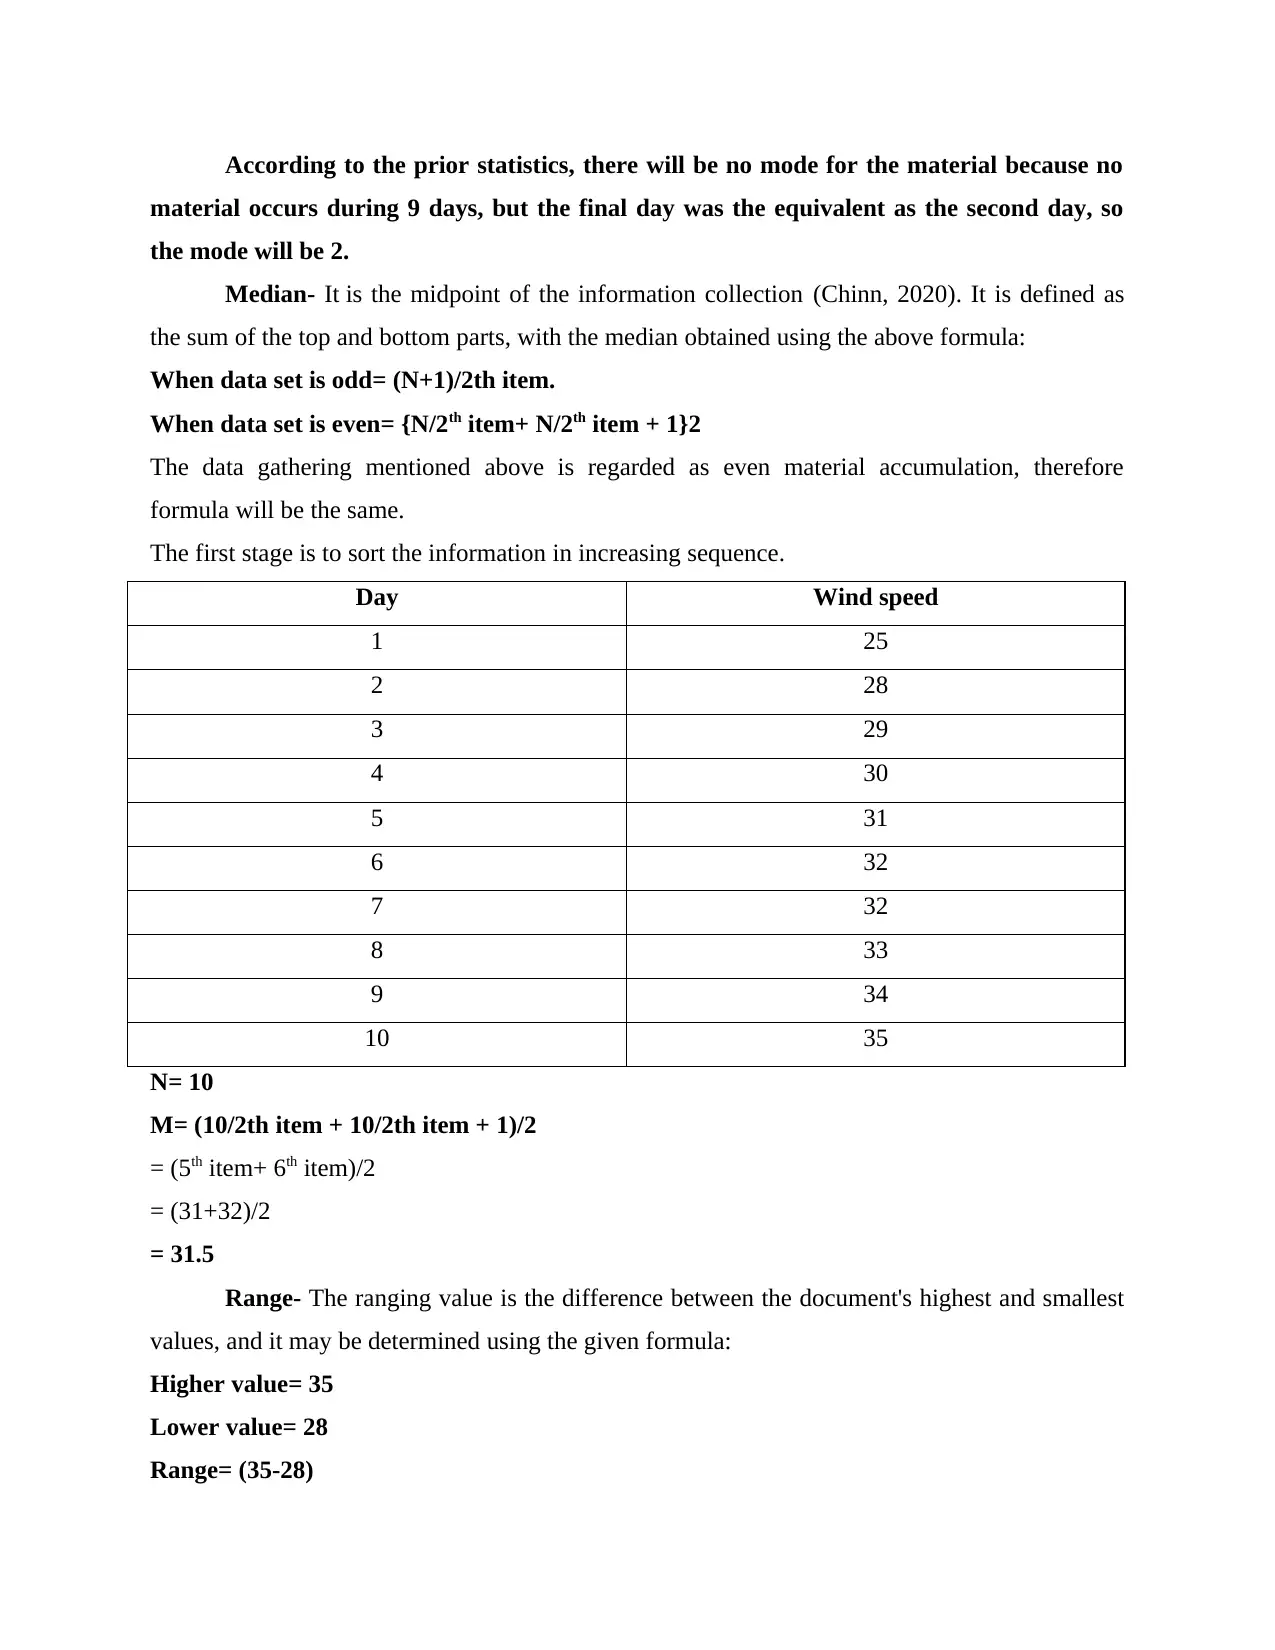
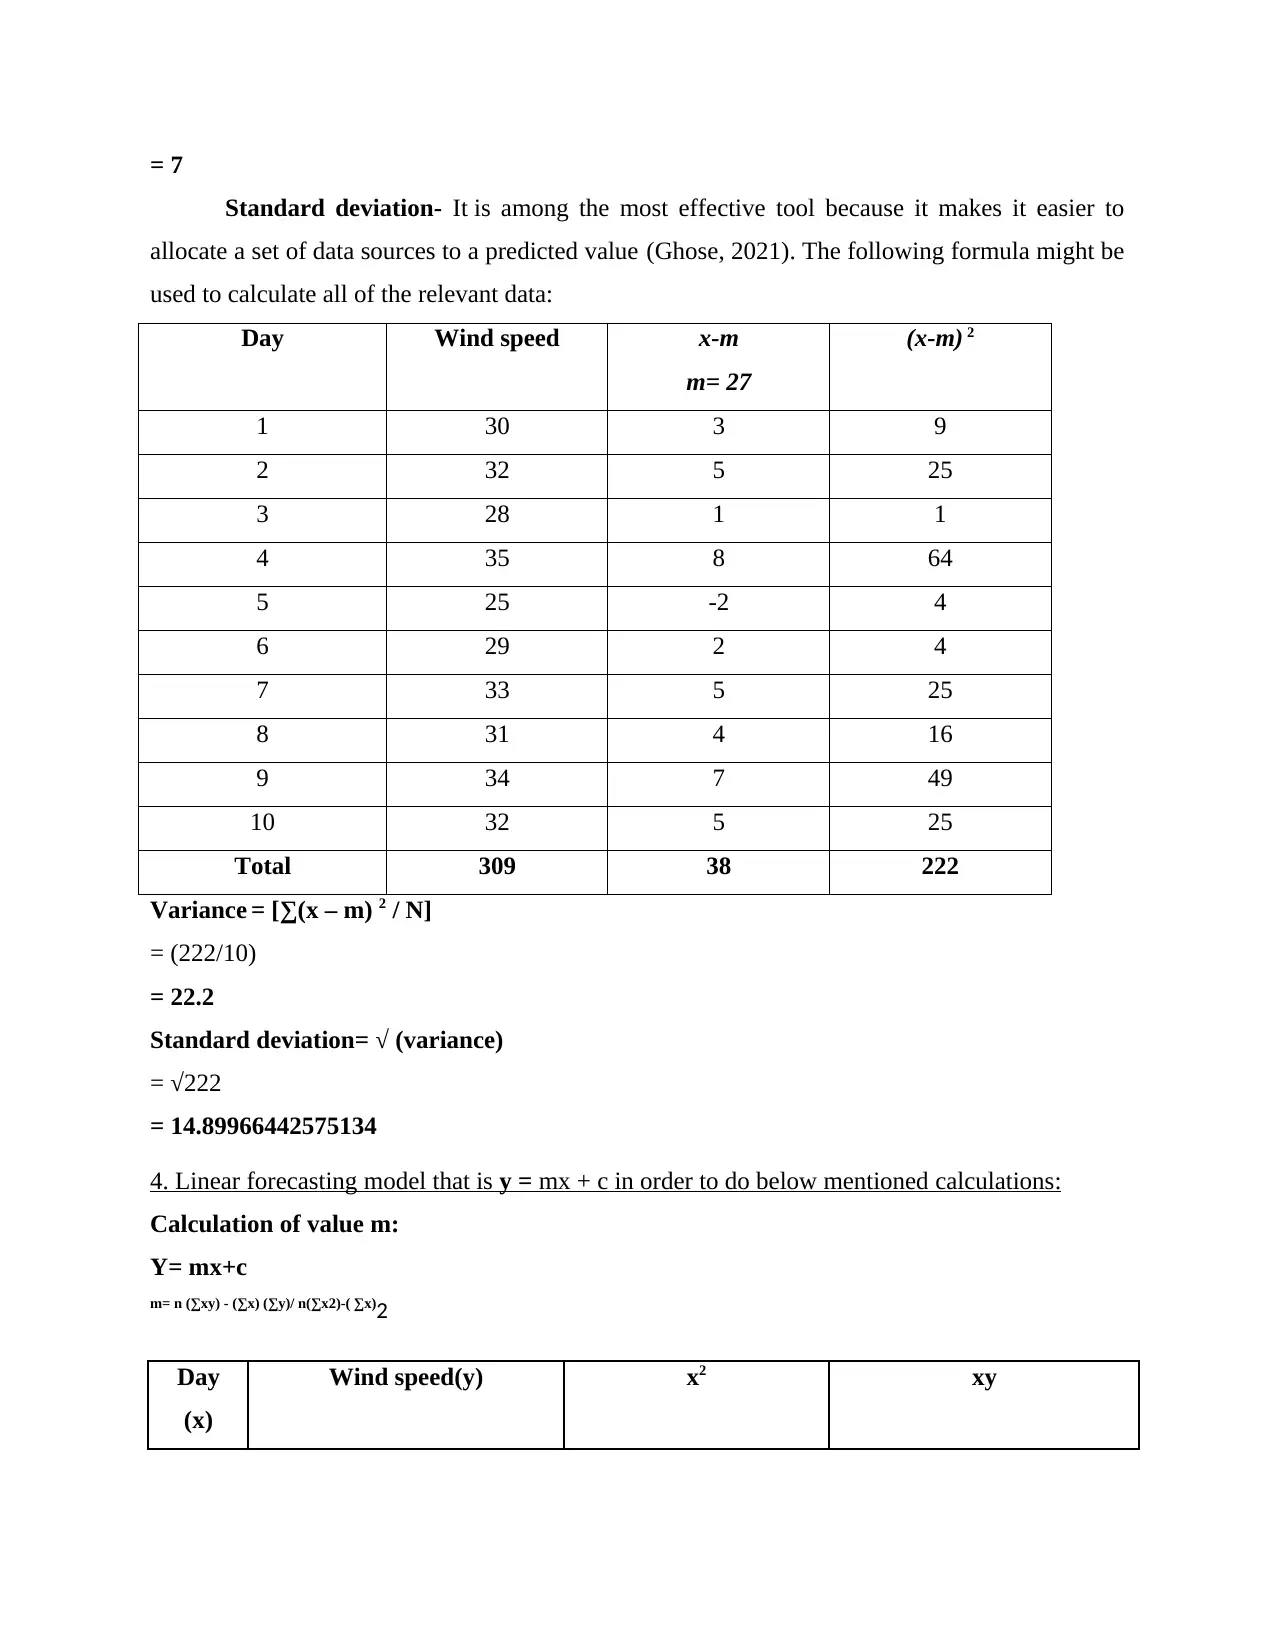
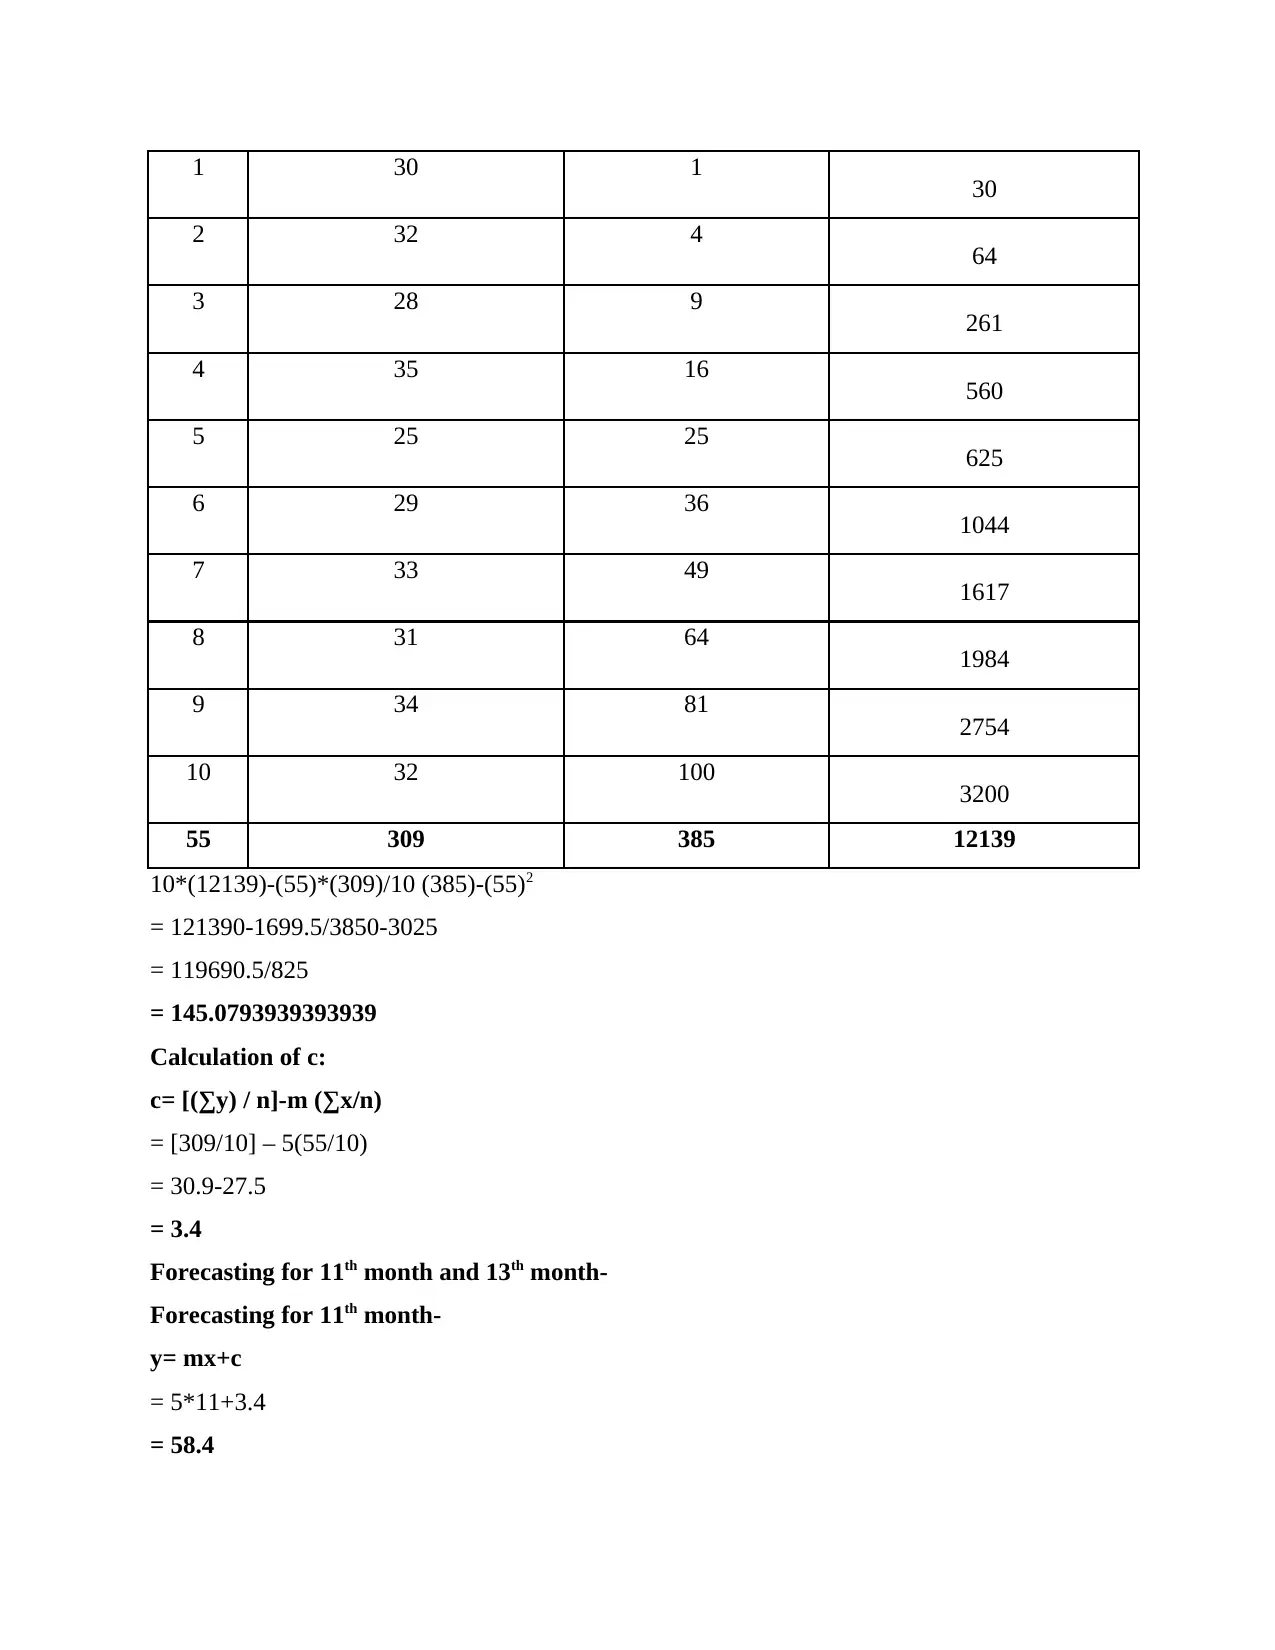
This report focuses on data analysis, presenting data in tables and charts. It assesses elements like mean, mode, median, range, and standard deviation. A linear forecasting model (y = mx + c) is applied to predict values for the 11th and 13th days, including calculations for mean, standard deviation. The report concludes that data analysis is crucial for businesses to understand expenditures and make informed decisions in a dynamic market environment. Desklib provides past papers and solved assignments for students.
1 out of 10
Related Documents


Your All-in-One AI-Powered Toolkit for Academic Success.
+13062052269
info@desklib.com
Available 24*7 on WhatsApp / Email
![[object Object]](/_next/static/media/star-bottom.7253800d.svg)
Copyright © 2020–2026 A2Z Services. All Rights Reserved. Developed and managed by ZUCOL.