Numeracy and Data Analysis Report: Wind Speed Analysis
VerifiedAdded on 2023/01/19
|11
|1560
|87
Report
AI Summary
This report presents a comprehensive analysis of wind speed data collected over a 10-day period in London. The analysis begins with presenting the data in both tabular and graphical forms, utilizing scattered and bar charts to visualize the trends. Statistical calculations, including mean, mode, media...

NUMERACY AND DATA
ANALYSIS
ANALYSIS
Paraphrase This Document
Need a fresh take? Get an instant paraphrase of this document with our AI Paraphraser

TABLE OF CONTENTS
INTRODUCTION ..........................................................................................................................1
Data in tabular form.....................................................................................................................1
Presentation of data in graphical form.........................................................................................1
Calculation of the following values.............................................................................................3
Calculation of linear forecasting model.......................................................................................6
CONCLUSION ...............................................................................................................................7
REFERENCES................................................................................................................................8

INTRODUCTION
Numeracy and data analysis is a process of collecting, analysing and evaluating data with
the help of different statistical tools (Huck, 2015). It is useful for discovering useful information
which is used by management for decision making. There are different methods used for data
analysis such as data mining, data visualisation, text analytics and business intelligence. In the
present report, 10 days wind speed of London was collected and analysed. The data is presented
in the tabular form and graphical form. Further report also contain the the calculation of mean,
mode, median, range and standard deviation from the collected data. Lastly report also includes
the calculation of linear forecasting with the help of equation.
Data in tabular form
Wind speed for 10 days of London is collected and presented in the tabular form as
follows:
Serial no. Days Sum of Wind Speed
1 10 166.99
2 11 469.82
3 12 368.56
4 13 298.79
5 14 119.22
6 15 194.21
7 16 176.42
8 17 304.23
9 18 205.53
10 19 144.35
Grand Total 2448.12
Presentation of data in graphical form
Scattered chart
This chart uses dots top represent the relation between the data. This type of chart is
generally used when there is 2 variables in the data. There can be 2 types of correlation between
the data i.e. positive and negative. Positive relation occurs when one variable of the data
1
⊘ This is a preview!⊘
Do you want full access?
Subscribe today to unlock all pages.
Trusted by 1+ million students worldwide

increases with the increase of another variable. Negative relation occurs when one variable
increases and the other variable decreases from the data set.
1 2 3 4 5 6 7 8 9 10
0
50
100
150
200
250
300
350
400
450
500
Sum of Temperature
Sum of Wind Speed
Bar graph
This type of graph represents the comparison between the data with respect to change in
time. The bars is plotted both vertically and horizontally. The height of the bar graph represents
the frequency of corresponding observations.
2
Paraphrase This Document
Need a fresh take? Get an instant paraphrase of this document with our AI Paraphraser

1 2 3 4 5 6 7 8 9 10 11
0
500
1000
1500
2000
2500
3000
3500
4000
Sum of Temperature
Sum of Wind Speed
Calculation of the following values
Serial no. Days
Sum of Wind
Speed ( X)
1 10 166.99
2 11 469.82
3 12 368.56
4 13 298.79
5 14 119.22
6 15 194.21
7 16 176.42
8 17 304.23
9 18 205.53
10 19 144.35
Grand Total 2448.12
MEAN
Mean is a statistical distribution or arithmetic average of range, it is calculated by
dividing total of values by number of values. It is one of the most common and best measure to
calculate the mid-point. In simple words it is an average of total number of values. It is extracted
by the central tendency of data. Statistical mean main aim is to include every data and take out
the average of it. It is beneficial for statistical measurement and data interpretation
(Goshvarpour, Abbasi and Goshvarpour, 2015).
Mean = Sum of terms / Number of terms
Wind Speed
3

= 2448.12 / 10
= 244.8
MODE
It is defined as the most repeated value in the data set, or it is most likely to appear. It is
calculated by arranging the data in order to count the frequency, the highest number of data
occurring will be the mode of that data set. Distribution of two modes id known as bimodal,
distribution of three modes is called trimodal (Luo, Wan, Liu and Tong, 2018).
Mode = 119.22
MEDIAN
Median is defined as the middle number in the data set. It is one of the way to determine
the average of the data set. If the data set is odd then first arrange the data in smallest to largest
form, there will be median in between and equal numbers on both the sides of median. If the data
set is even then the middle number is median (Tubaiz, N., Shanableh, T. and Assaleh, 2015).
Median = [(n+1)/2]
Number of observation = 10
Median = (10 + 1) / 2
= 5.5
Wind flow
M = (119.22 + 194.21) / 2
= 156.72
RANGE
It is the the difference between the maximum and minimum value. Range is the variance
between 2 extreme points on distribution curve for a continuous random variable. It is calculated
by subtracting lower value from the higher value in the data set.
Range = Higher value – Lower value
Wind flow
= 469.82 – 119.22
= 350.6
STANDARD DEVIATION
4
⊘ This is a preview!⊘
Do you want full access?
Subscribe today to unlock all pages.
Trusted by 1+ million students worldwide
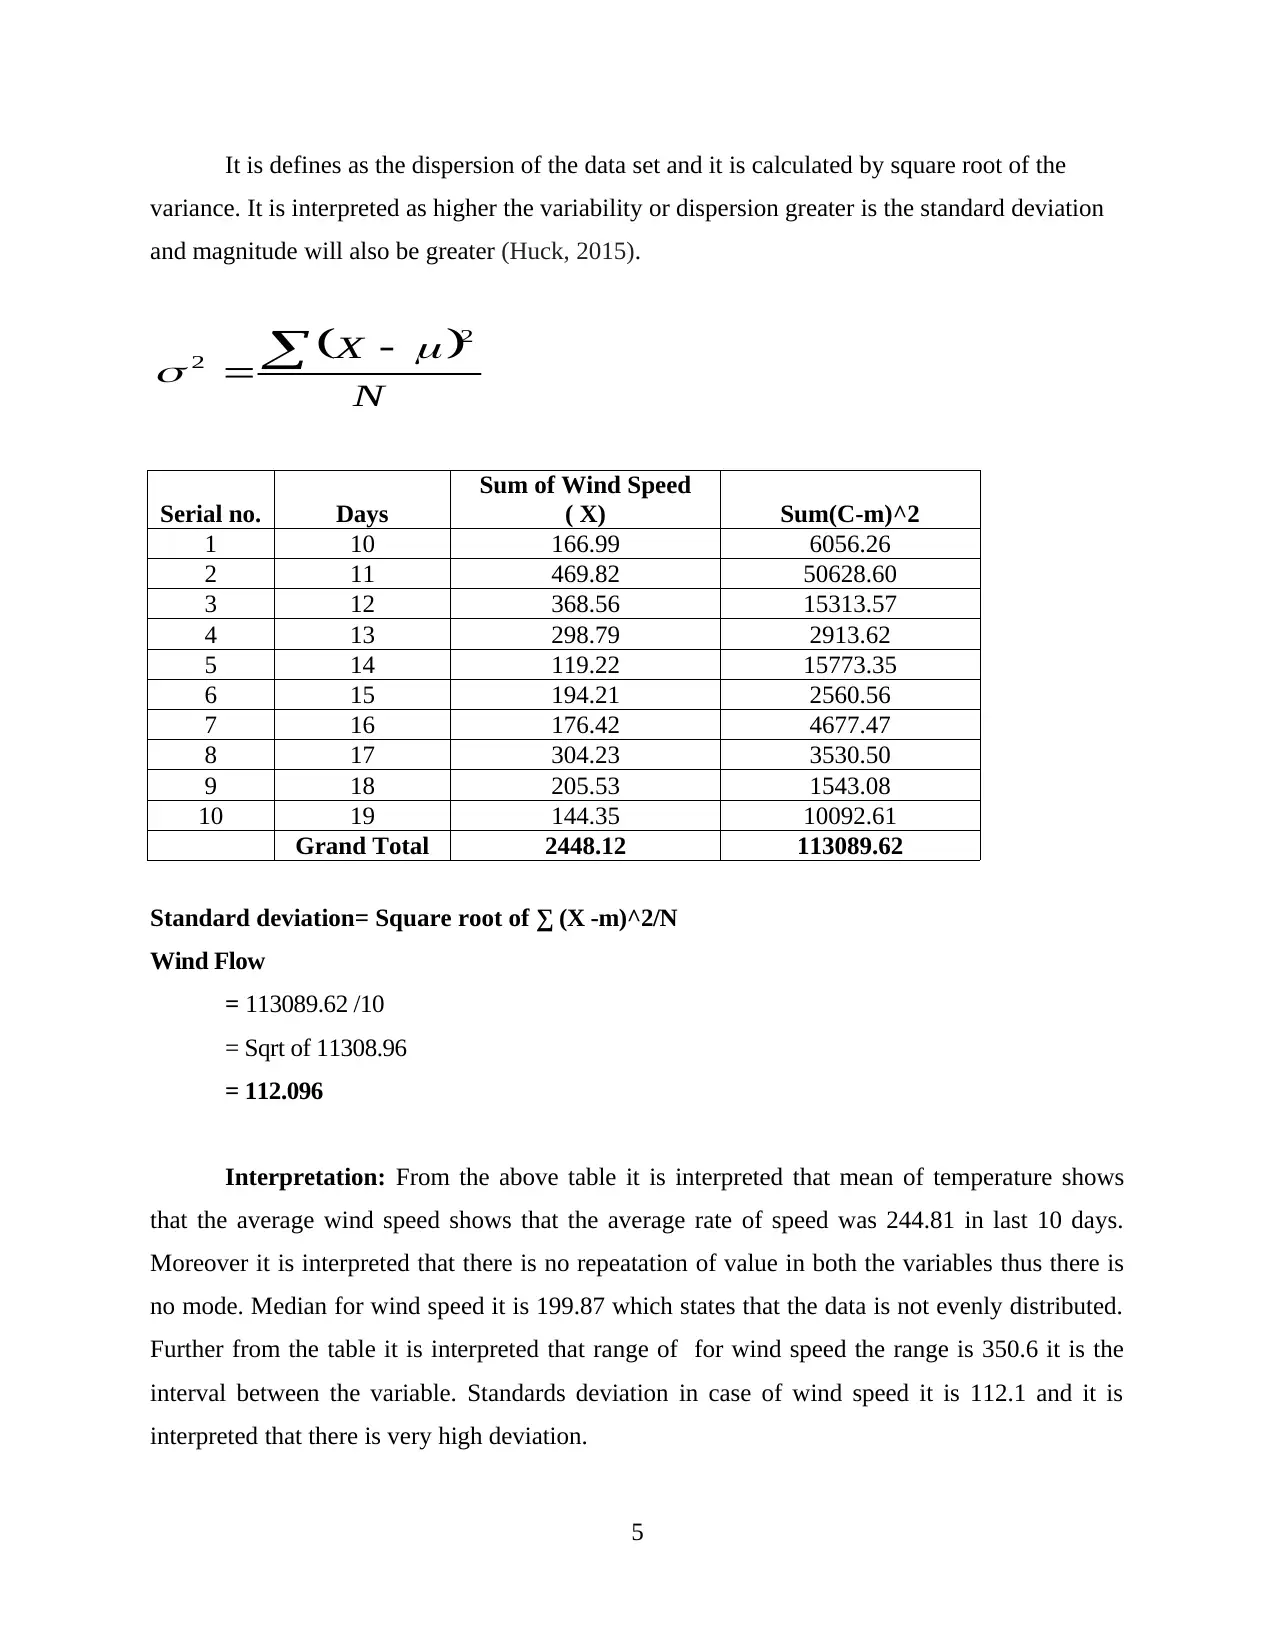
It is defines as the dispersion of the data set and it is calculated by square root of the
variance. It is interpreted as higher the variability or dispersion greater is the standard deviation
and magnitude will also be greater (Huck, 2015).
N
X
2
2
Serial no. Days
Sum of Wind Speed
( X) Sum(C-m)^2
1 10 166.99 6056.26
2 11 469.82 50628.60
3 12 368.56 15313.57
4 13 298.79 2913.62
5 14 119.22 15773.35
6 15 194.21 2560.56
7 16 176.42 4677.47
8 17 304.23 3530.50
9 18 205.53 1543.08
10 19 144.35 10092.61
Grand Total 2448.12 113089.62
Standard deviation= Square root of ∑ (X -m)^2/N
Wind Flow
= 113089.62 /10
= Sqrt of 11308.96
= 112.096
Interpretation: From the above table it is interpreted that mean of temperature shows
that the average wind speed shows that the average rate of speed was 244.81 in last 10 days.
Moreover it is interpreted that there is no repeatation of value in both the variables thus there is
no mode. Median for wind speed it is 199.87 which states that the data is not evenly distributed.
Further from the table it is interpreted that range of for wind speed the range is 350.6 it is the
interval between the variable. Standards deviation in case of wind speed it is 112.1 and it is
interpreted that there is very high deviation.
5
Paraphrase This Document
Need a fresh take? Get an instant paraphrase of this document with our AI Paraphraser

Calculation of linear forecasting model
X
Sum of Wind
Speed (Y) X*Y X^2
1 166.99 166.99 1
2 469.82 939.64 4
3 368.56 1105.68 9
4 298.79 1195.16 16
5 119.22 596.1 25
6 194.21 1165.26 36
7 176.42 1234.94 49
8 304.23 2433.84 64
9 205.53 1849.77 81
10 144.35 1443.5 100
55 2448.12 12130.88 385
m = NΣxy – Σx Σy / NΣ x^2 – (Σx)^2
Y = mX + c
Calculation of m
M = 10 (12130.88) - (55 * 2448.12) / (10 * 385) – (55)^2
m = (121308.8 – 134640) / (3850 – 3025)
m = 13331.2 / 825
m = 16.16
Calculation of c
c = Σy – m Σx / N
c = 2448 – (16.16 * 55) / 10
c = (2448 – .888.8) / 10
c = 1559.2 / 10
c = 155.92
Computing value of Y by making use of m and c value on 14th and 21st day
For 14th day-
Y = mX + c
= 16.16 (14) + 155.92
= 226.24 + 155.92
= 382.16
For 21st day -
Y = mX + c
= 16.16 (21) +155.92
6

= 339.36 + 155.92
= 495.28
CONCLUSION
From the above analysis it can be concluded that the for data analysis there are various
methods used such as mean, mode, median, range and covariance, beta and standard deviation.
All these statistical tools are useful in analysing the data in meaningful manner. To identify the
relation between the variable median is calculated and also data were presented in the graphical
manner.
7
⊘ This is a preview!⊘
Do you want full access?
Subscribe today to unlock all pages.
Trusted by 1+ million students worldwide

REFERENCES
Books and Journals
Goshvarpour, A., Abbasi, A. and Goshvarpour, A., 2015. Affective visual stimuli:
Characterization of the picture sequences impacts by means of nonlinear approaches. Basic and
clinical neuroscience. 6(4). p.209.
Tubaiz, N., Shanableh, T. and Assaleh, K., 2015. Glove-based continuous Arabic sign language
recognition in user-dependent mode. IEEE Transactions on Human-Machine Systems. 45(4).
pp.526-533.
Luo, D., Wan, X., Liu, J. and Tong, T., 2018. Optimally estimating the sample mean from the
sample size, median, mid-range, and/or mid-quartile range. Statistical methods in medical
research. 27(6). pp.1785-1805.
Huck, S. W., 2015. Statistical misconceptions: Classic edition. Routledge.
8
Paraphrase This Document
Need a fresh take? Get an instant paraphrase of this document with our AI Paraphraser

9
1 out of 11
Related Documents


Your All-in-One AI-Powered Toolkit for Academic Success.
+13062052269
info@desklib.com
Available 24*7 on WhatsApp / Email
![[object Object]](/_next/static/media/star-bottom.7253800d.svg)
Unlock your academic potential
© 2024 | Zucol Services PVT LTD | All rights reserved.