Data Analysis: Calculating Mean, Median, and Forecasting Models
VerifiedAdded on 2023/01/11
|9
|1322
|73
Homework Assignment
AI Summary
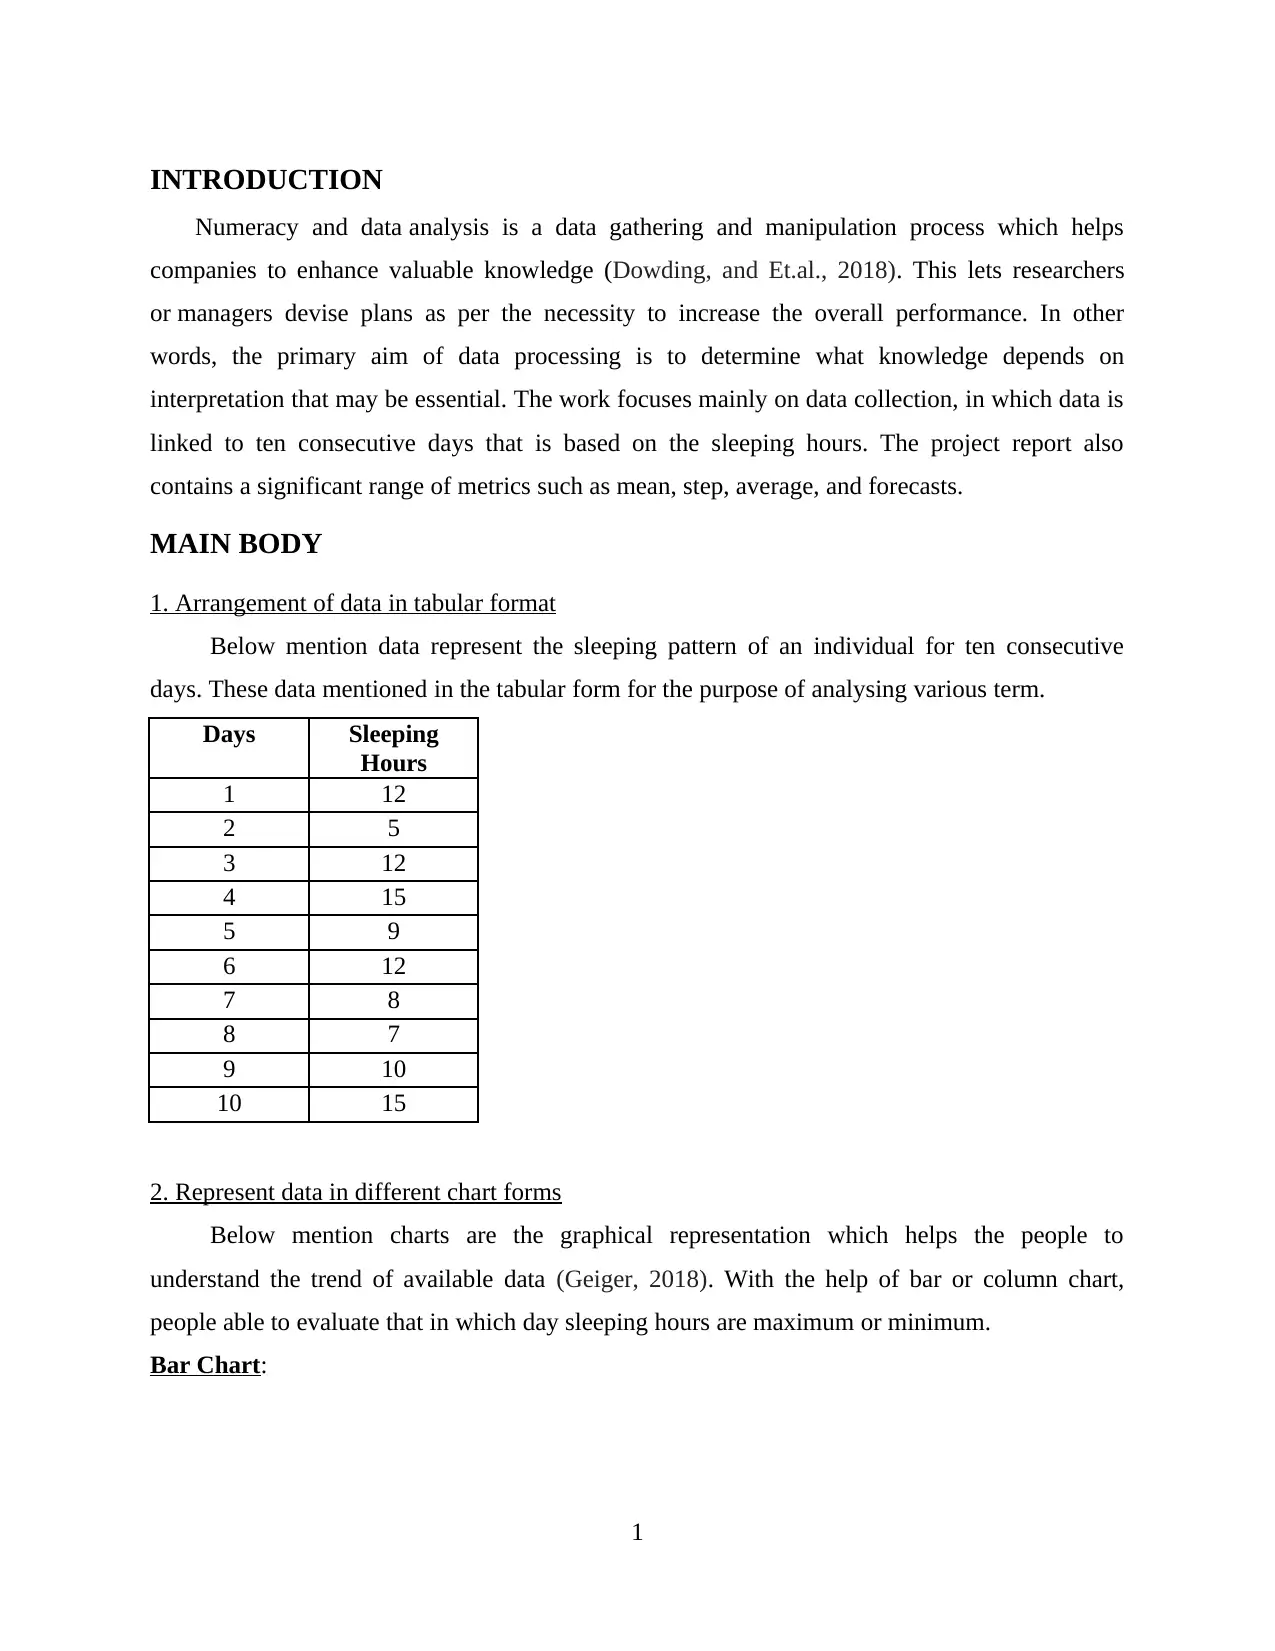
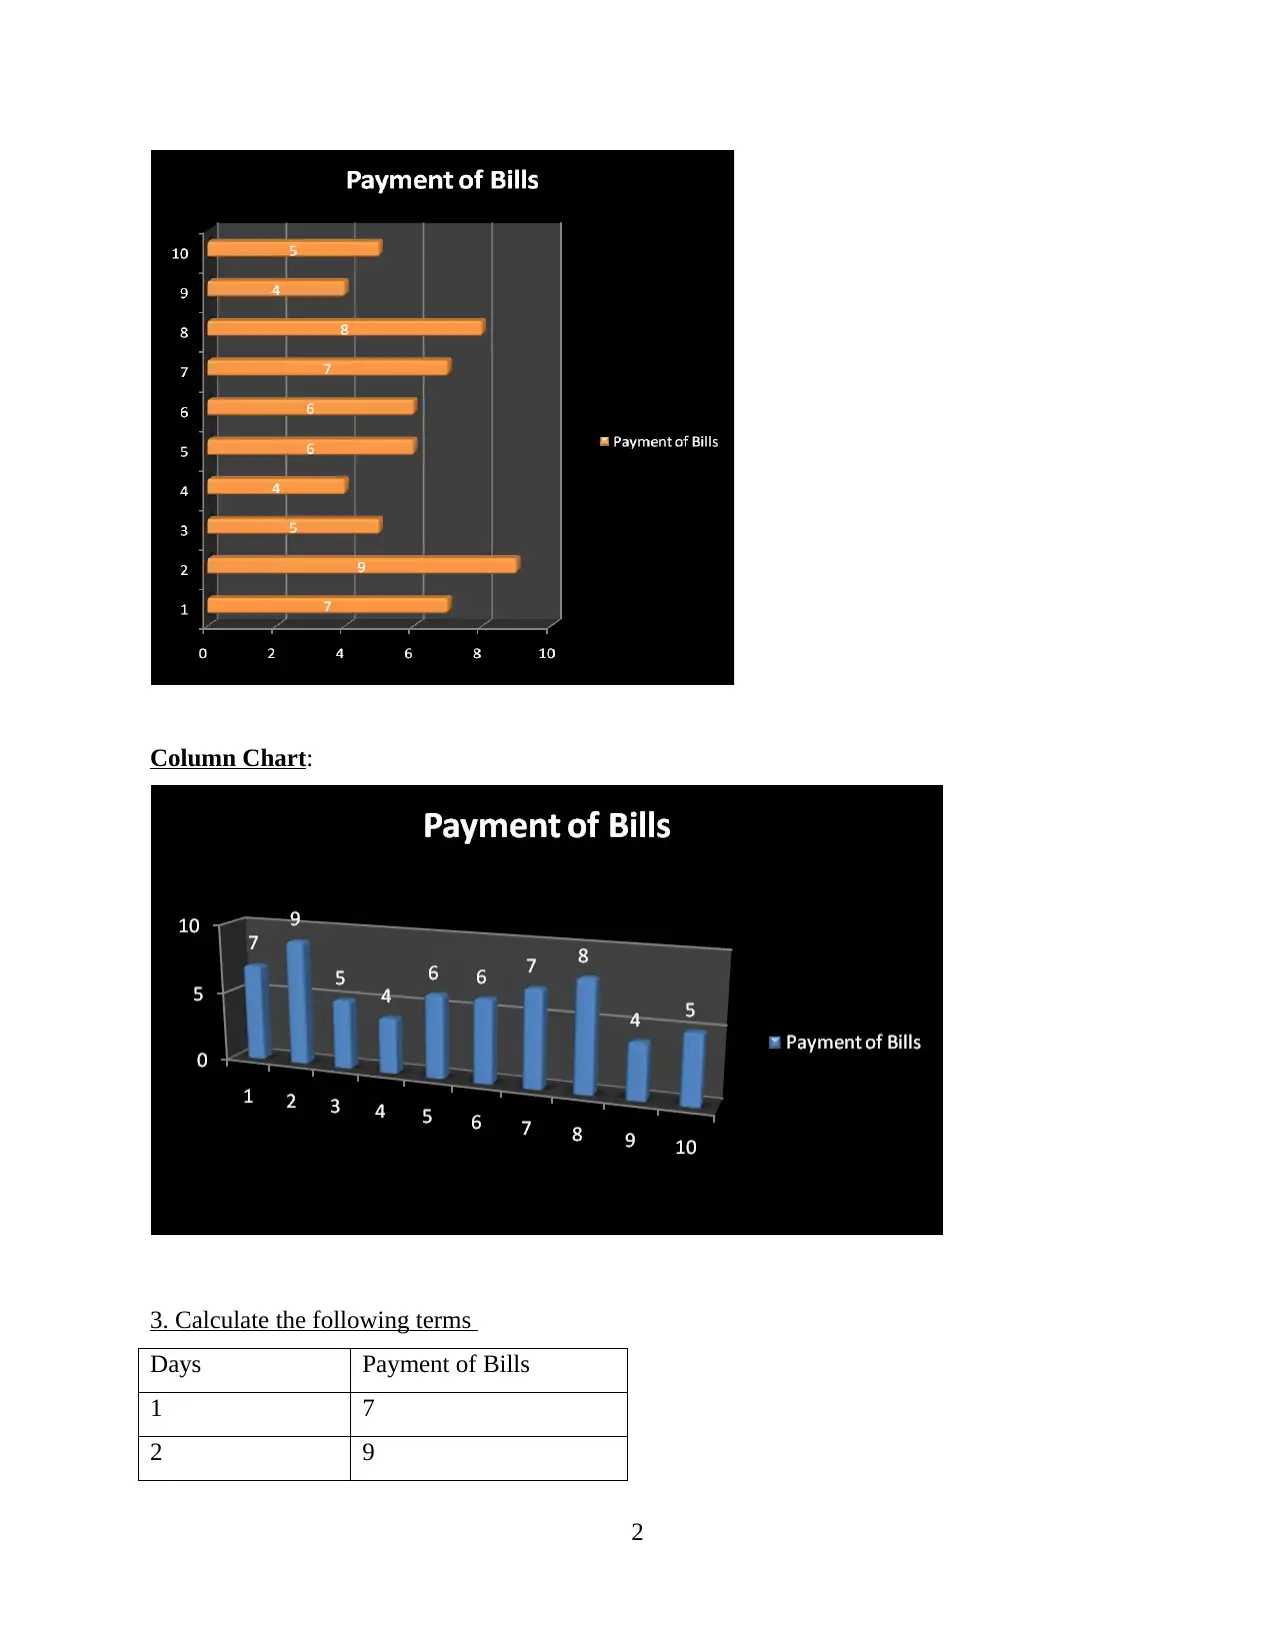
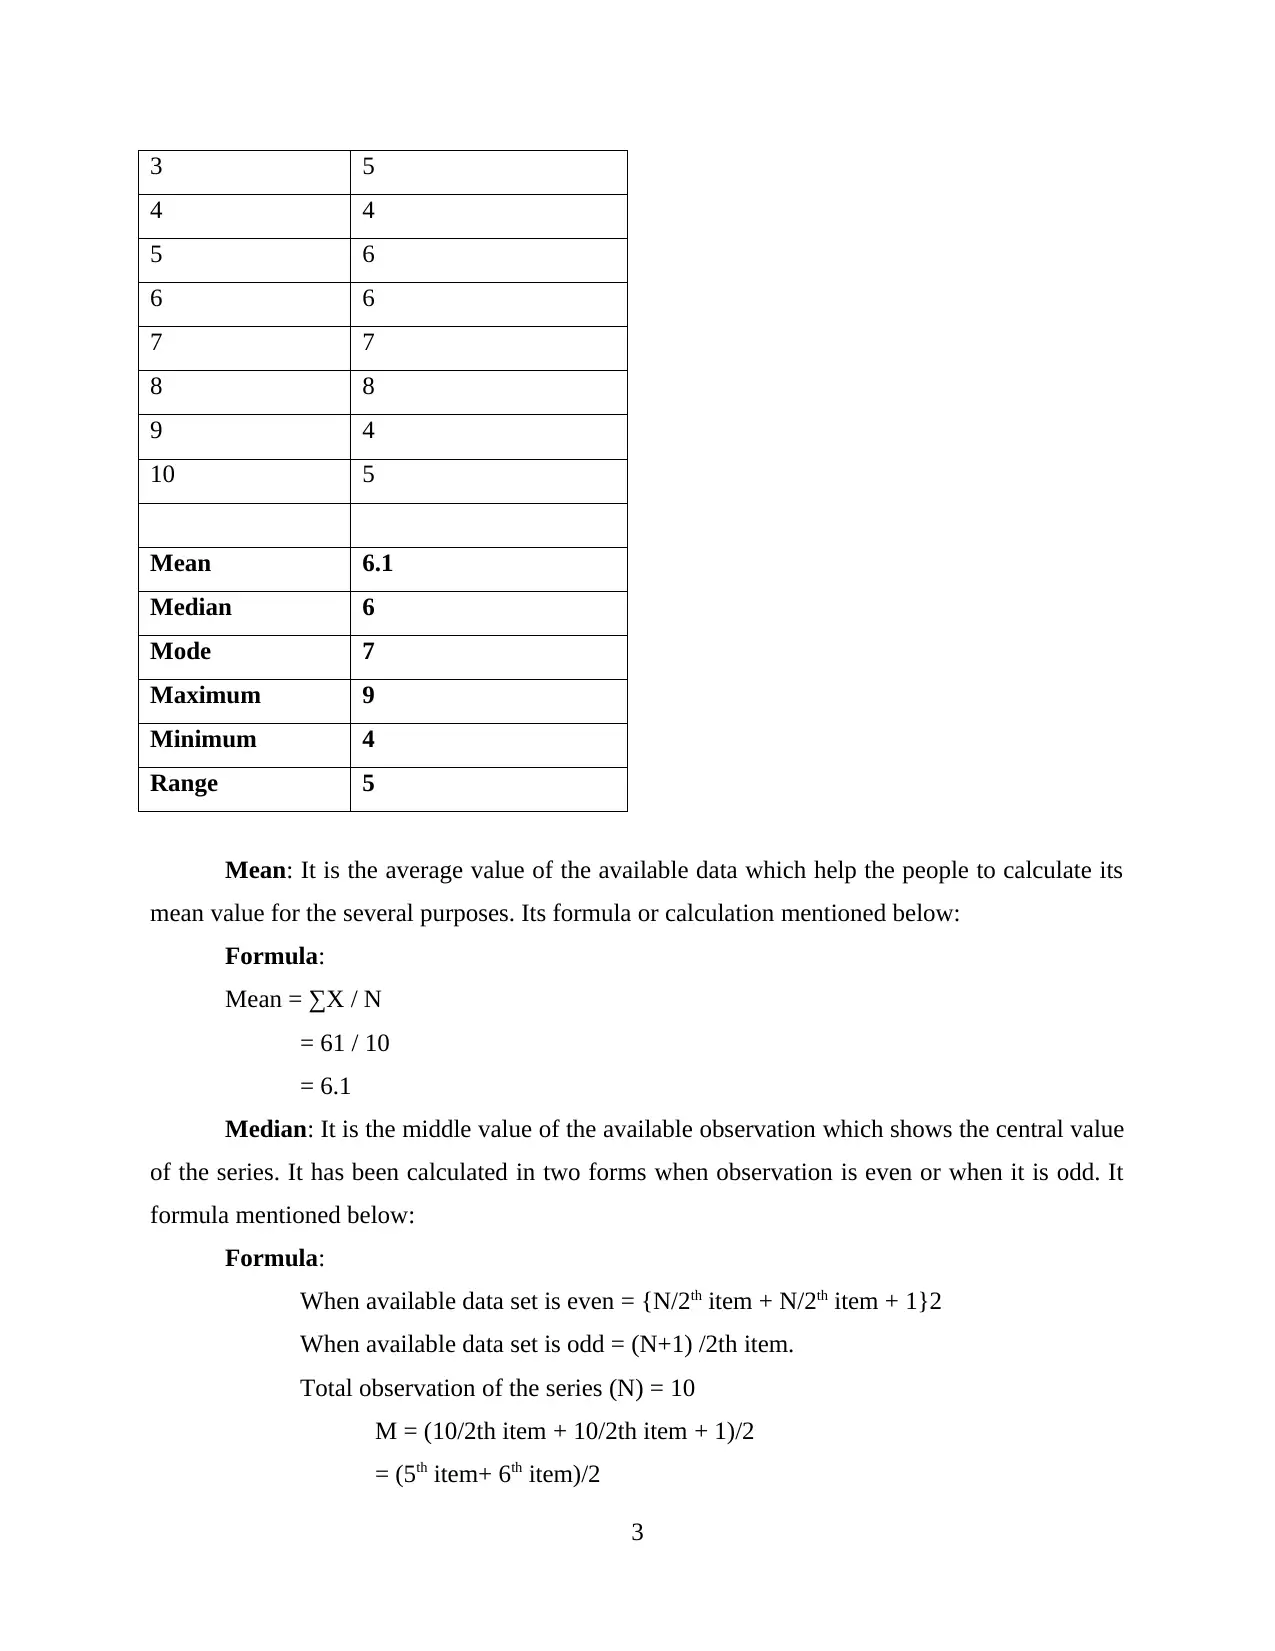
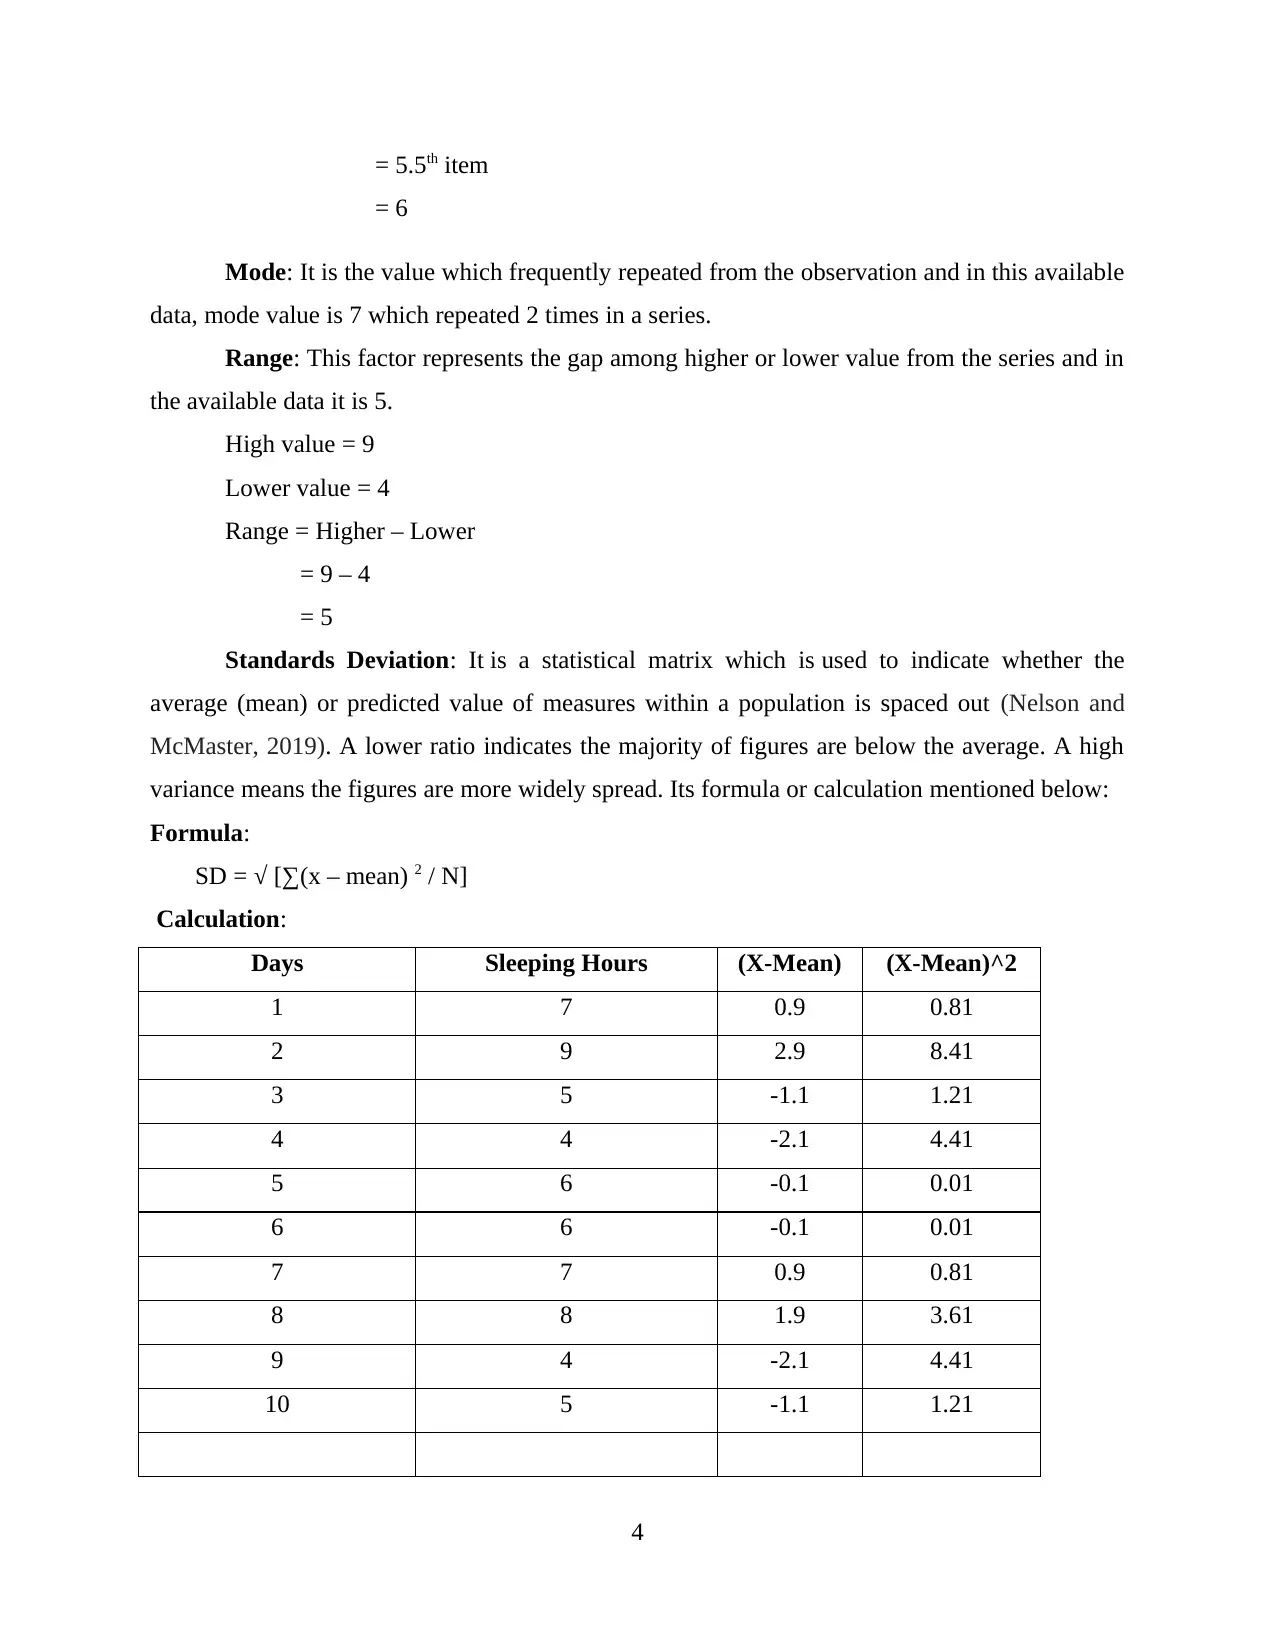
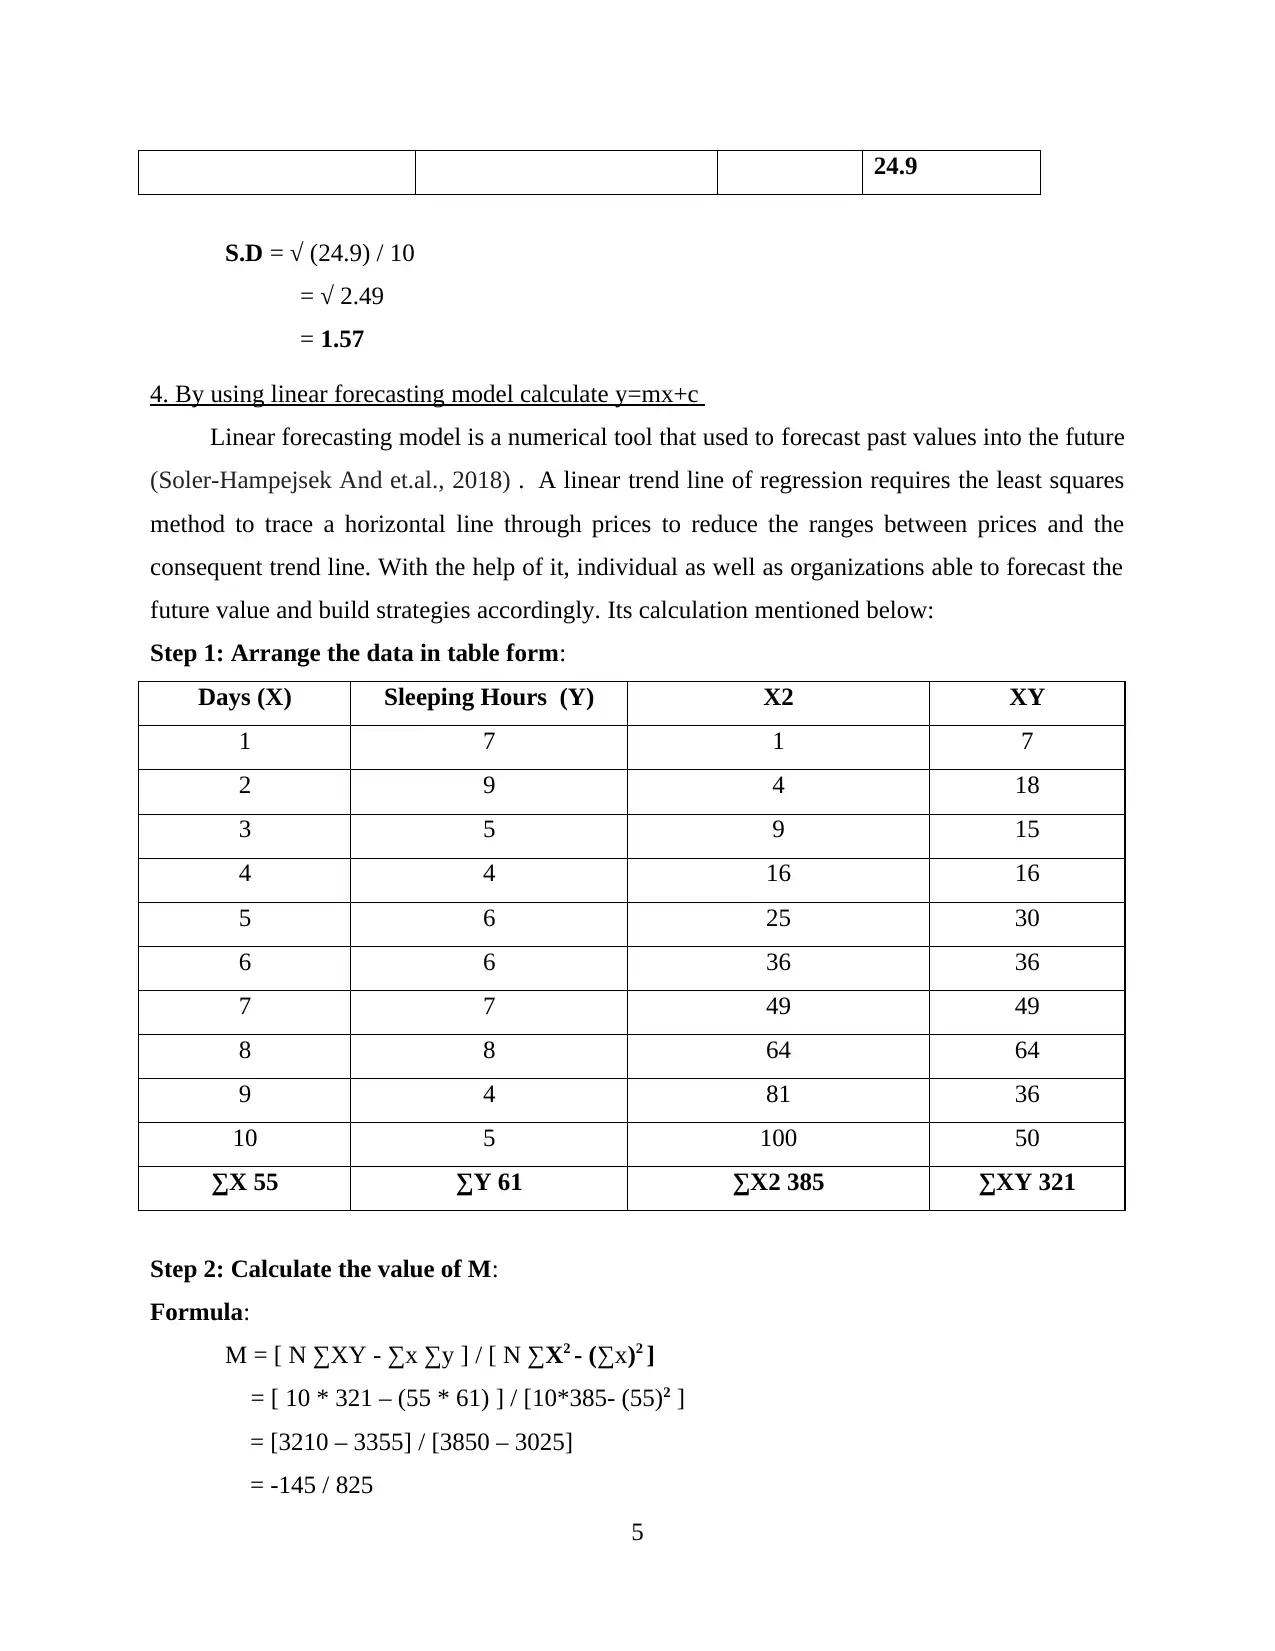
This assignment delves into the practical application of numeracy and data analysis techniques. It begins with the organization of data in a tabular format, followed by its representation through various chart forms, facilitating a visual understanding of the data trends. The core of the assignment involves calculating key statistical terms, including the mean, median, mode, range, and standard deviation, providing a comprehensive understanding of data distribution and central tendencies. Furthermore, the assignment explores the application of a linear forecasting model, enabling the prediction of future values based on historical data. This includes a step-by-step calculation of the model's parameters (m and c) and the subsequent forecasting of values for specific time points. The conclusion emphasizes the importance of data analysis in drawing informed insights and making strategic decisions, highlighting the practical applications of these techniques in various business contexts. The assignment uses a dataset of sleeping hours over ten consecutive days to illustrate these concepts, providing a tangible example of how these methods can be applied.
1 out of 9
Related Documents
![Data Analysis and Numeracy Assignment Solution - [Course Name]](/_next/image/?url=https%3A%2F%2Fdesklib.com%2Fmedia%2Fimages%2Fsi%2Fa7d85ae2b1bb4280b388902c677b7f7e.jpg&w=256&q=75)


Your All-in-One AI-Powered Toolkit for Academic Success.
+13062052269
info@desklib.com
Available 24*7 on WhatsApp / Email
![[object Object]](/_next/static/media/star-bottom.7253800d.svg)
Copyright © 2020–2026 A2Z Services. All Rights Reserved. Developed and managed by ZUCOL.