Data Analysis Report: Calculating Sleep Hours and Forecasting Trends
VerifiedAdded on 2023/01/11
|12
|1661
|40
Report
AI Summary
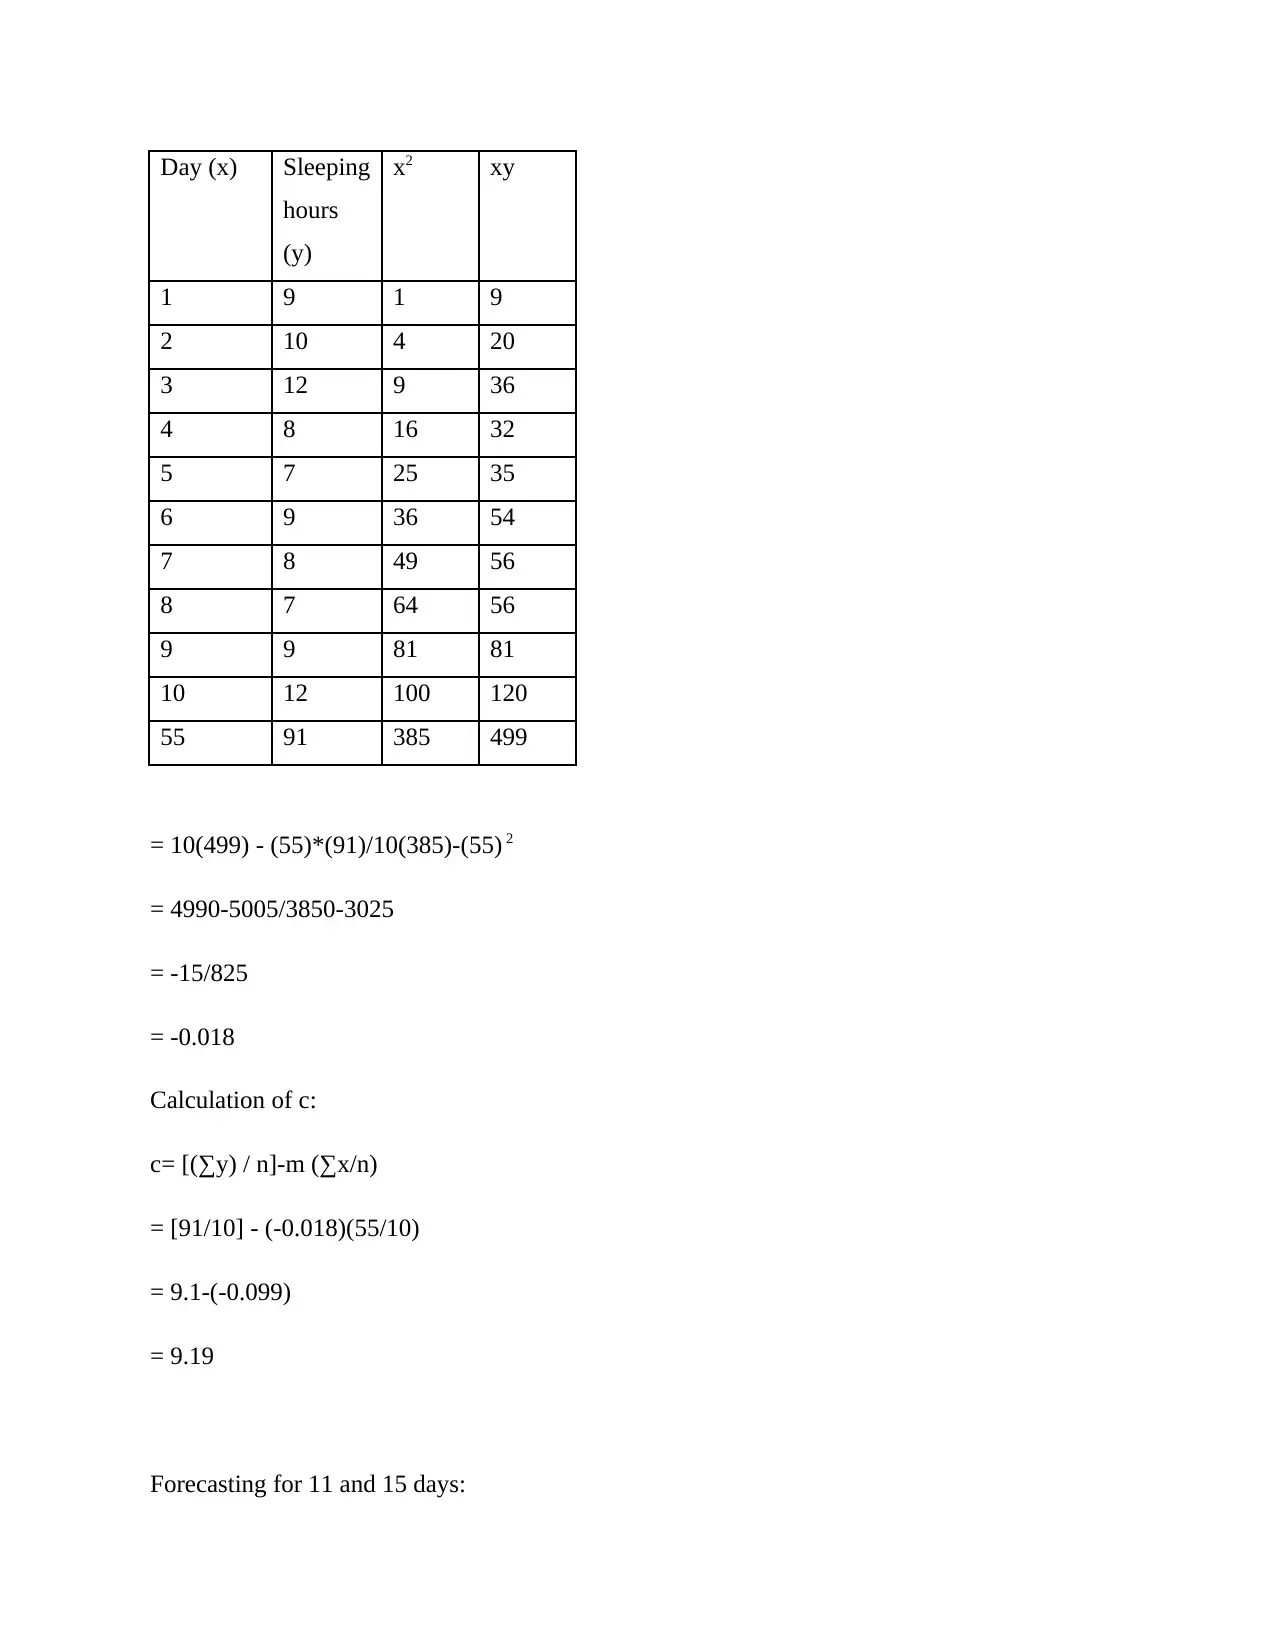
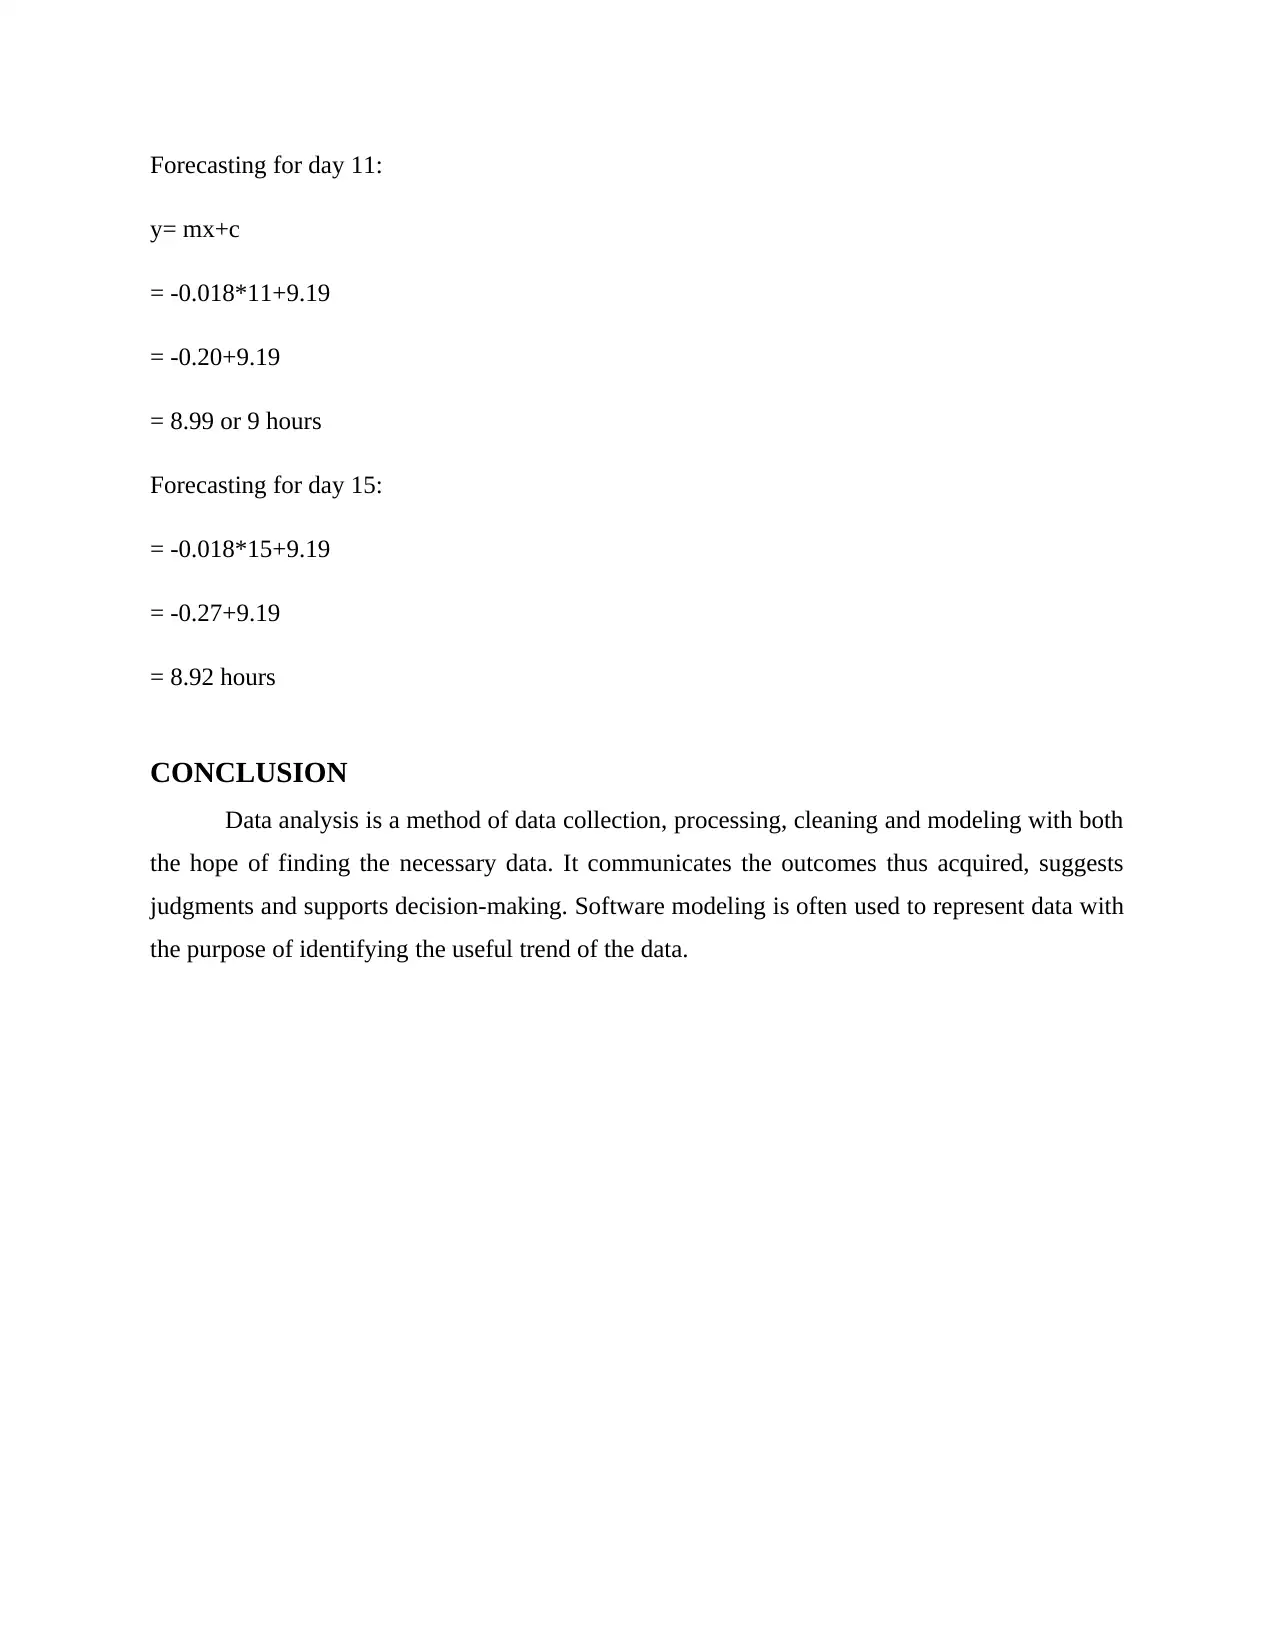
This report presents a comprehensive data analysis of sleep patterns over ten consecutive days. It begins with data arrangement in a table format, followed by the use of line charts and scatter plots to visualize the data. The main body of the report includes detailed calculations of key statistical measures such as mean, mode, median, range, and standard deviation. The report also demonstrates linear forecasting to predict sleep hours for future days. Formulas and step-by-step calculations are provided. The conclusion summarizes the findings and emphasizes the importance of data analysis in informed decision-making. The report references relevant sources and provides a clear and structured approach to the analysis of the sleep data.

1 out of 12
Related Documents


Your All-in-One AI-Powered Toolkit for Academic Success.
+13062052269
info@desklib.com
Available 24*7 on WhatsApp / Email
![[object Object]](/_next/static/media/star-bottom.7253800d.svg)
Copyright © 2020–2026 A2Z Services. All Rights Reserved. Developed and managed by ZUCOL.