Numeracy and Data Analysis
VerifiedAdded on 2022/12/28
|11
|1528
|59
AI Summary
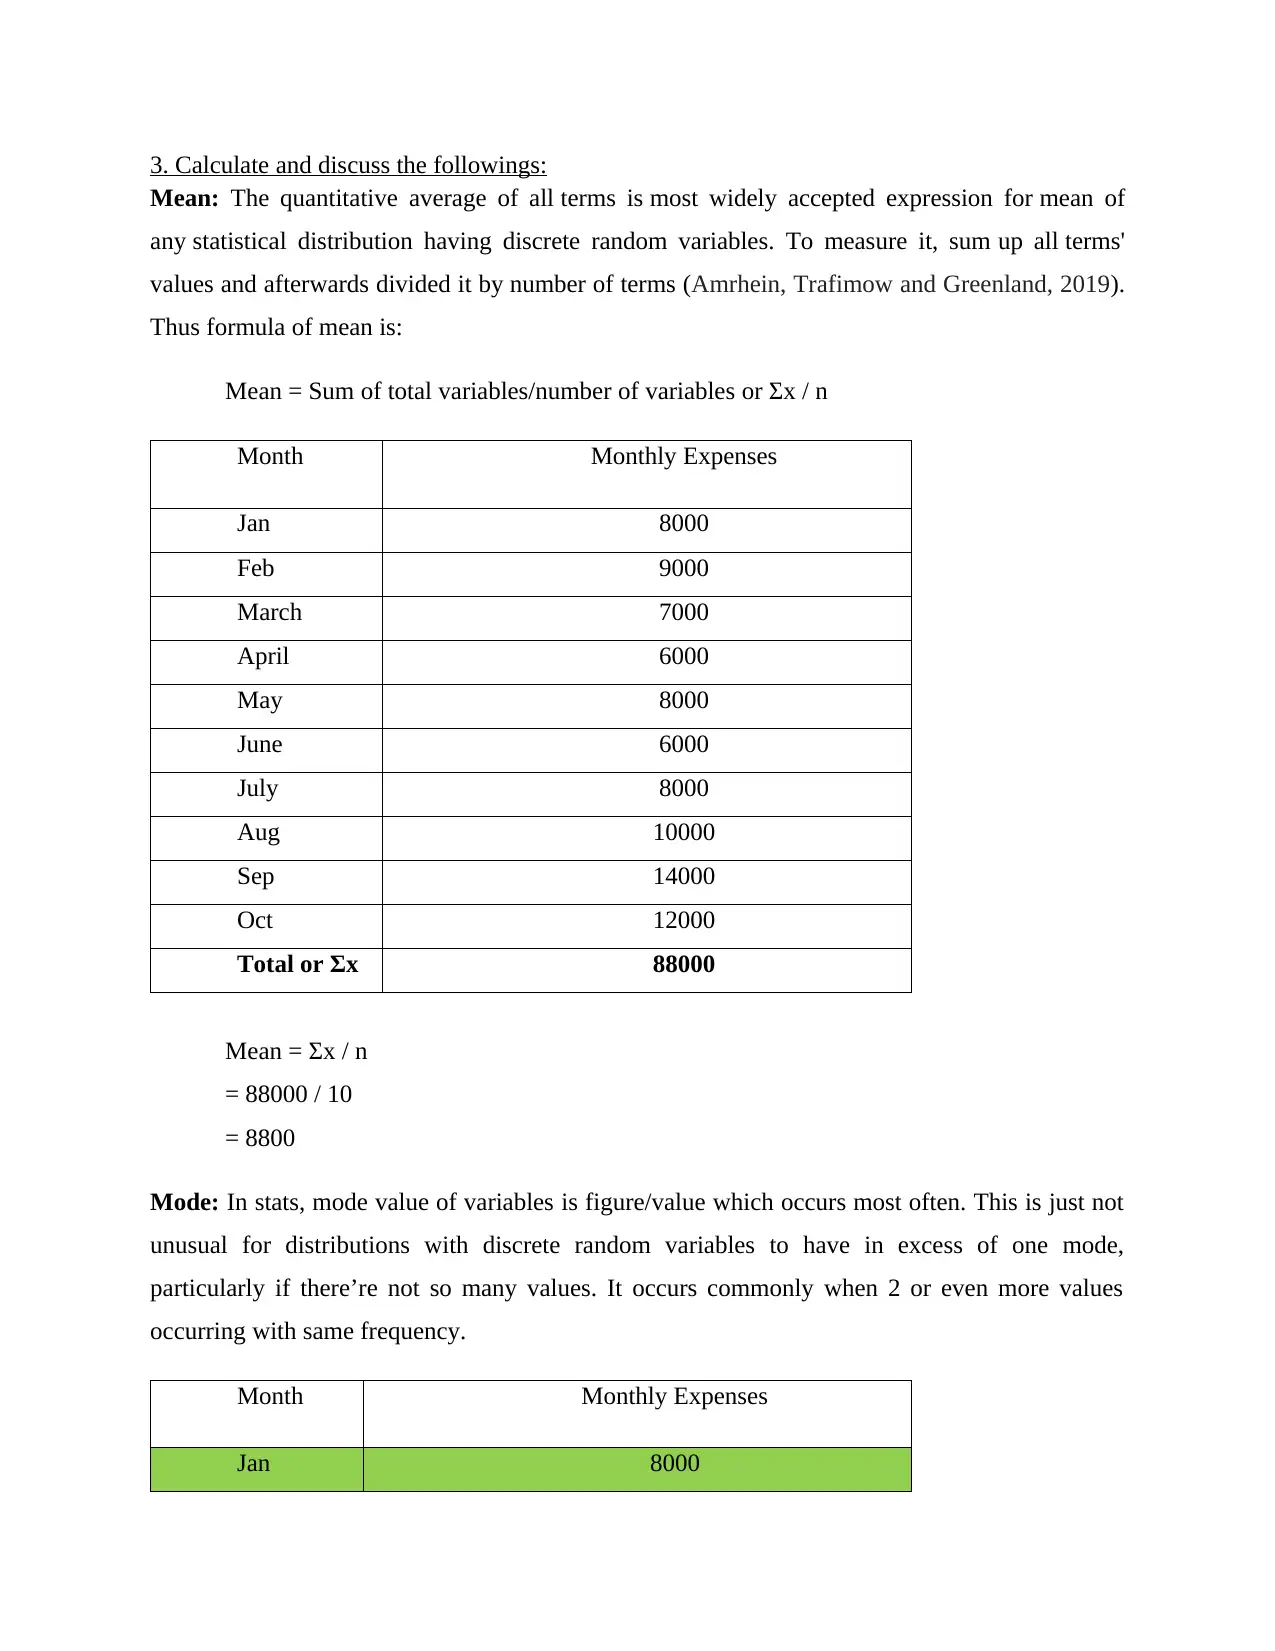
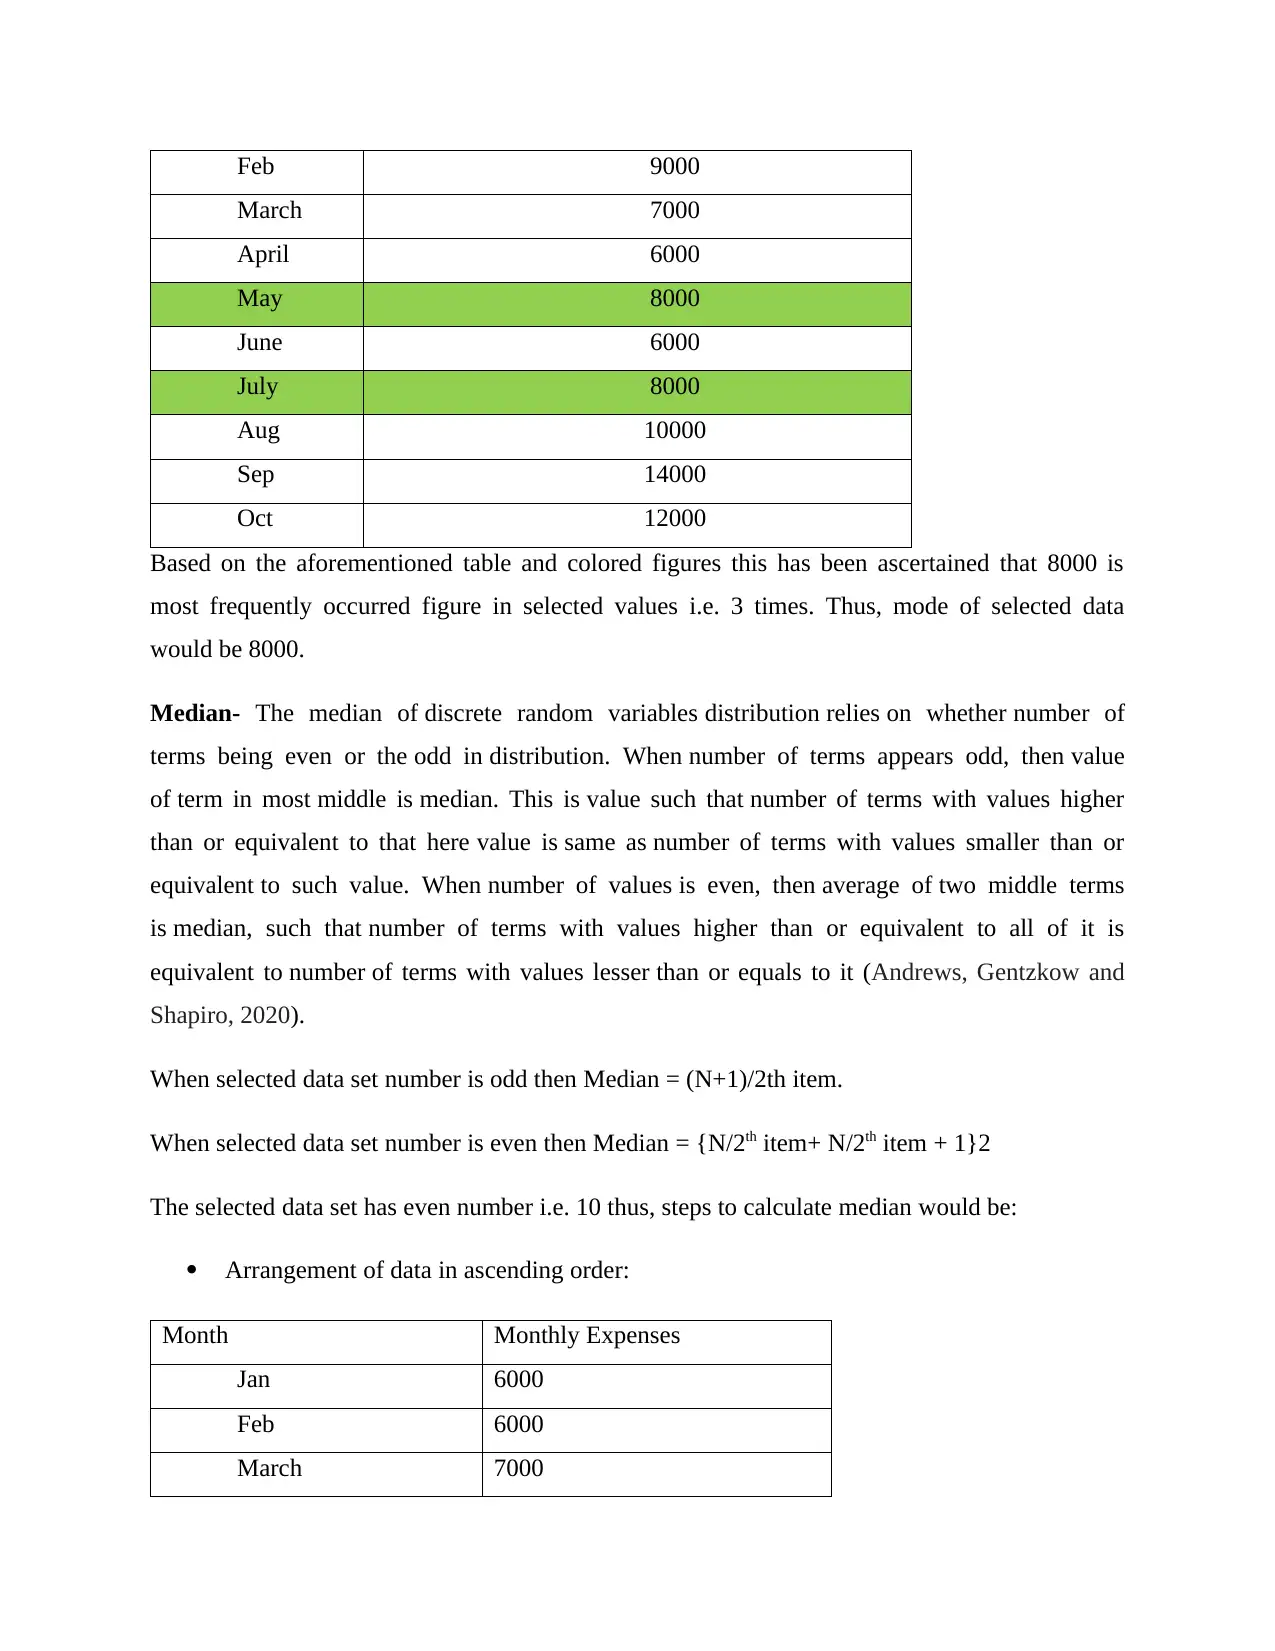
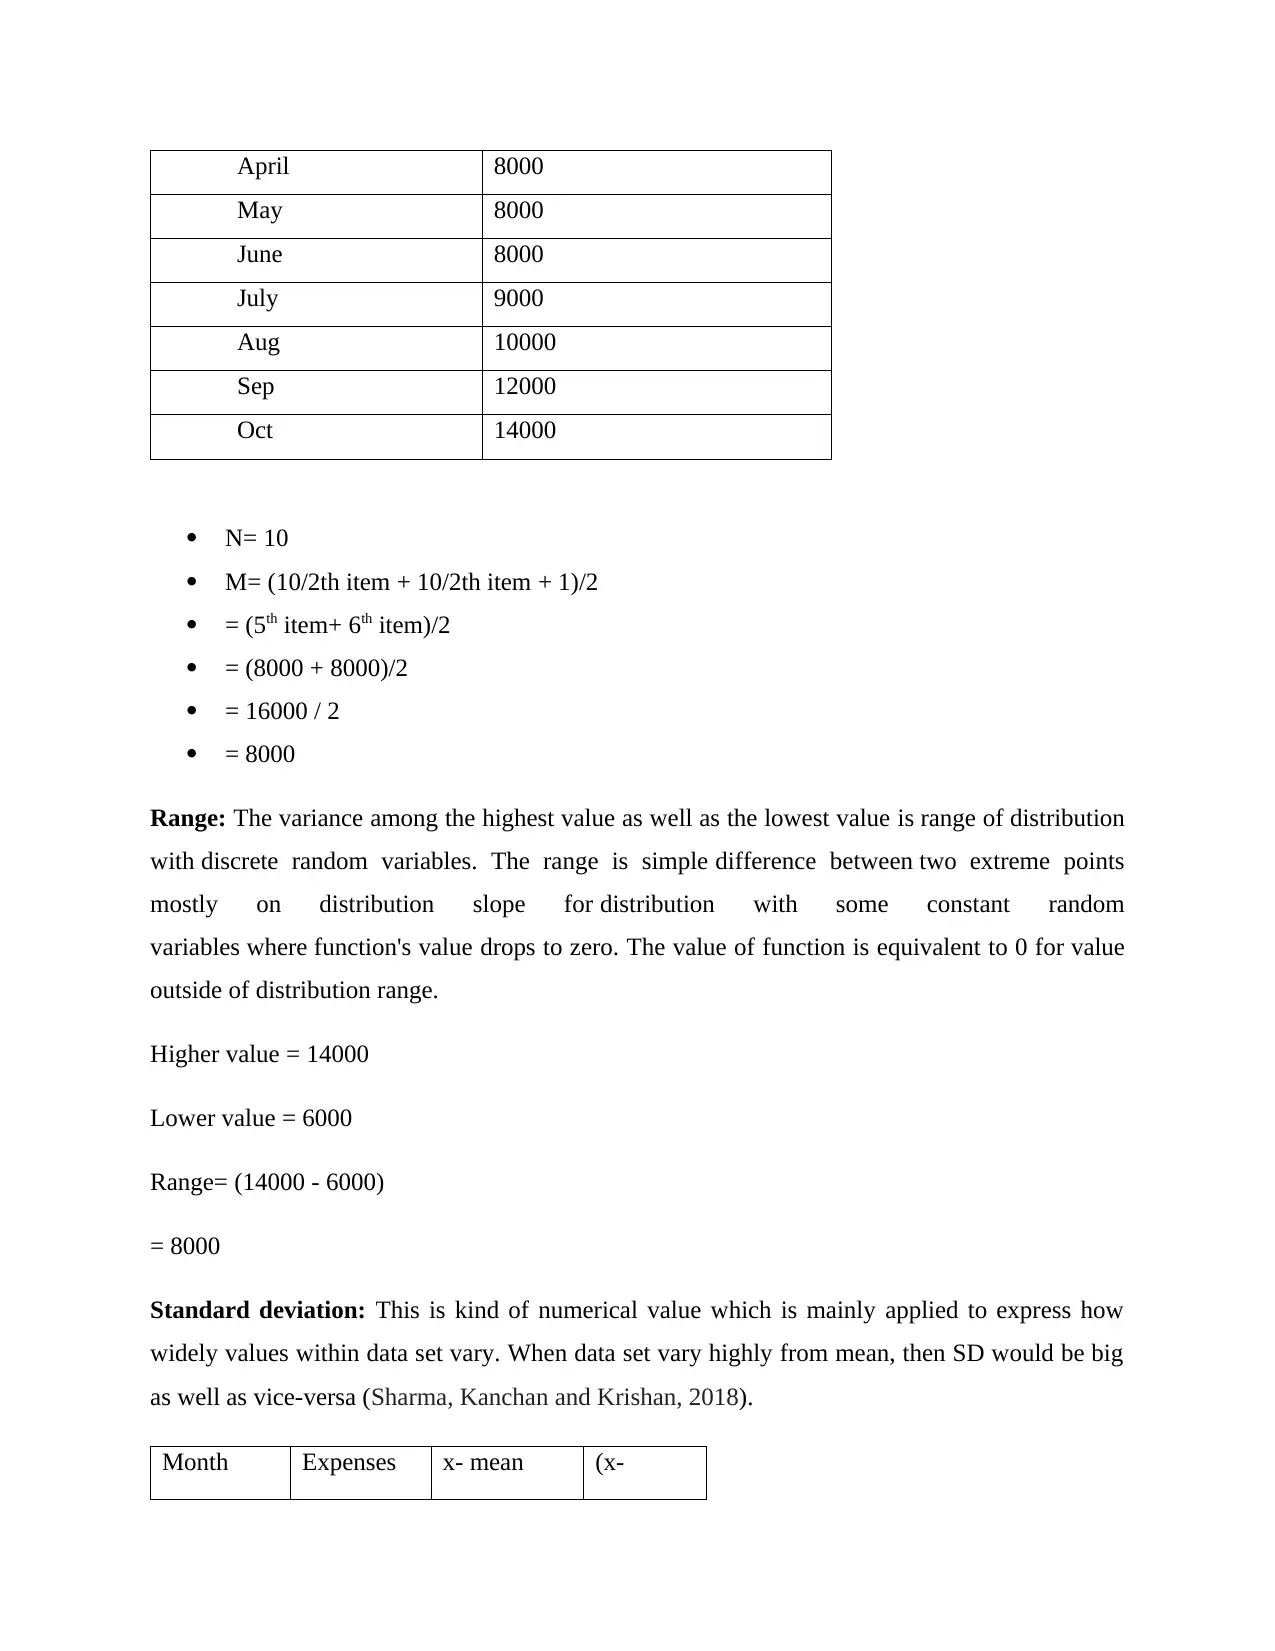
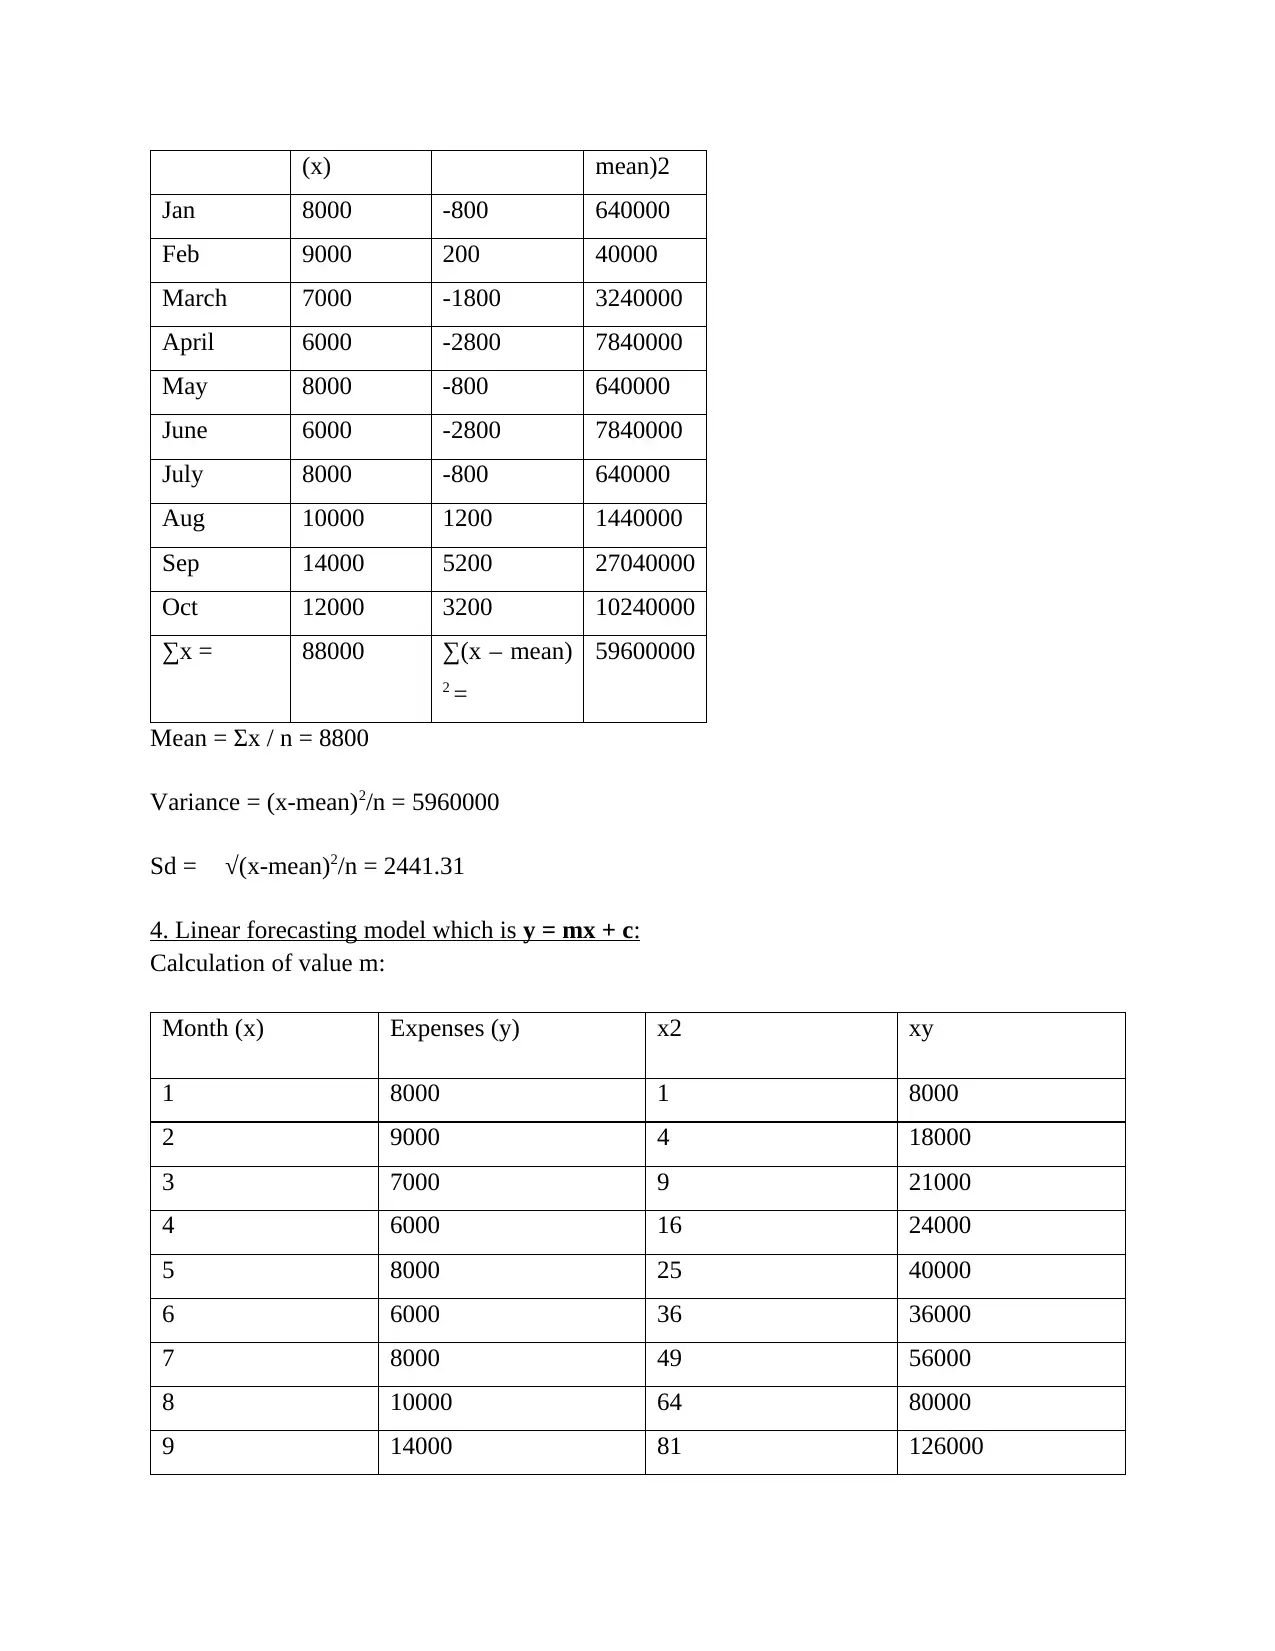
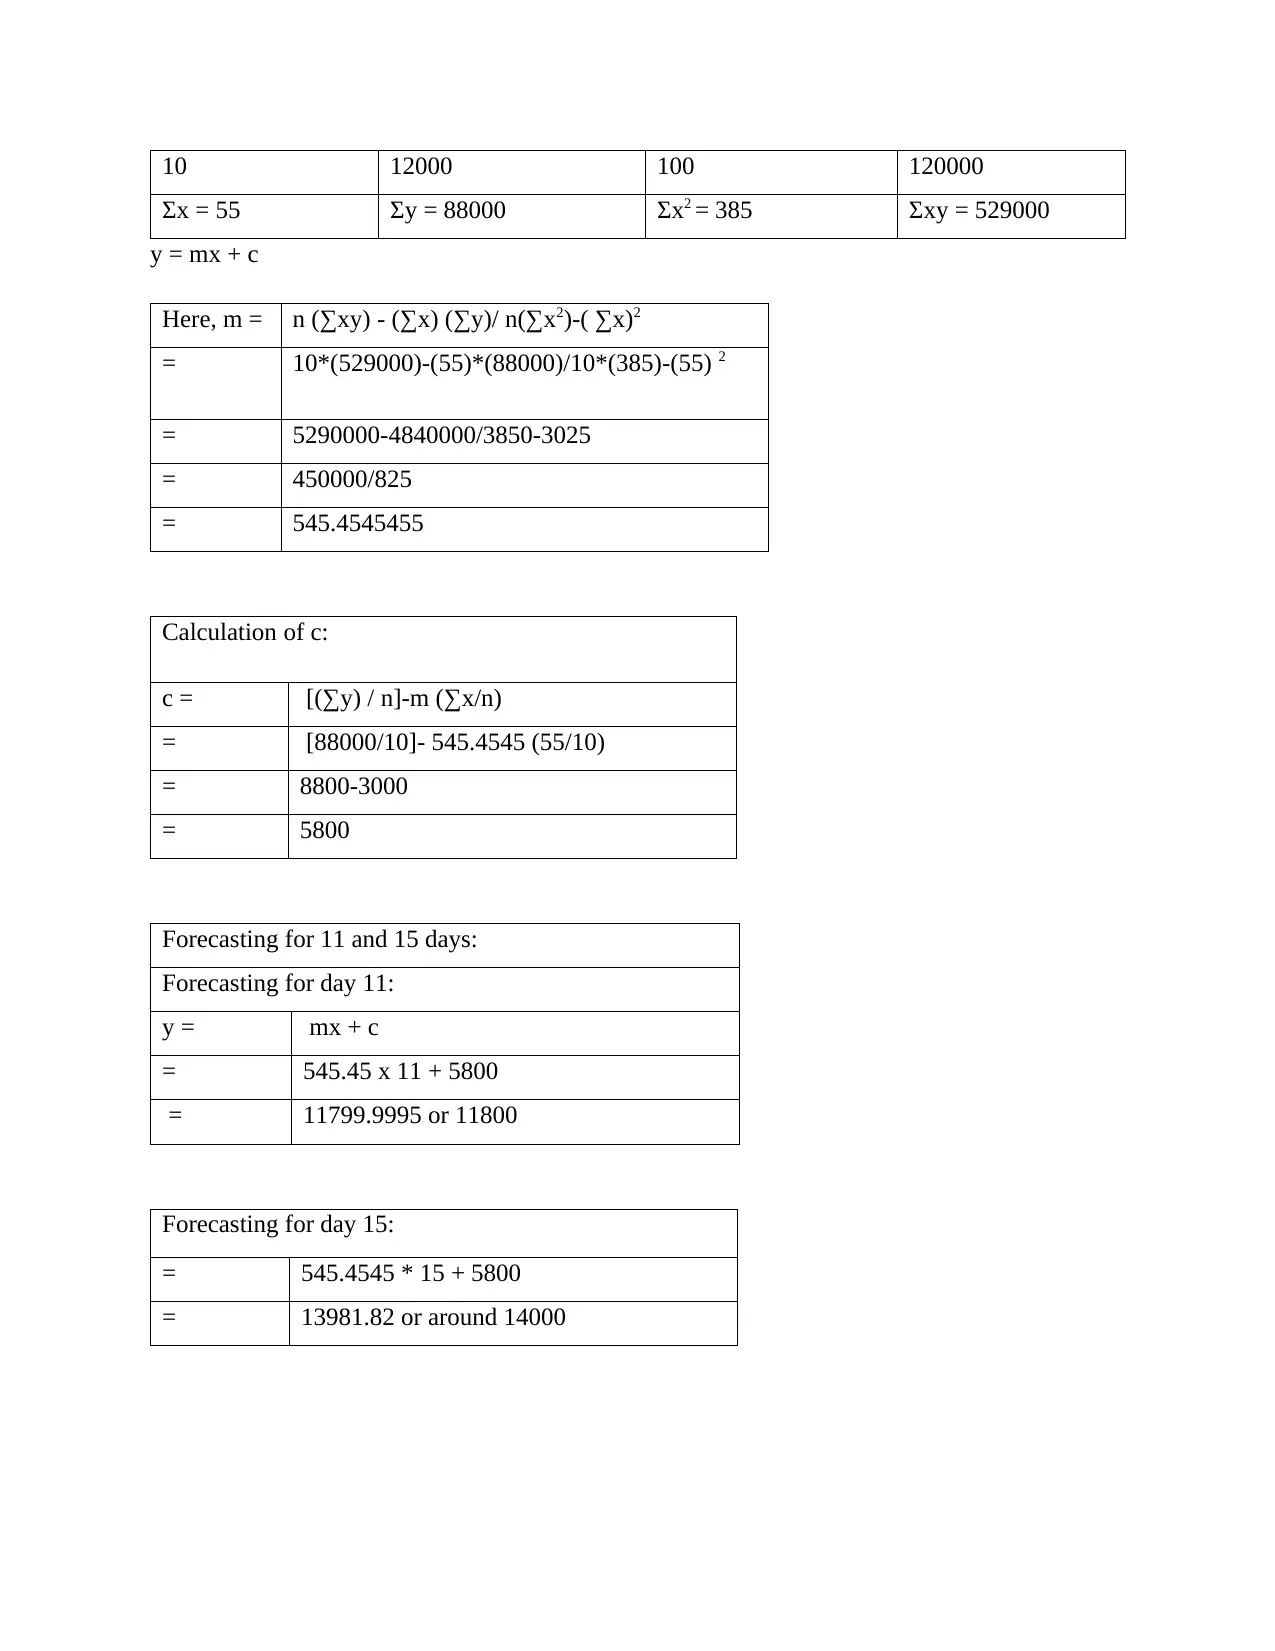
This document discusses numeracy and data analysis, covering topics such as arranging data in table format, presenting data with charts, calculating mean, mode, median, range, and standard deviation, and using linear forecasting models. It also provides examples and explanations for each concept. The document is relevant for students studying data analysis or anyone interested in understanding and applying statistical concepts.
Contribute Materials
Your contribution can guide someone’s learning journey. Share your
documents today.
1 out of 11
Related Documents


Your All-in-One AI-Powered Toolkit for Academic Success.
+13062052269
info@desklib.com
Available 24*7 on WhatsApp / Email
![[object Object]](/_next/static/media/star-bottom.7253800d.svg)
© 2024 | Zucol Services PVT LTD | All rights reserved.