Numeracy and Data Analysis Report: Forecasting Phone Calls Data
VerifiedAdded on 2023/01/09
|11
|1555
|93
Report
AI Summary
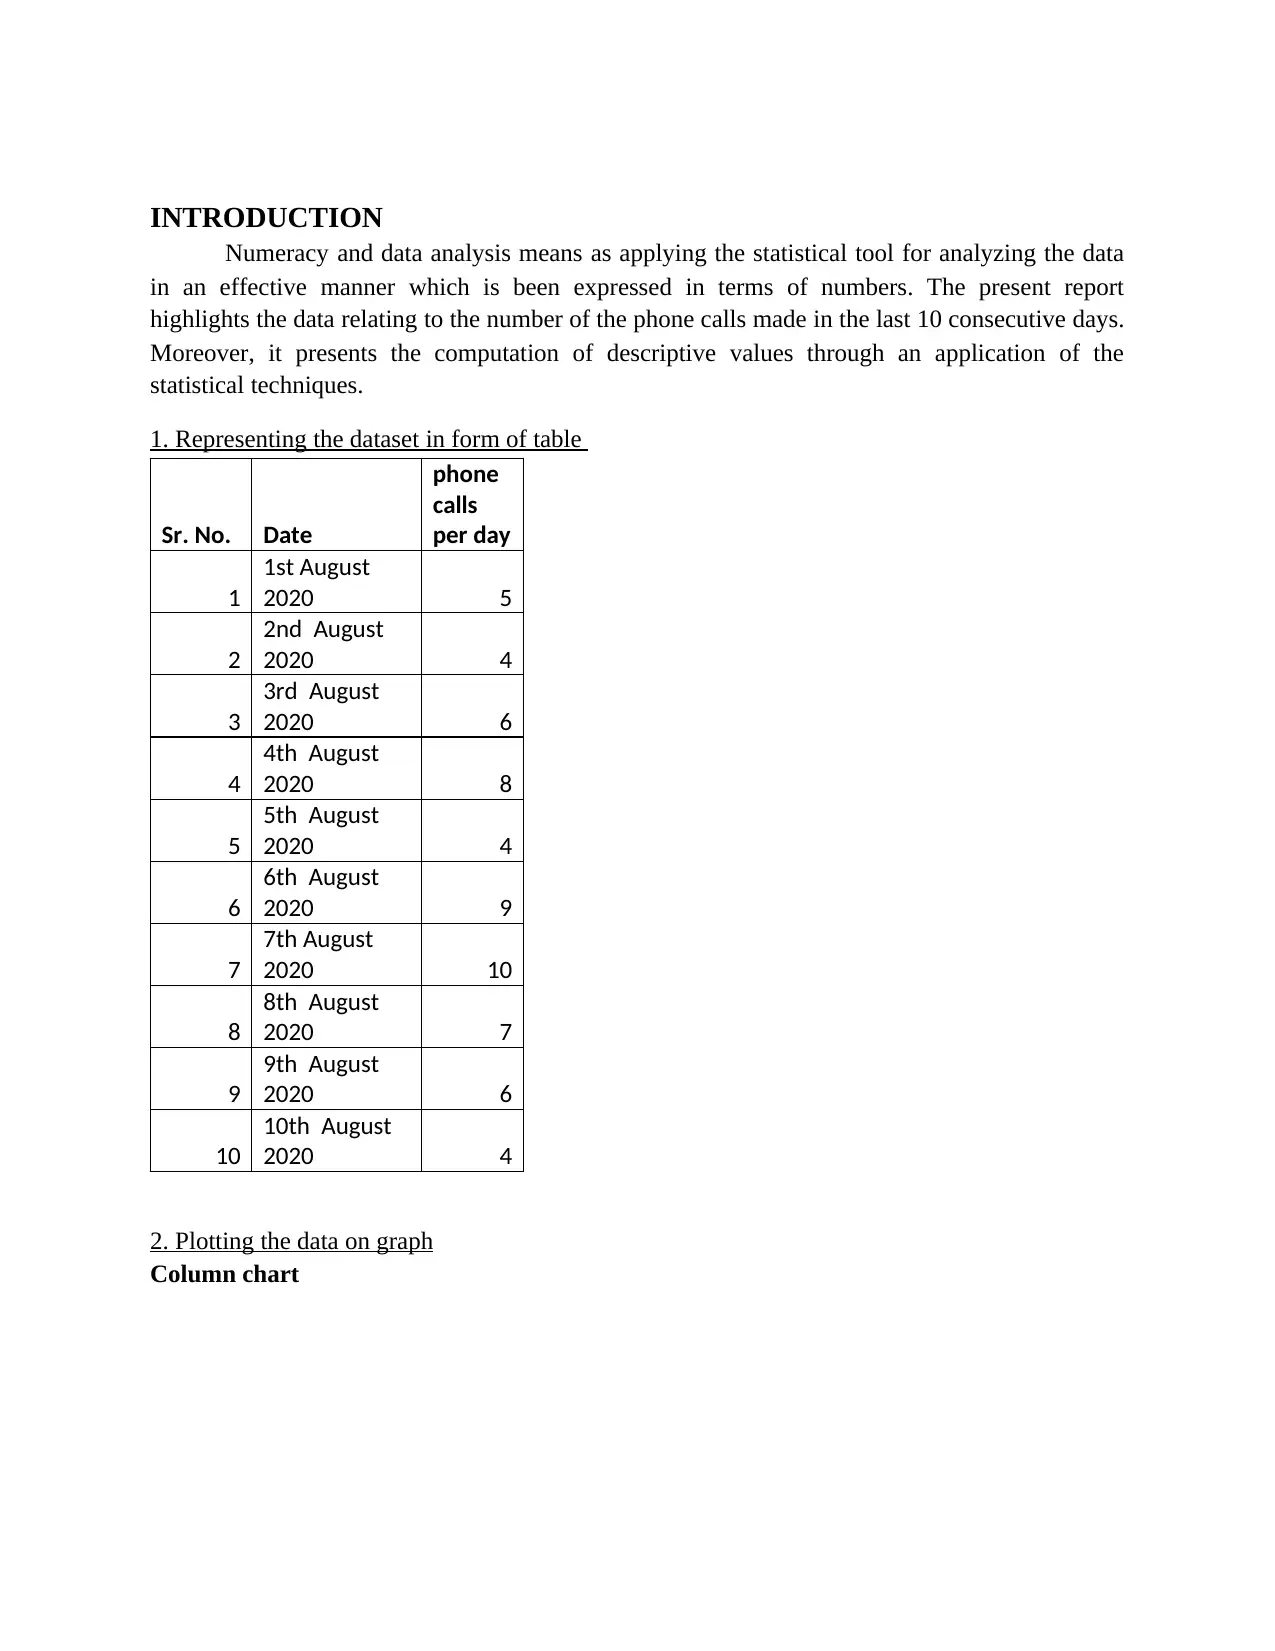
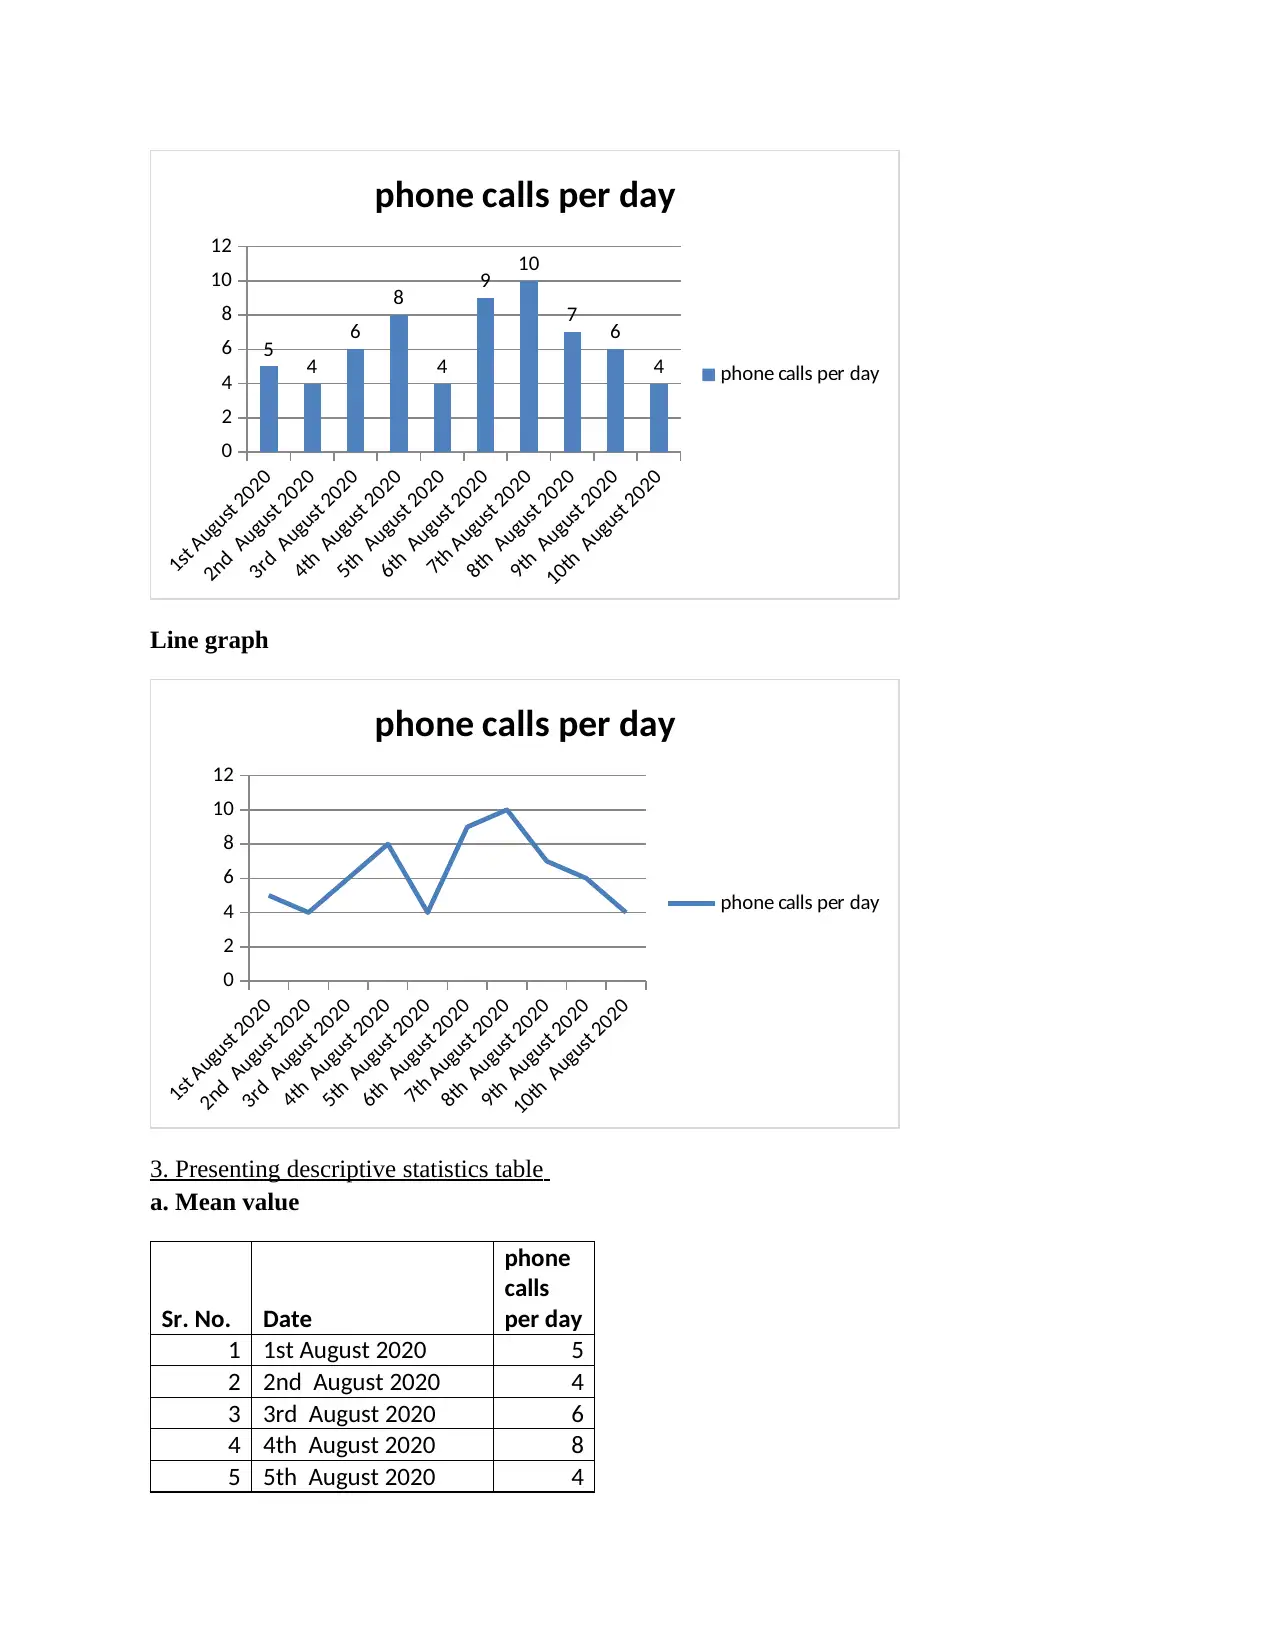
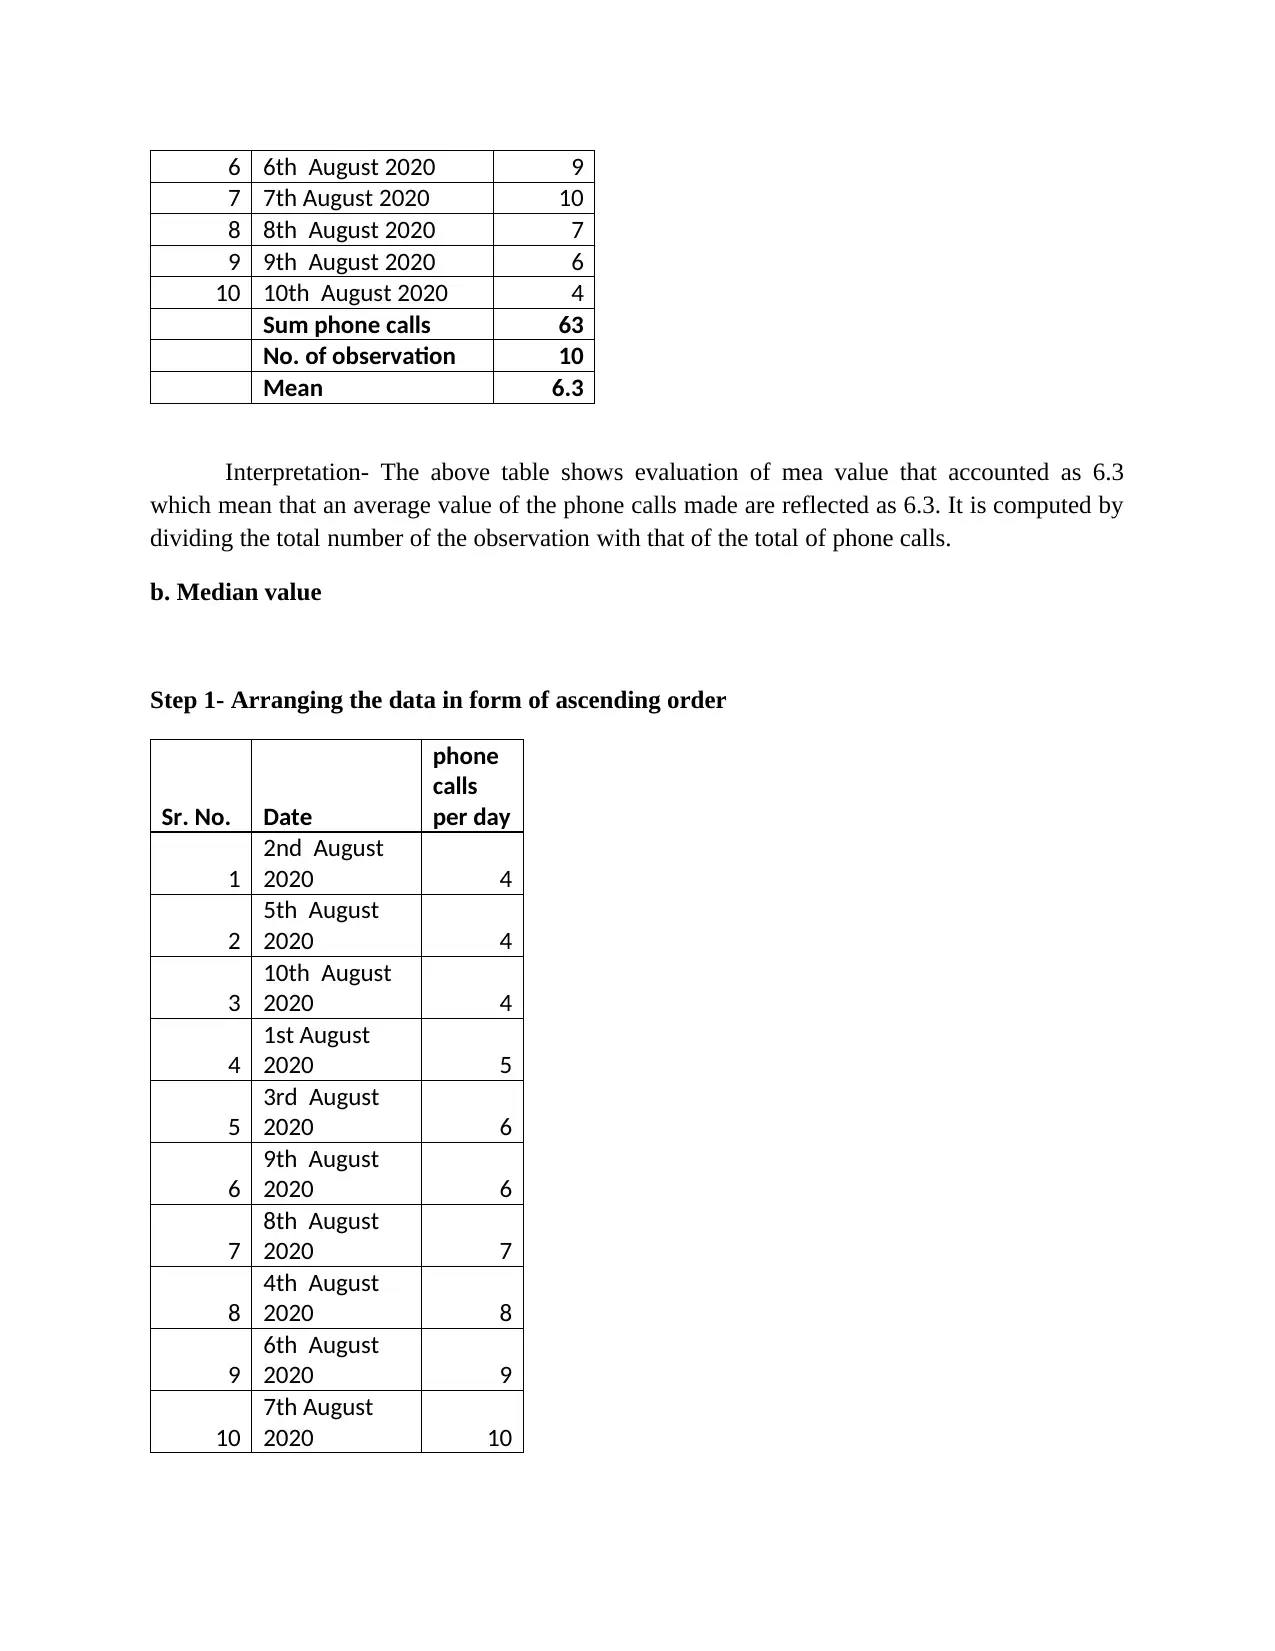
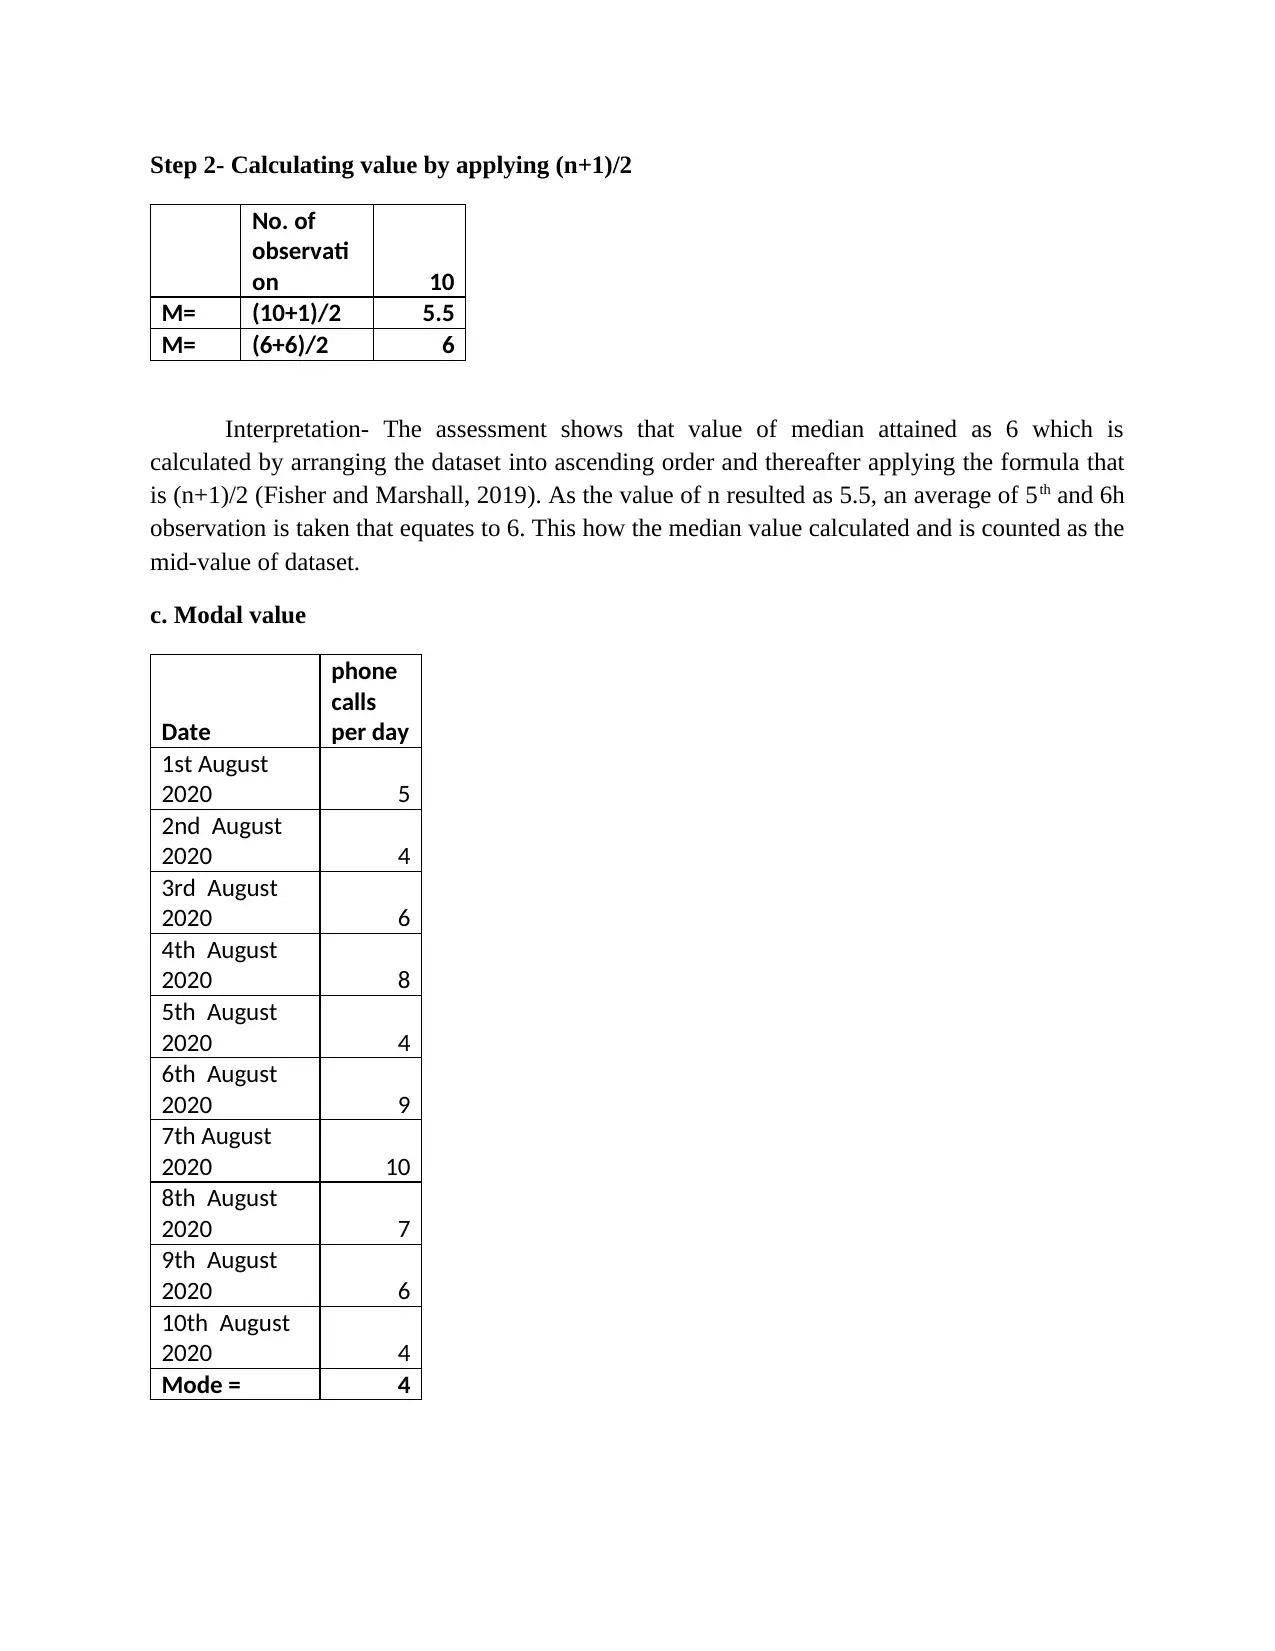
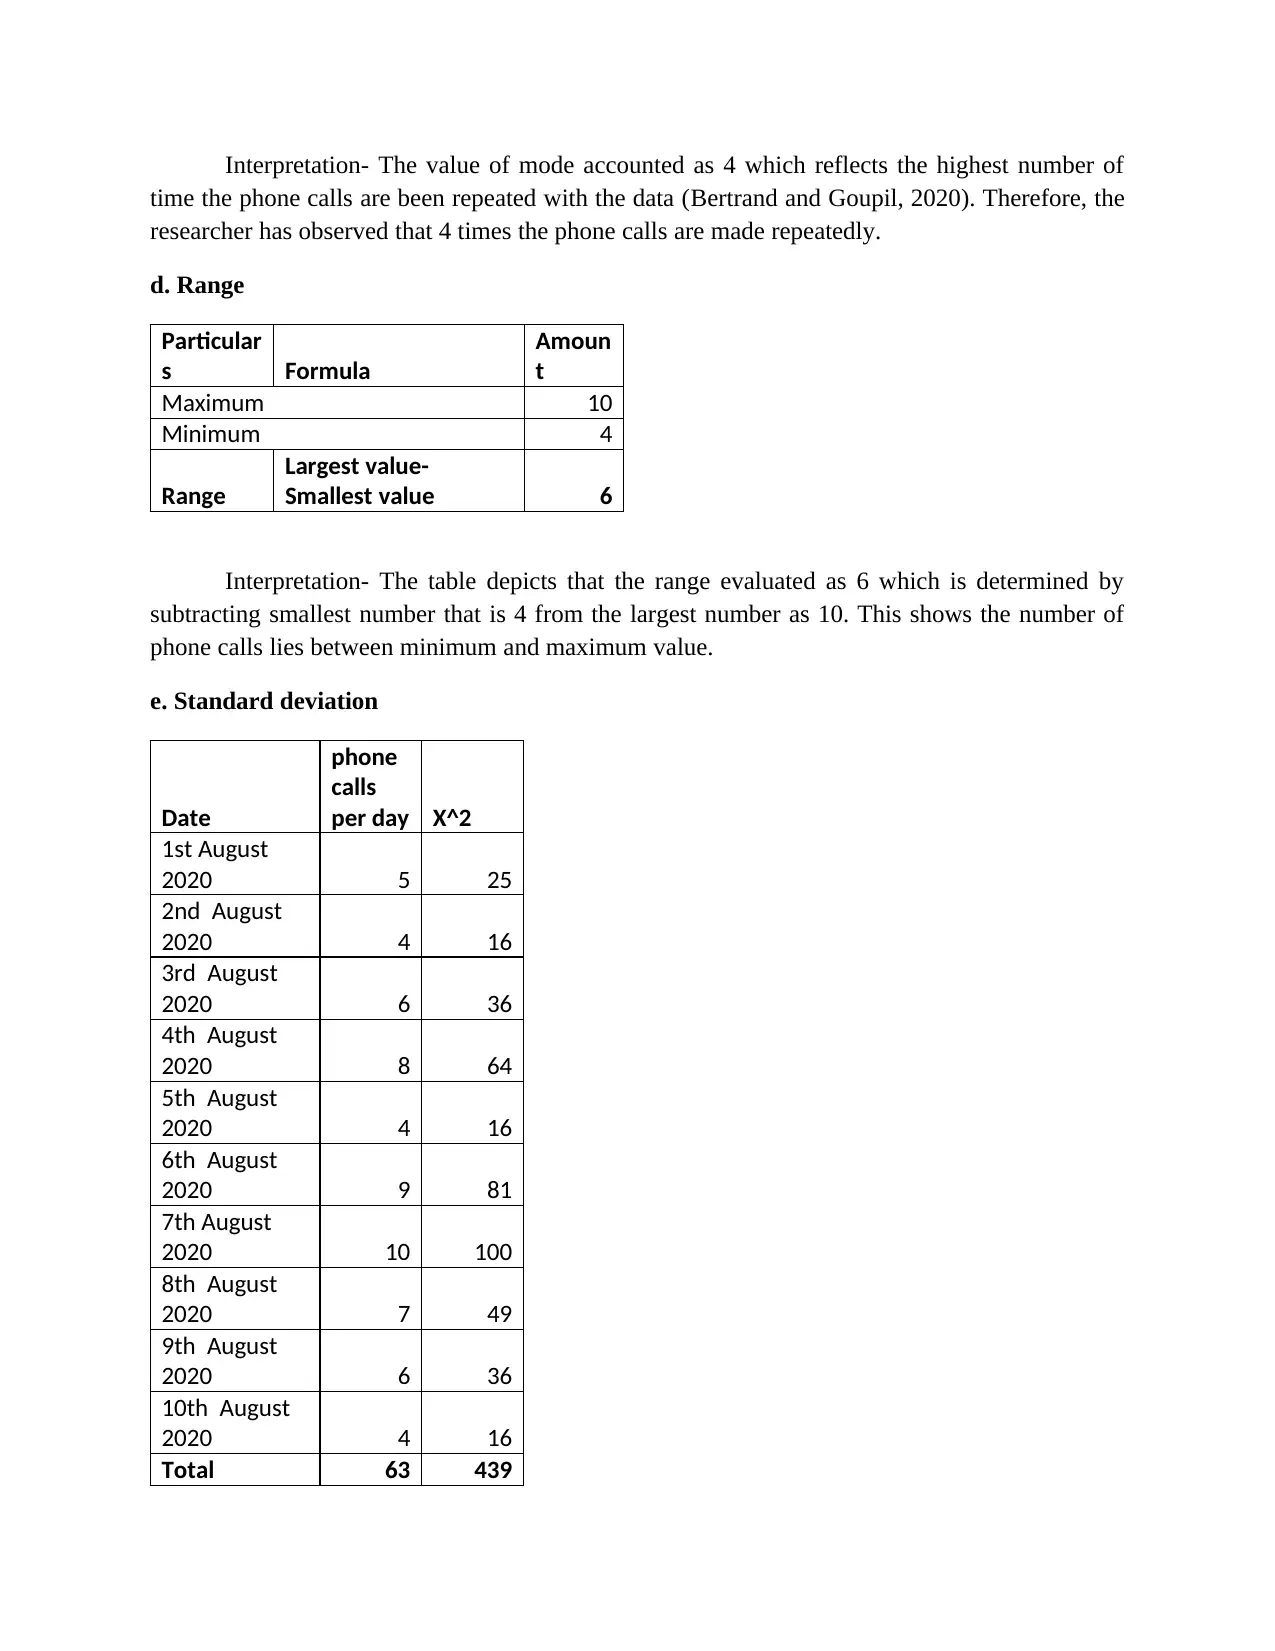
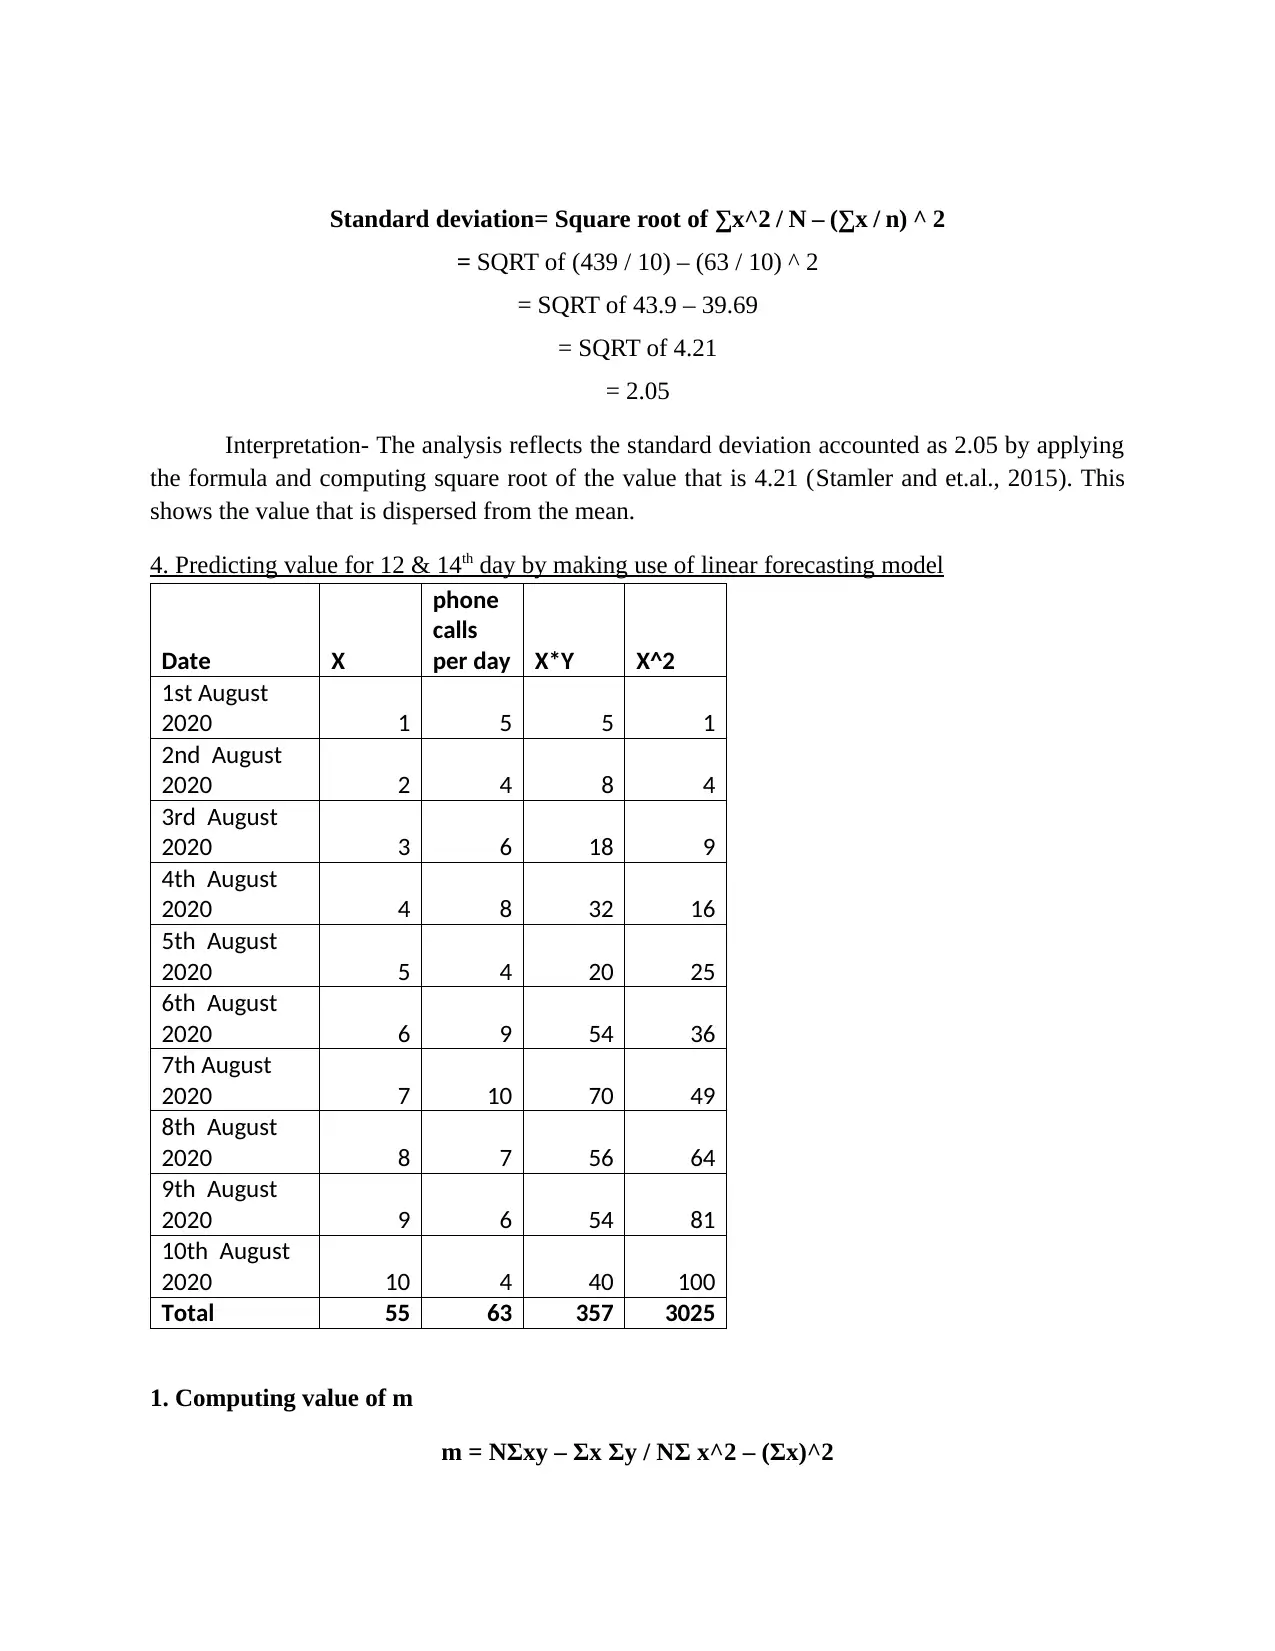
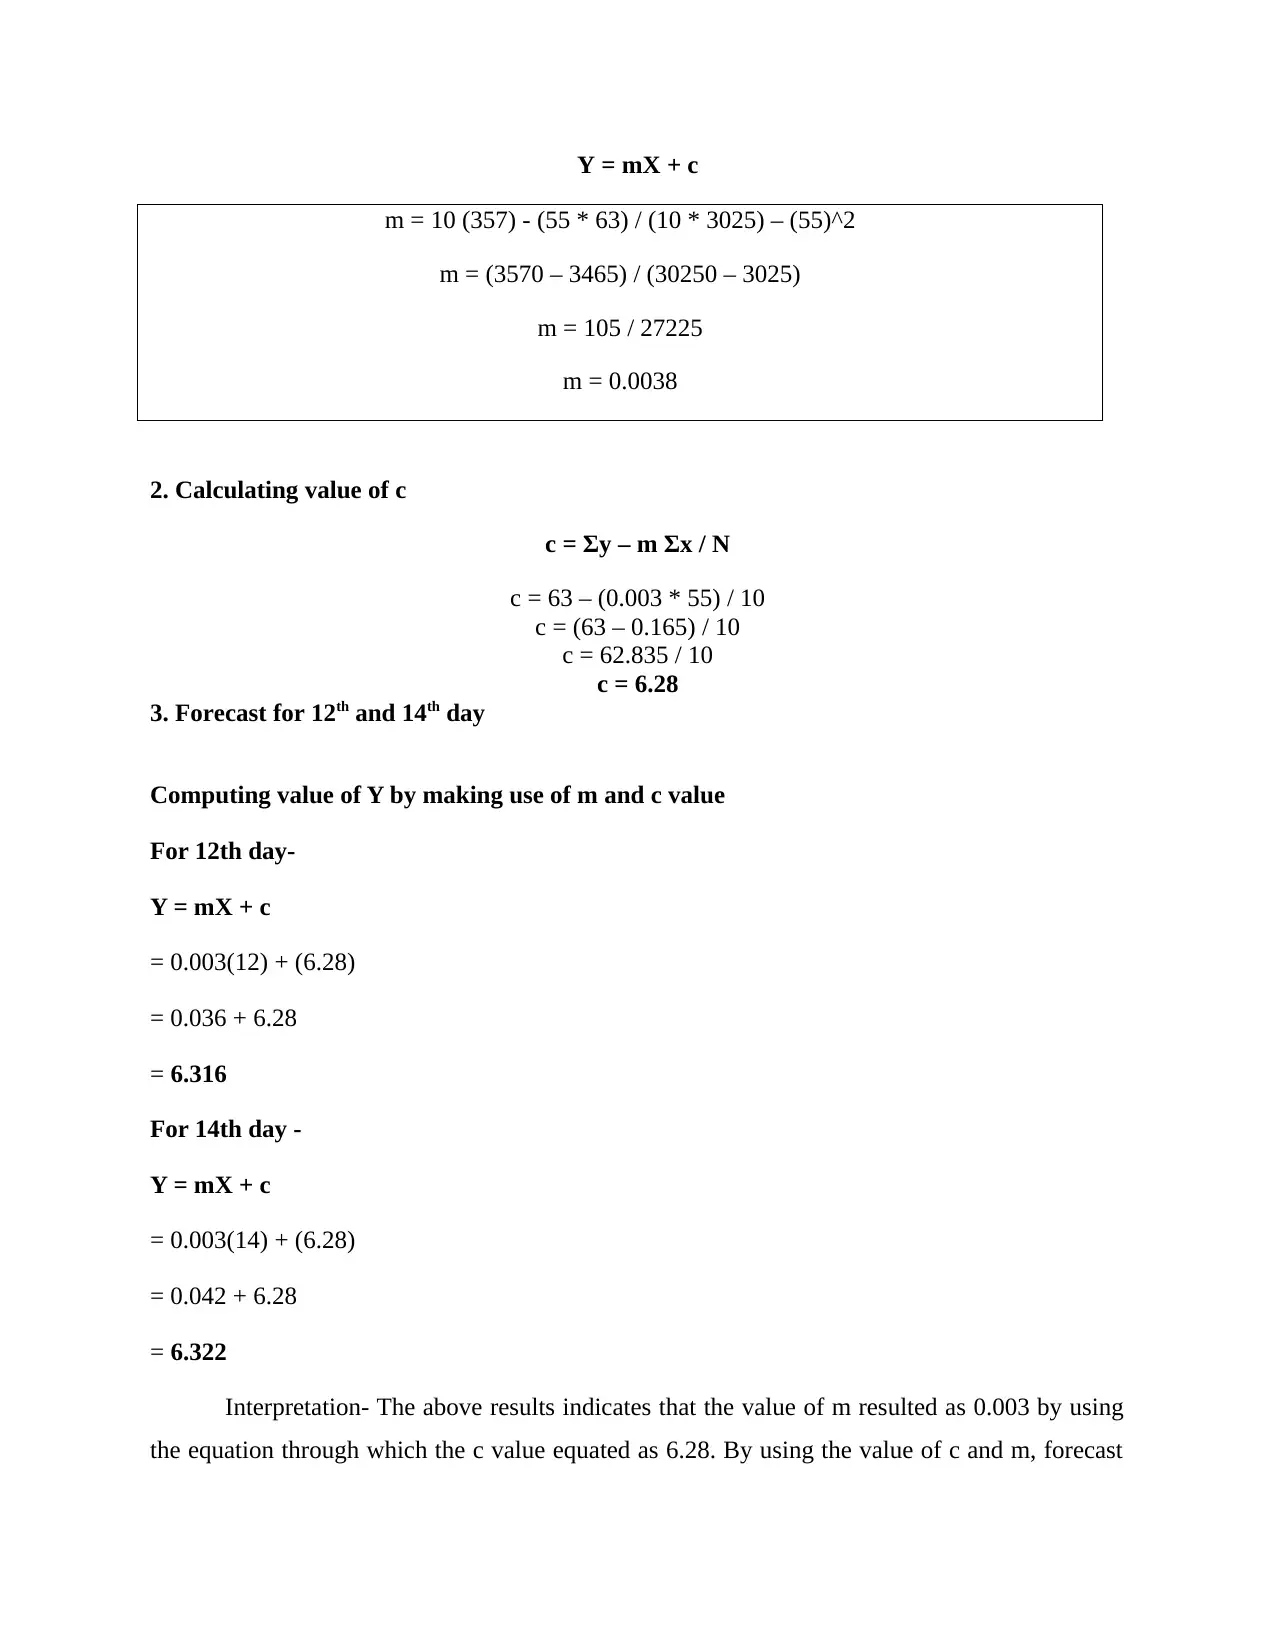
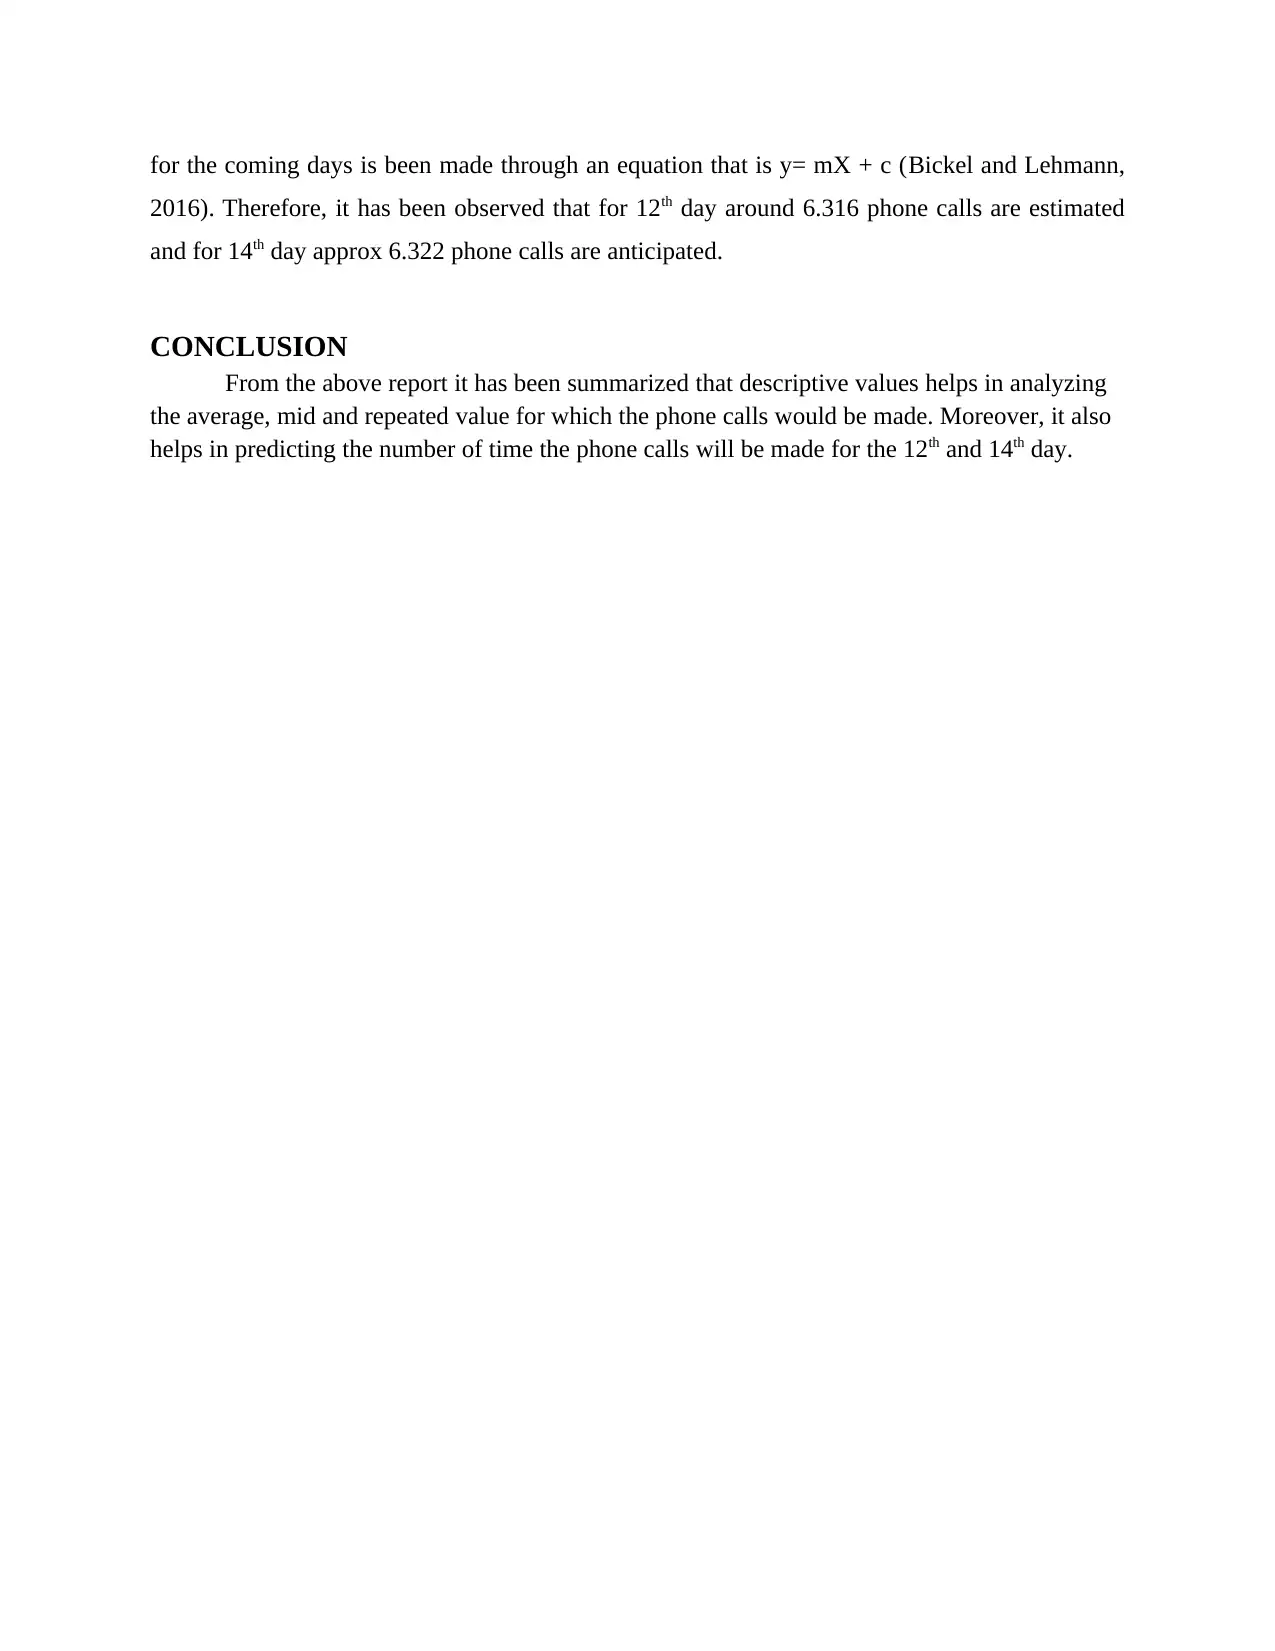
This report presents a comprehensive analysis of phone call data collected over ten consecutive days. It begins by representing the dataset in a tabular format and visualizing the data through column and line graphs. The core of the analysis involves the application of descriptive statistics, including the calculation and interpretation of mean, median, mode, range, and standard deviation. These statistical measures provide insights into the central tendencies, spread, and distribution of the phone call data. Furthermore, the report utilizes a linear forecasting model to predict the number of phone calls for the 12th and 14th days, demonstrating the application of statistical techniques for future predictions. The conclusion summarizes the findings, highlighting the utility of descriptive values and forecasting in analyzing and predicting phone call patterns. The report references relevant literature to support the analysis.
1 out of 11
Related Documents


Your All-in-One AI-Powered Toolkit for Academic Success.
+13062052269
info@desklib.com
Available 24*7 on WhatsApp / Email
![[object Object]](/_next/static/media/star-bottom.7253800d.svg)
Copyright © 2020–2026 A2Z Services. All Rights Reserved. Developed and managed by ZUCOL.