Numeracy & Data Analysis: Analyzing & Forecasting Phone Call Trends
VerifiedAdded on 2023/01/07
|9
|1394
|36
Homework Assignment
AI Summary
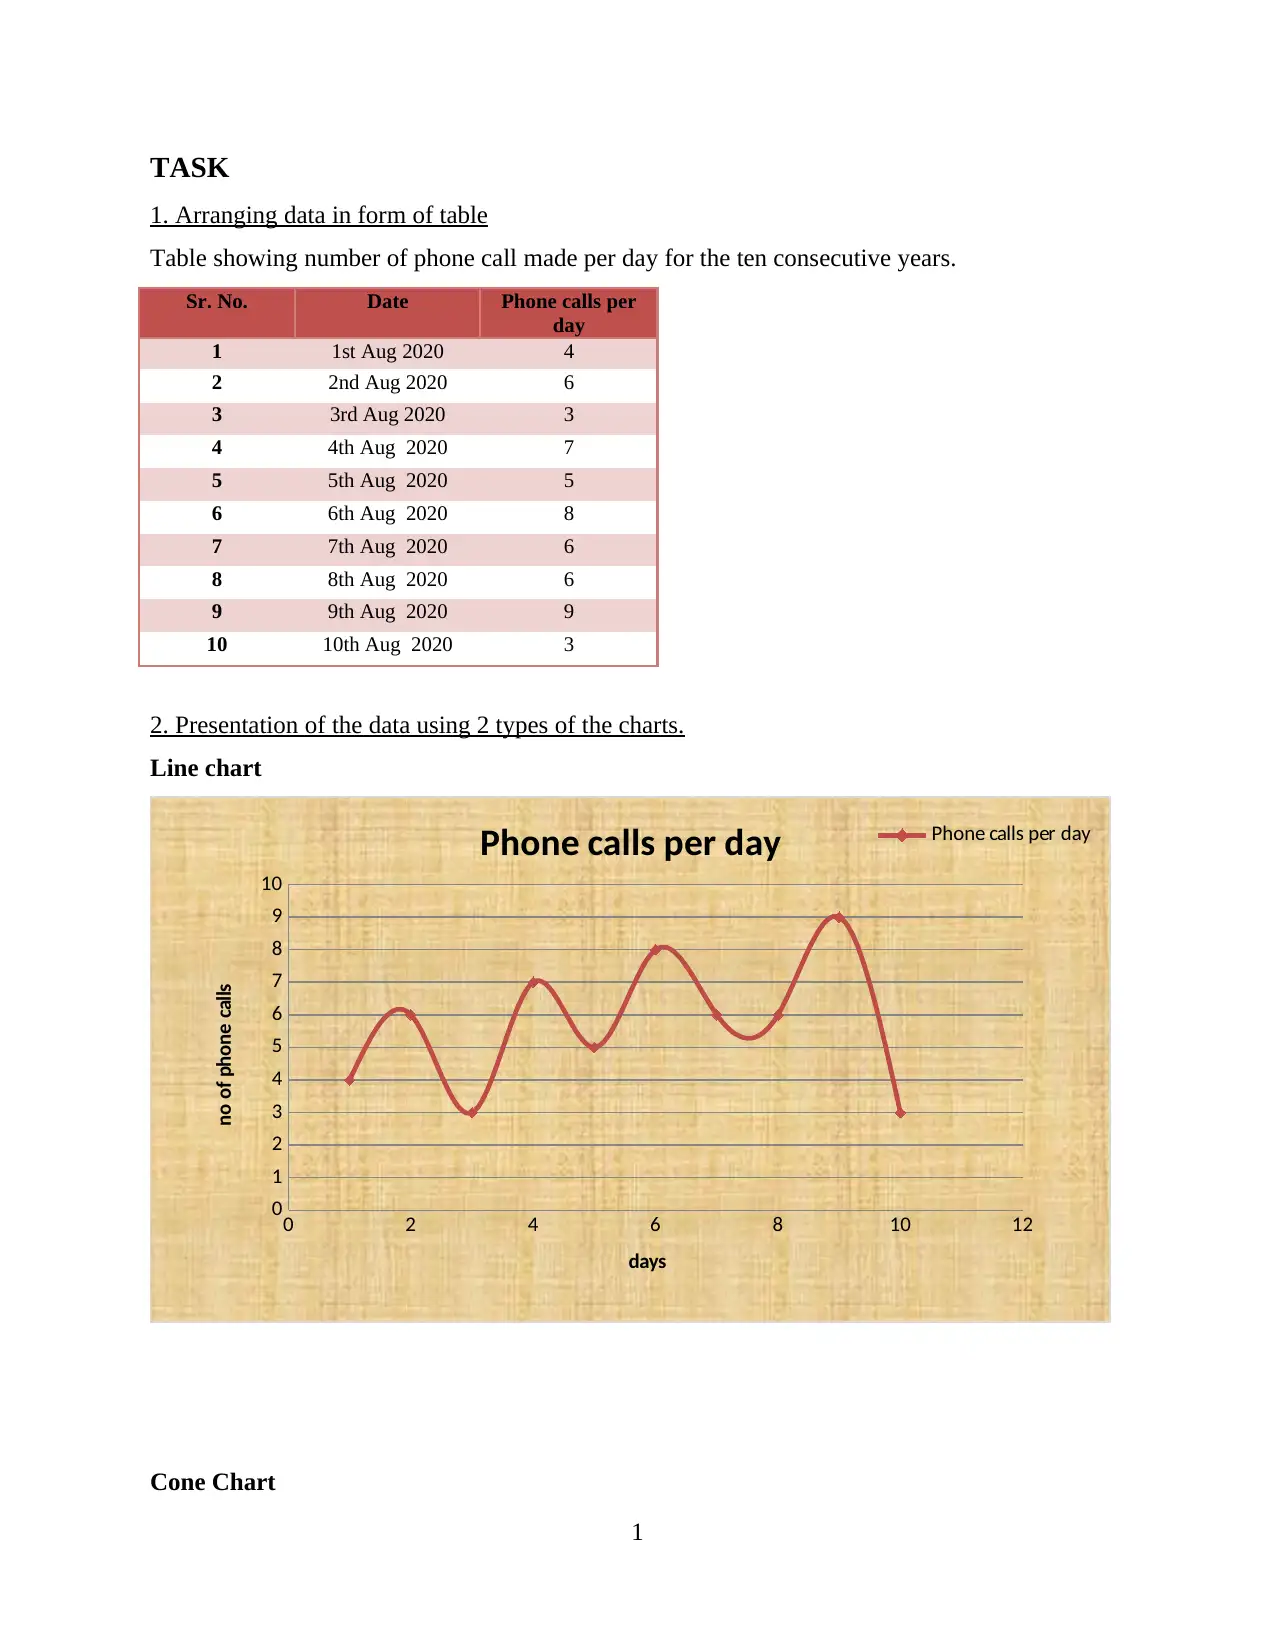
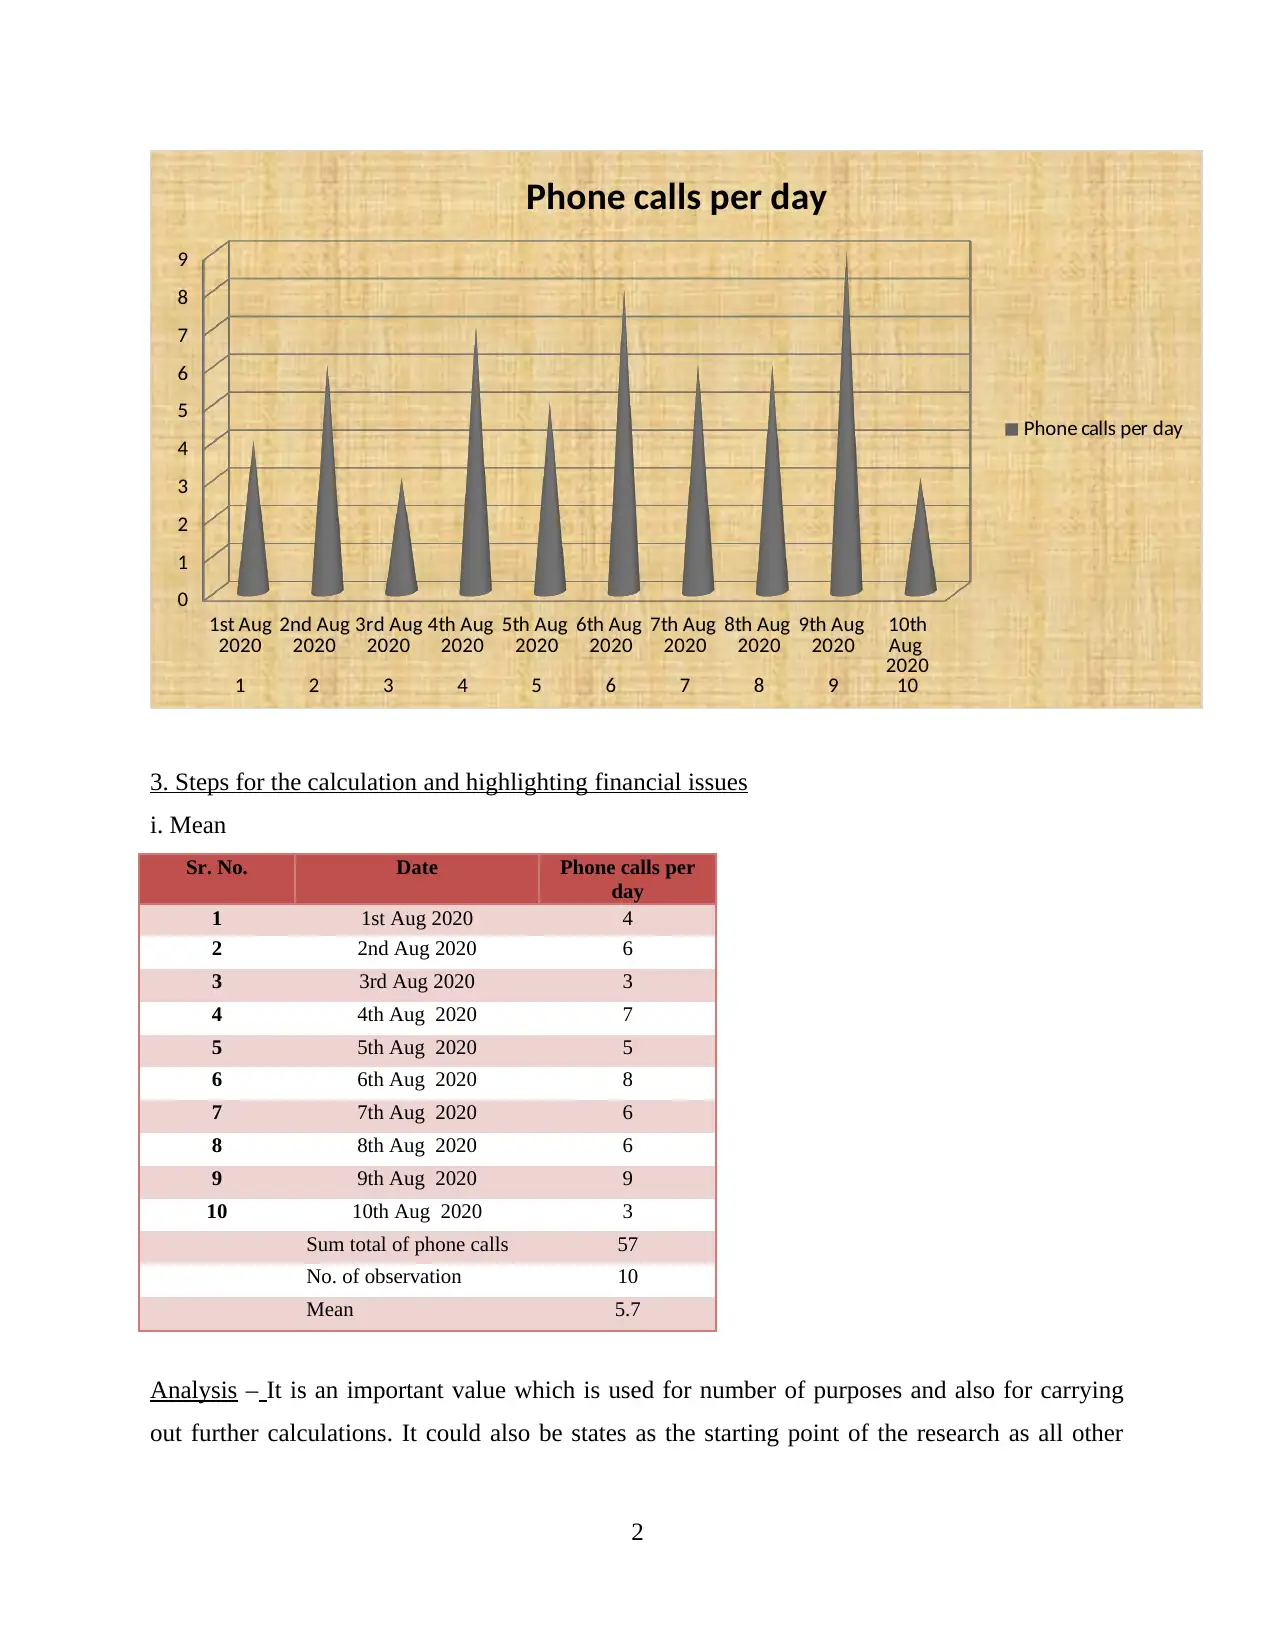
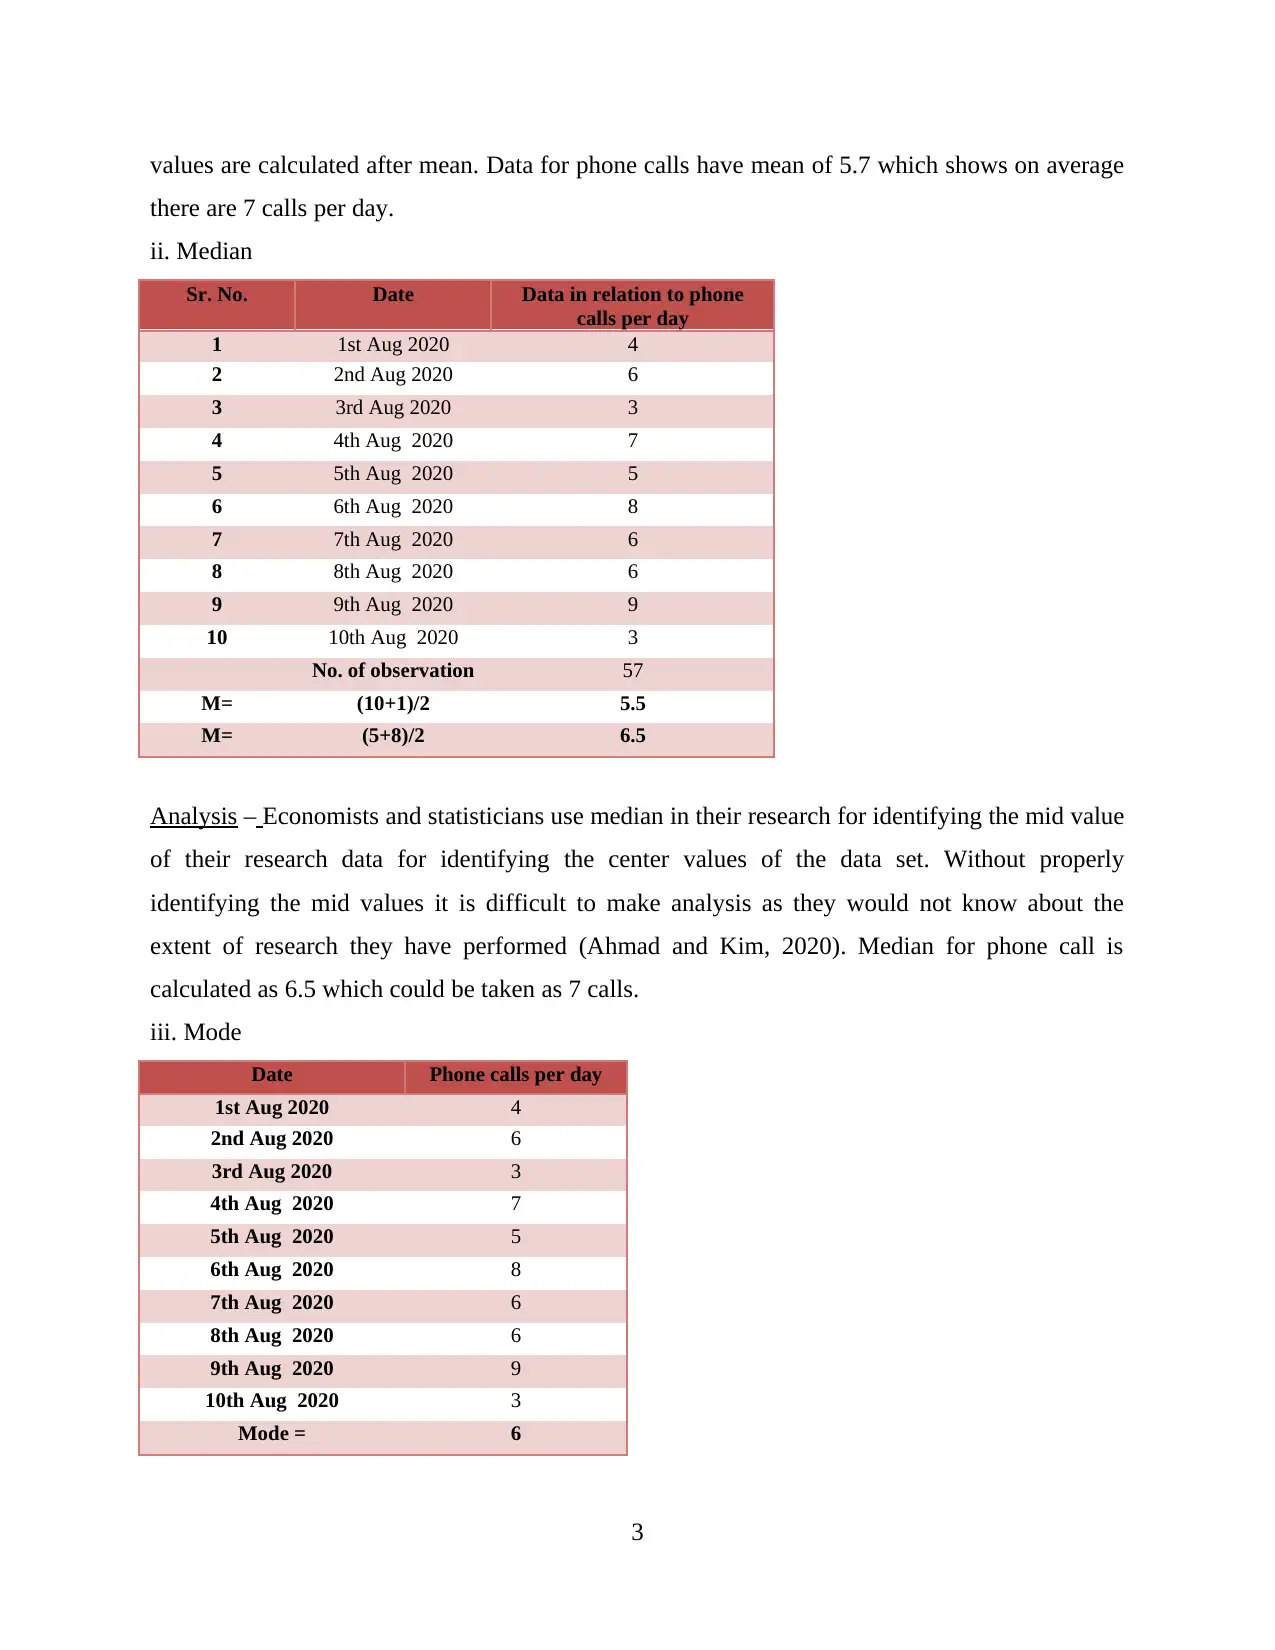
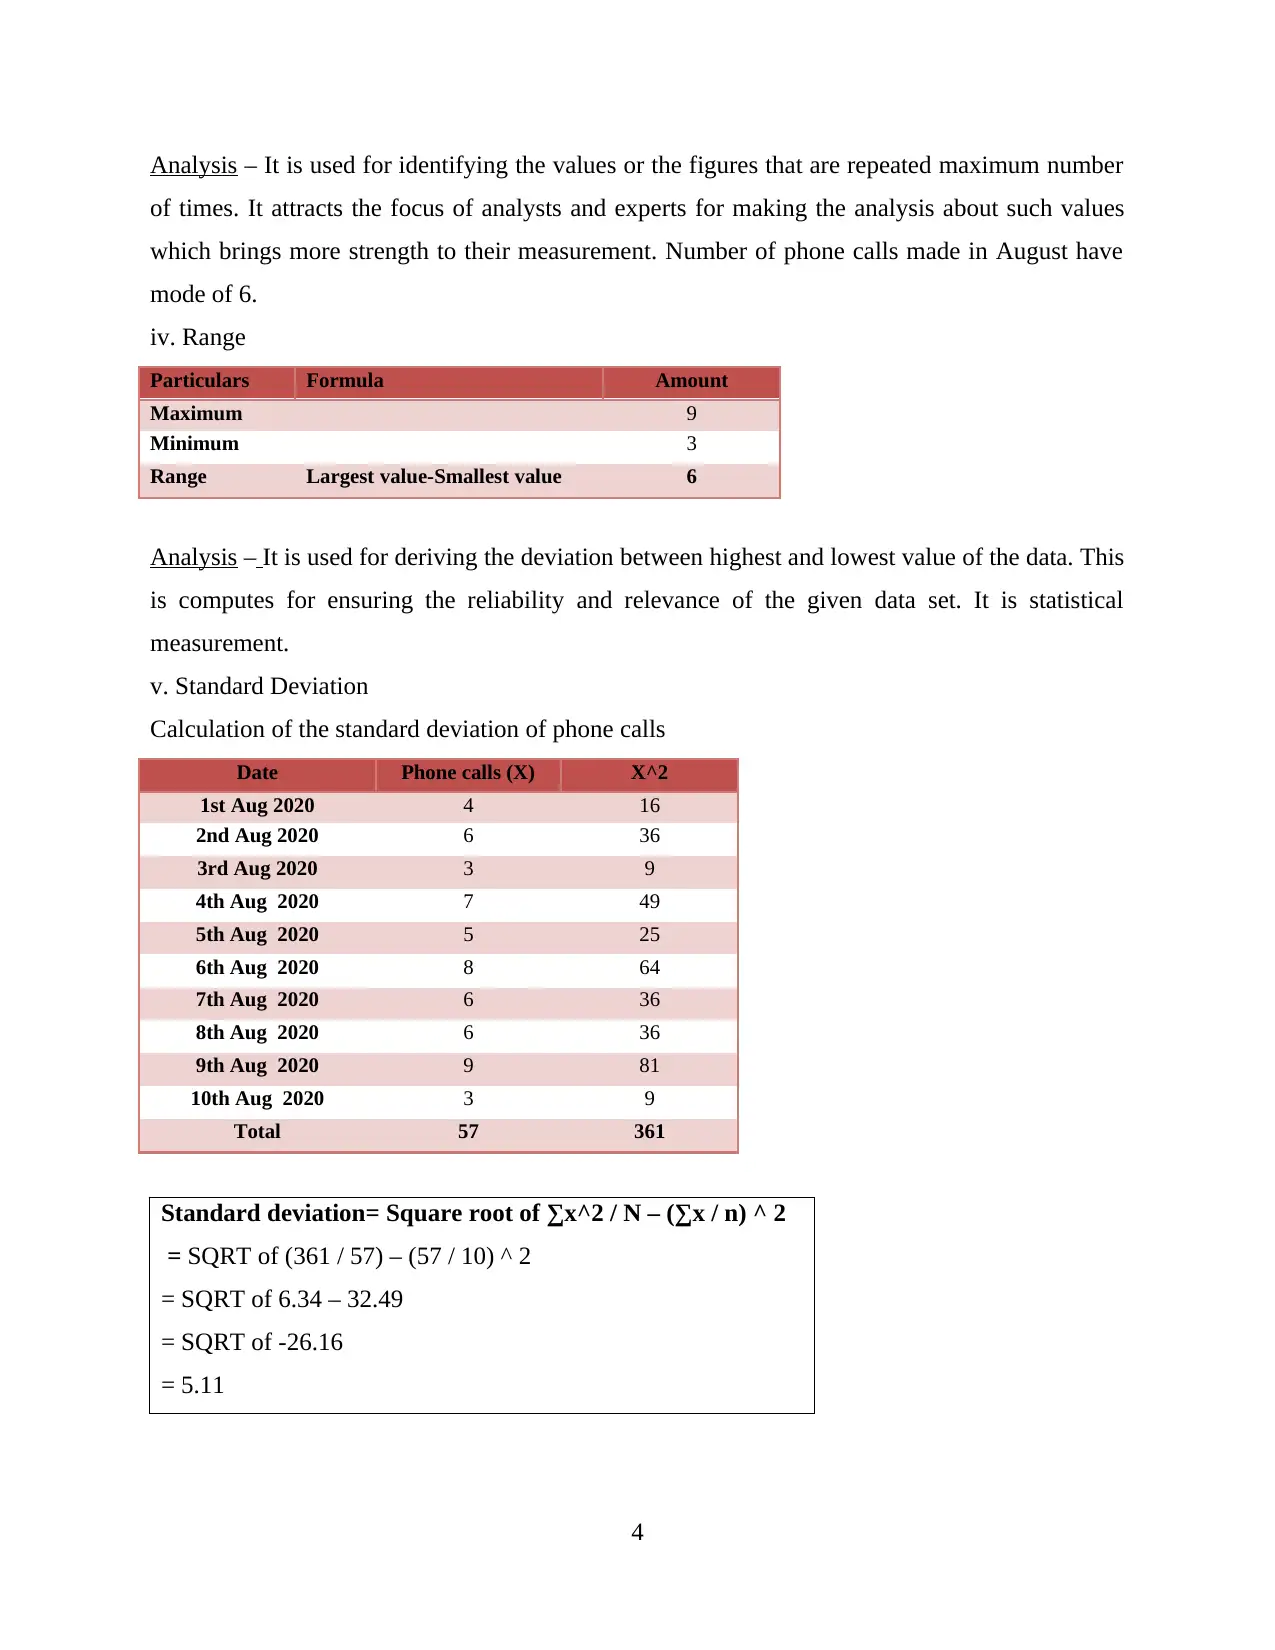
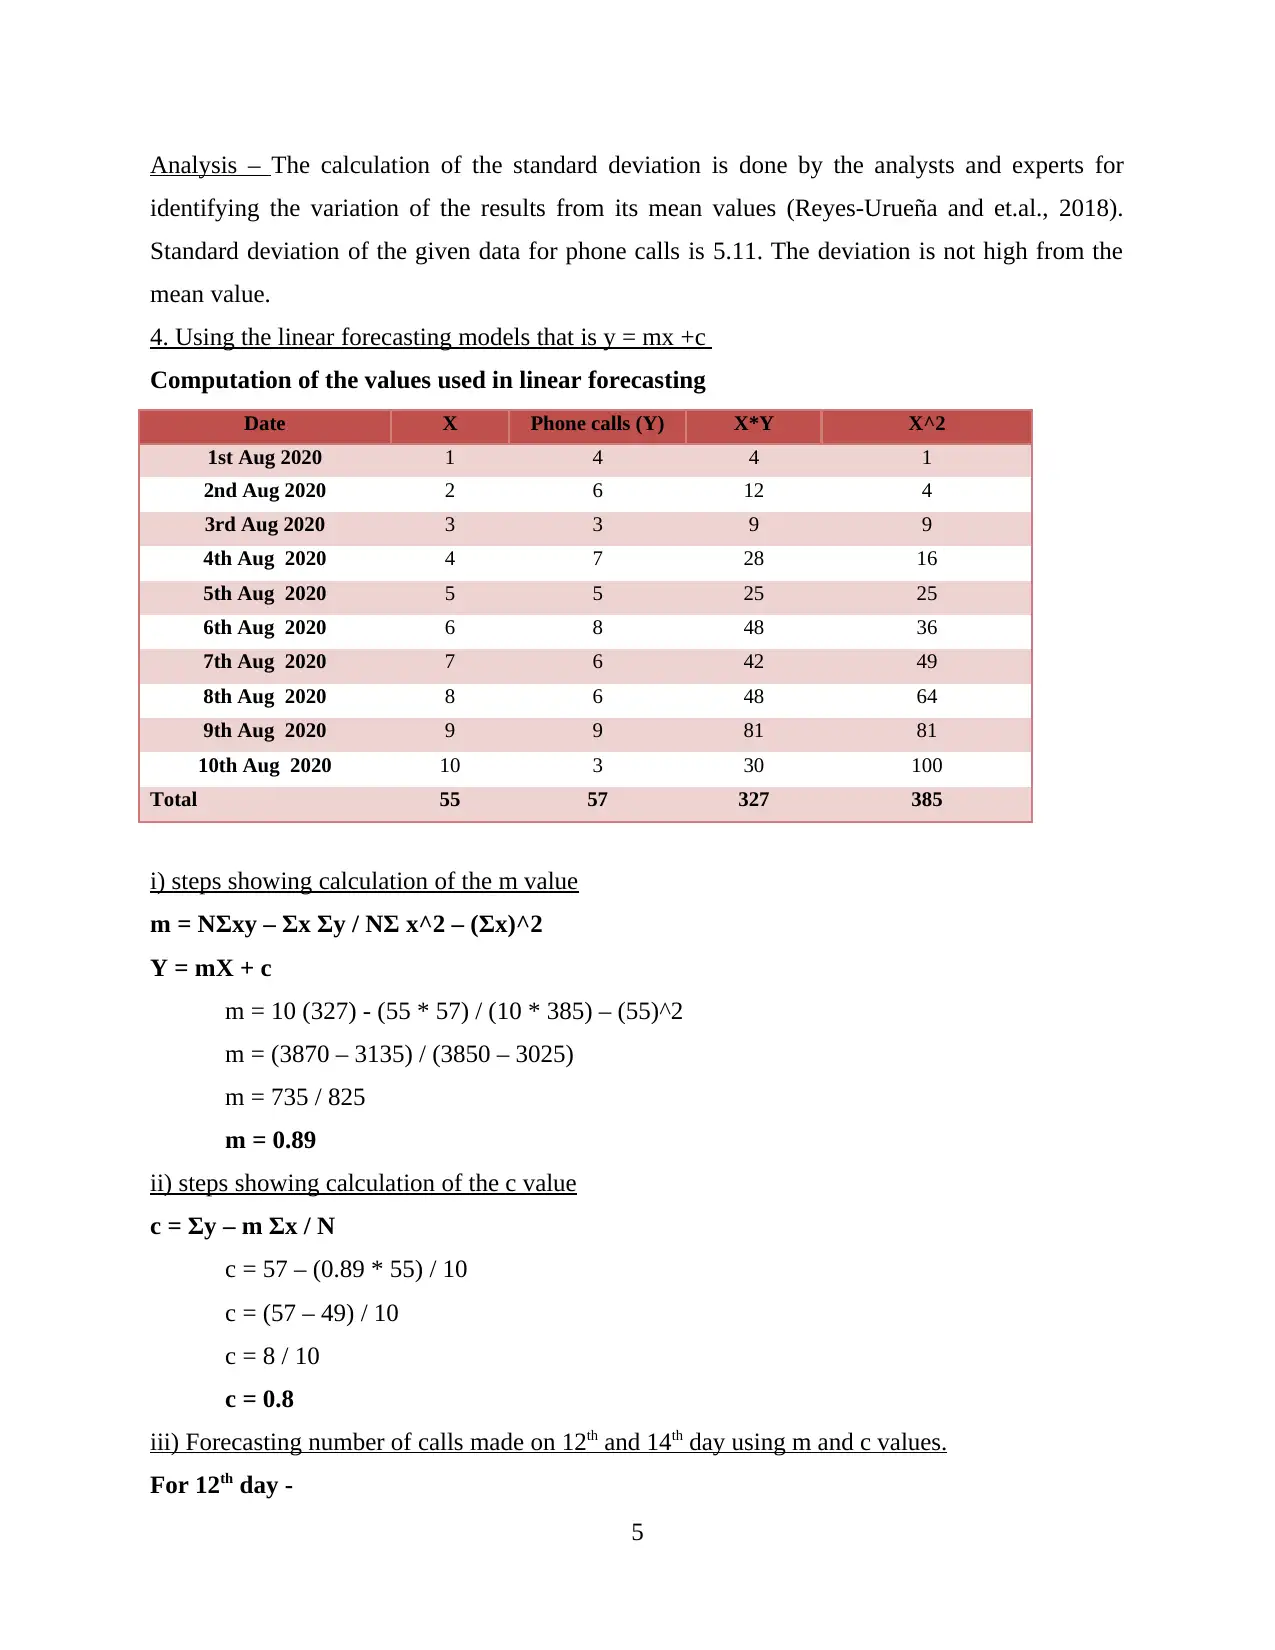
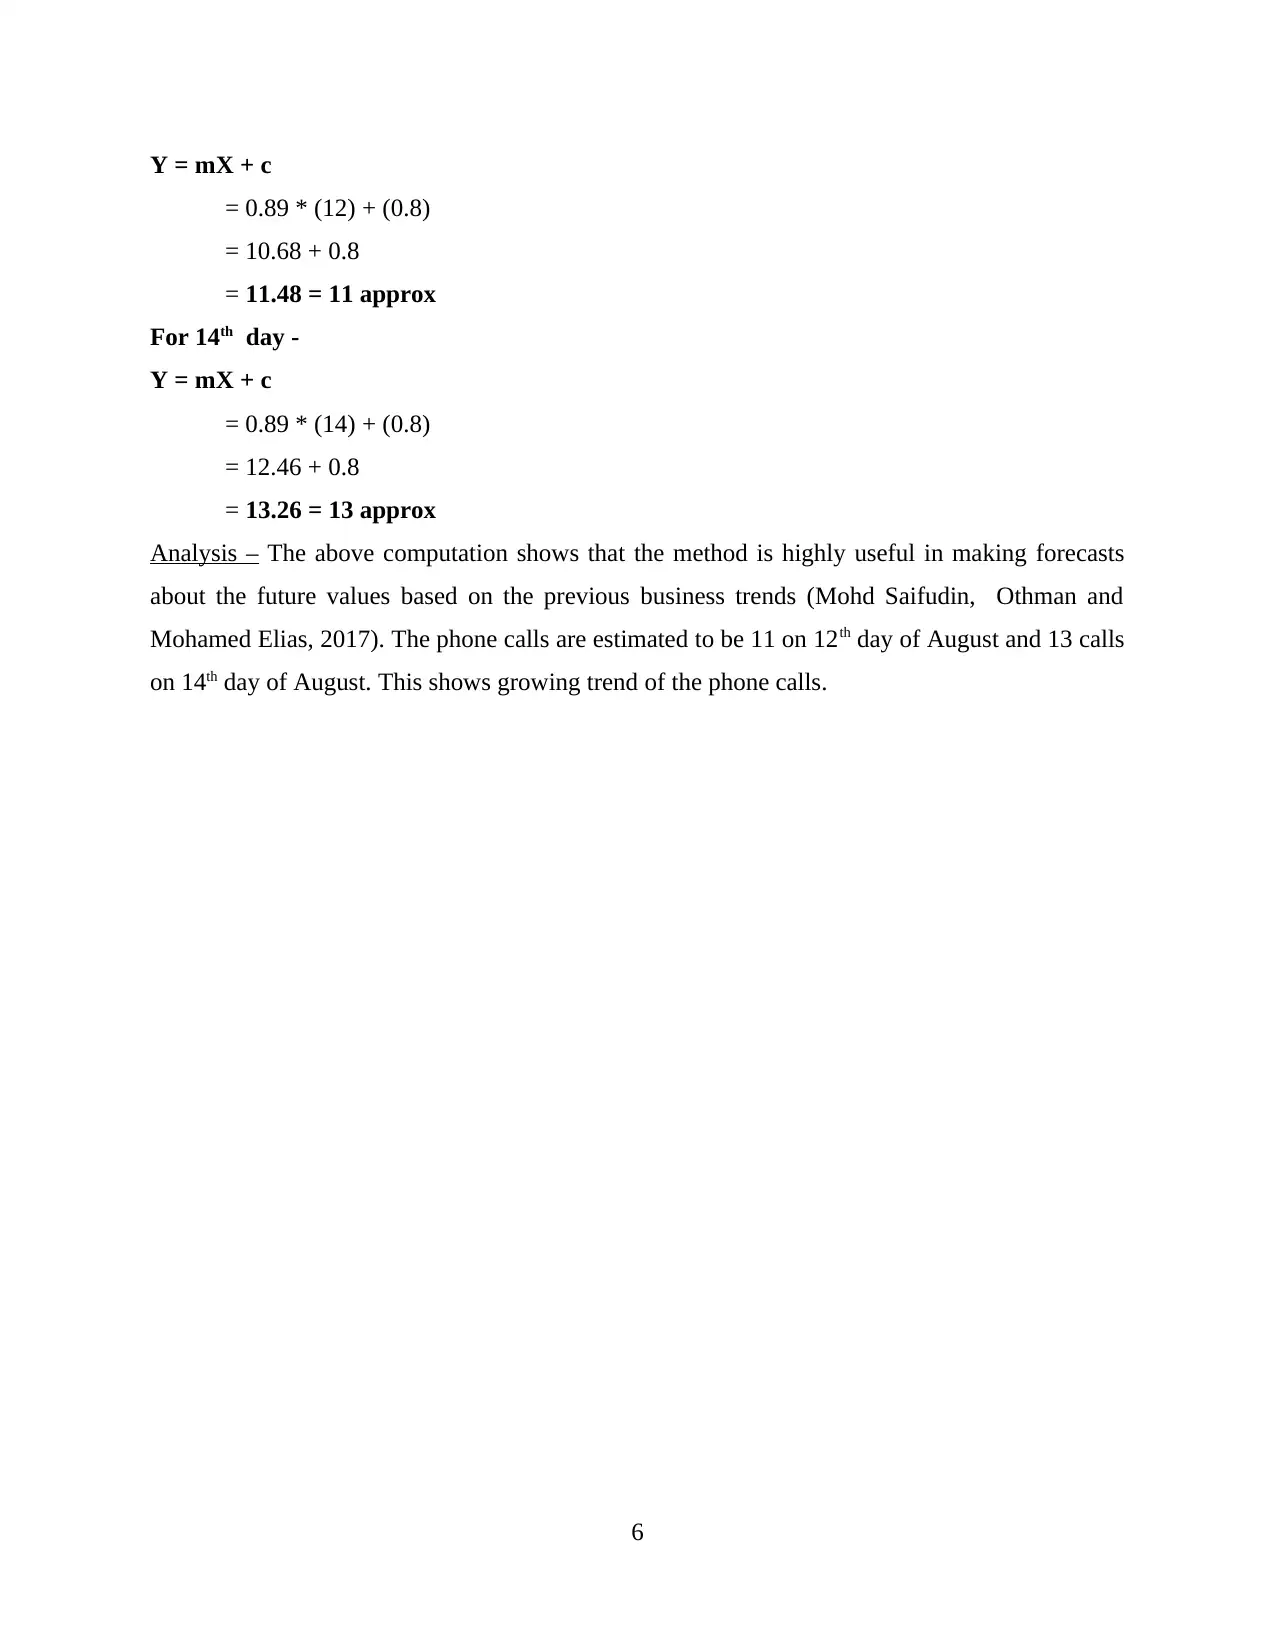
This assignment focuses on numeracy and data analysis, specifically examining phone call trends over a ten-day period. The analysis includes arranging the data in tabular form and presenting it using line and cone charts. Key statistical measures such as mean, median, mode, range, and standard deviation are calculated to highlight financial insights. Furthermore, the assignment employs a linear forecasting model (y = mx + c) to predict the number of phone calls on the 12th and 14th days, demonstrating the application of forecasting techniques based on historical data. The analysis concludes with an interpretation of the results, emphasizing the growing trend of phone calls based on the forecasted values. Desklib provides this and other solved assignments to aid students in their studies.
1 out of 9
Related Documents


Your All-in-One AI-Powered Toolkit for Academic Success.
+13062052269
info@desklib.com
Available 24*7 on WhatsApp / Email
![[object Object]](/_next/static/media/star-bottom.7253800d.svg)
Copyright © 2020–2026 A2Z Services. All Rights Reserved. Developed and managed by ZUCOL.