Numeracy & Data Analysis: Statistical Methods & Linear Forecasting
VerifiedAdded on 2023/01/07
|9
|1397
|85
Report
AI Summary
This report presents a data analysis using various statistical methods and a linear forecasting model. The data, representing phone calls per day over a 10-day period, is presented in both tabular and graphical forms, including bar and pie charts. The analysis includes calculations and discussions of ...
NUMERACY AND DATA
ANALYSIS
ANALYSIS
Paraphrase This Document
Need a fresh take? Get an instant paraphrase of this document with our AI Paraphraser
TABLE OF CONTENTS
TABLE OF CONTENTS................................................................................................................2
REPORT..........................................................................................................................................1
1. Presentation of the data in table...............................................................................................1
2. Presentation of data in graphical form.....................................................................................1
3. Calculation and discussion of the different types of methods used in data analysis...............2
4. Linear forecasting model for the calculation of values of m & c of equation y = mx+c........5
REFERENCES................................................................................................................................7
REPORT
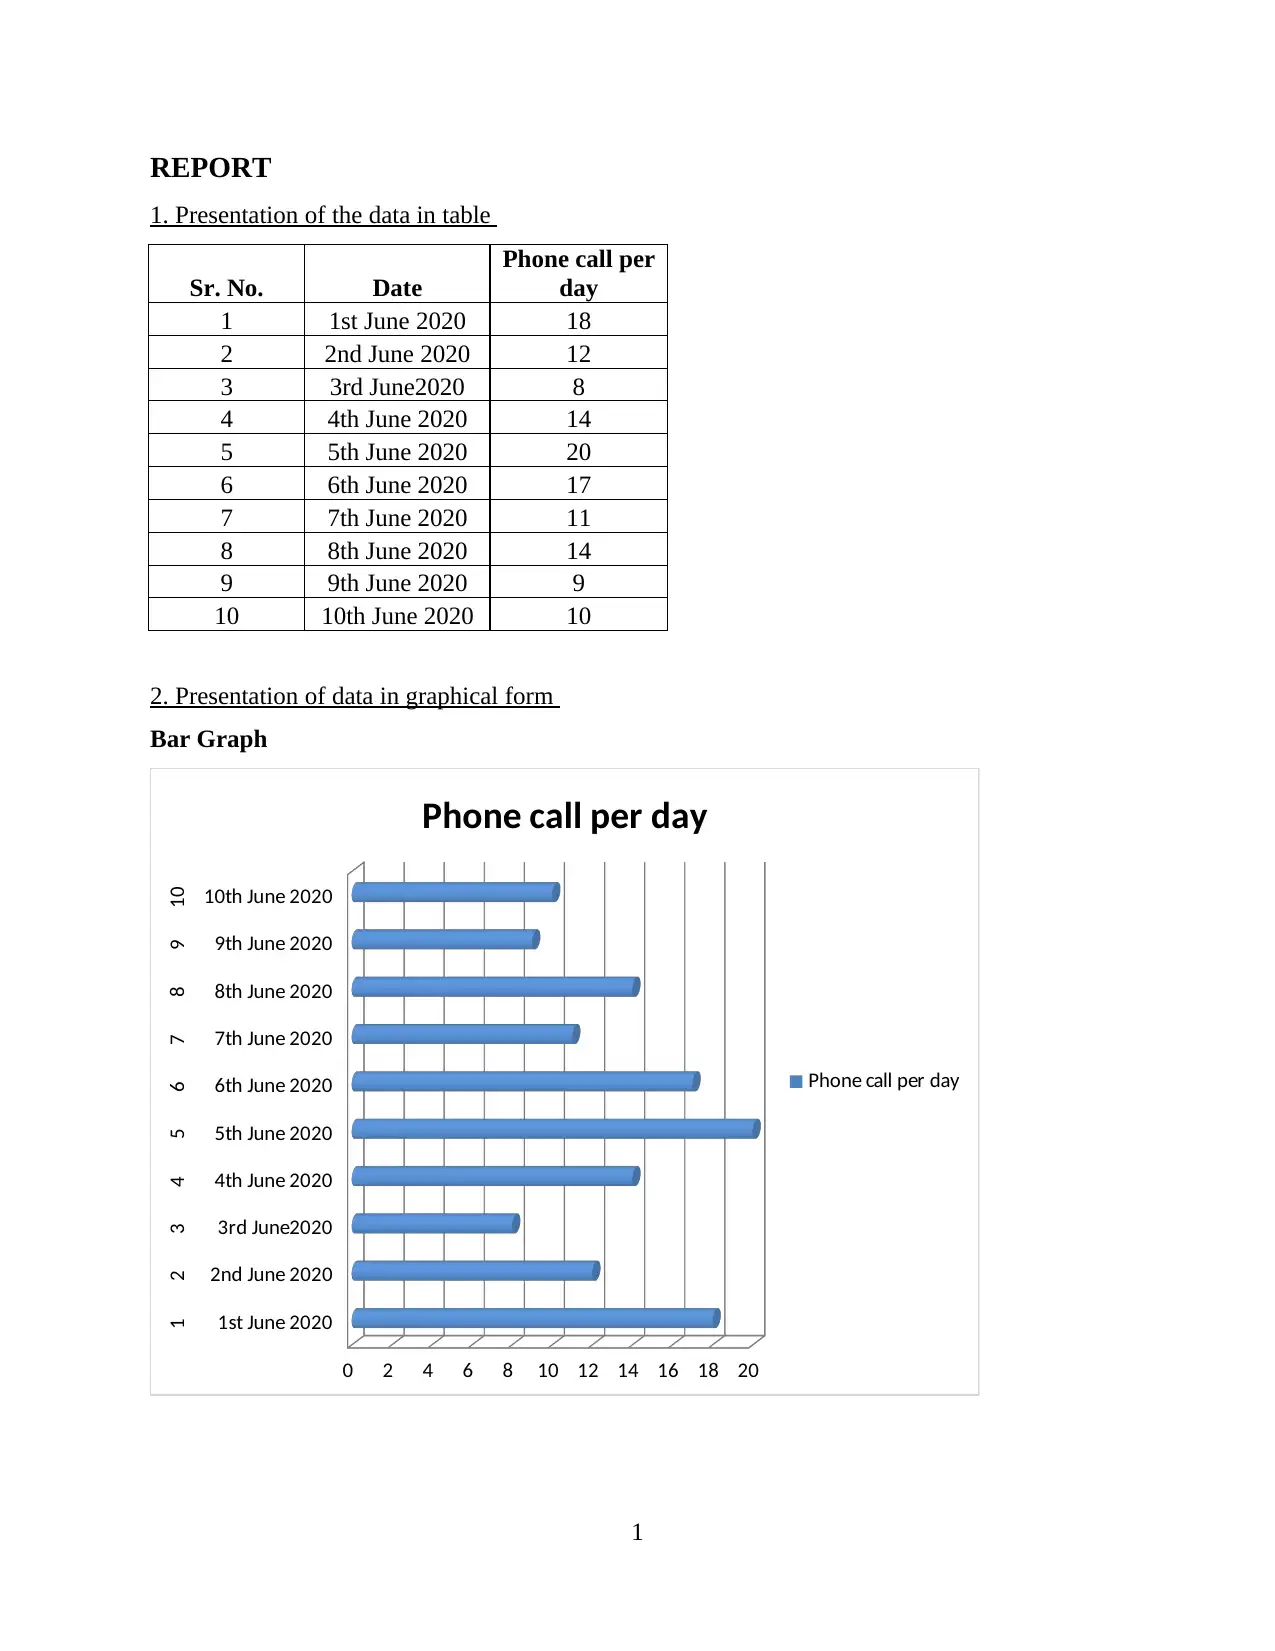
1. Presentation of the data in table
Sr. No. Date
Phone call per
day
1 1st June 2020 18
2 2nd June 2020 12
3 3rd June2020 8
4 4th June 2020 14
5 5th June 2020 20
6 6th June 2020 17
7 7th June 2020 11
8 8th June 2020 14
9 9th June 2020 9
10 10th June 2020 10
2. Presentation of data in graphical form
Bar Graph
1st June 2020
2nd June 2020
3rd June2020
4th June 2020
5th June 2020
6th June 2020
7th June 2020
8th June 2020
9th June 2020
10th June 2020
1 2 3 4 5 6 7 8 9 10
0 2 4 6 8 10 12 14 16 18 20
Phone call per day
Phone call per day
1
⊘ This is a preview!⊘
Do you want full access?
Subscribe today to unlock all pages.
Trusted by 1+ million students worldwide
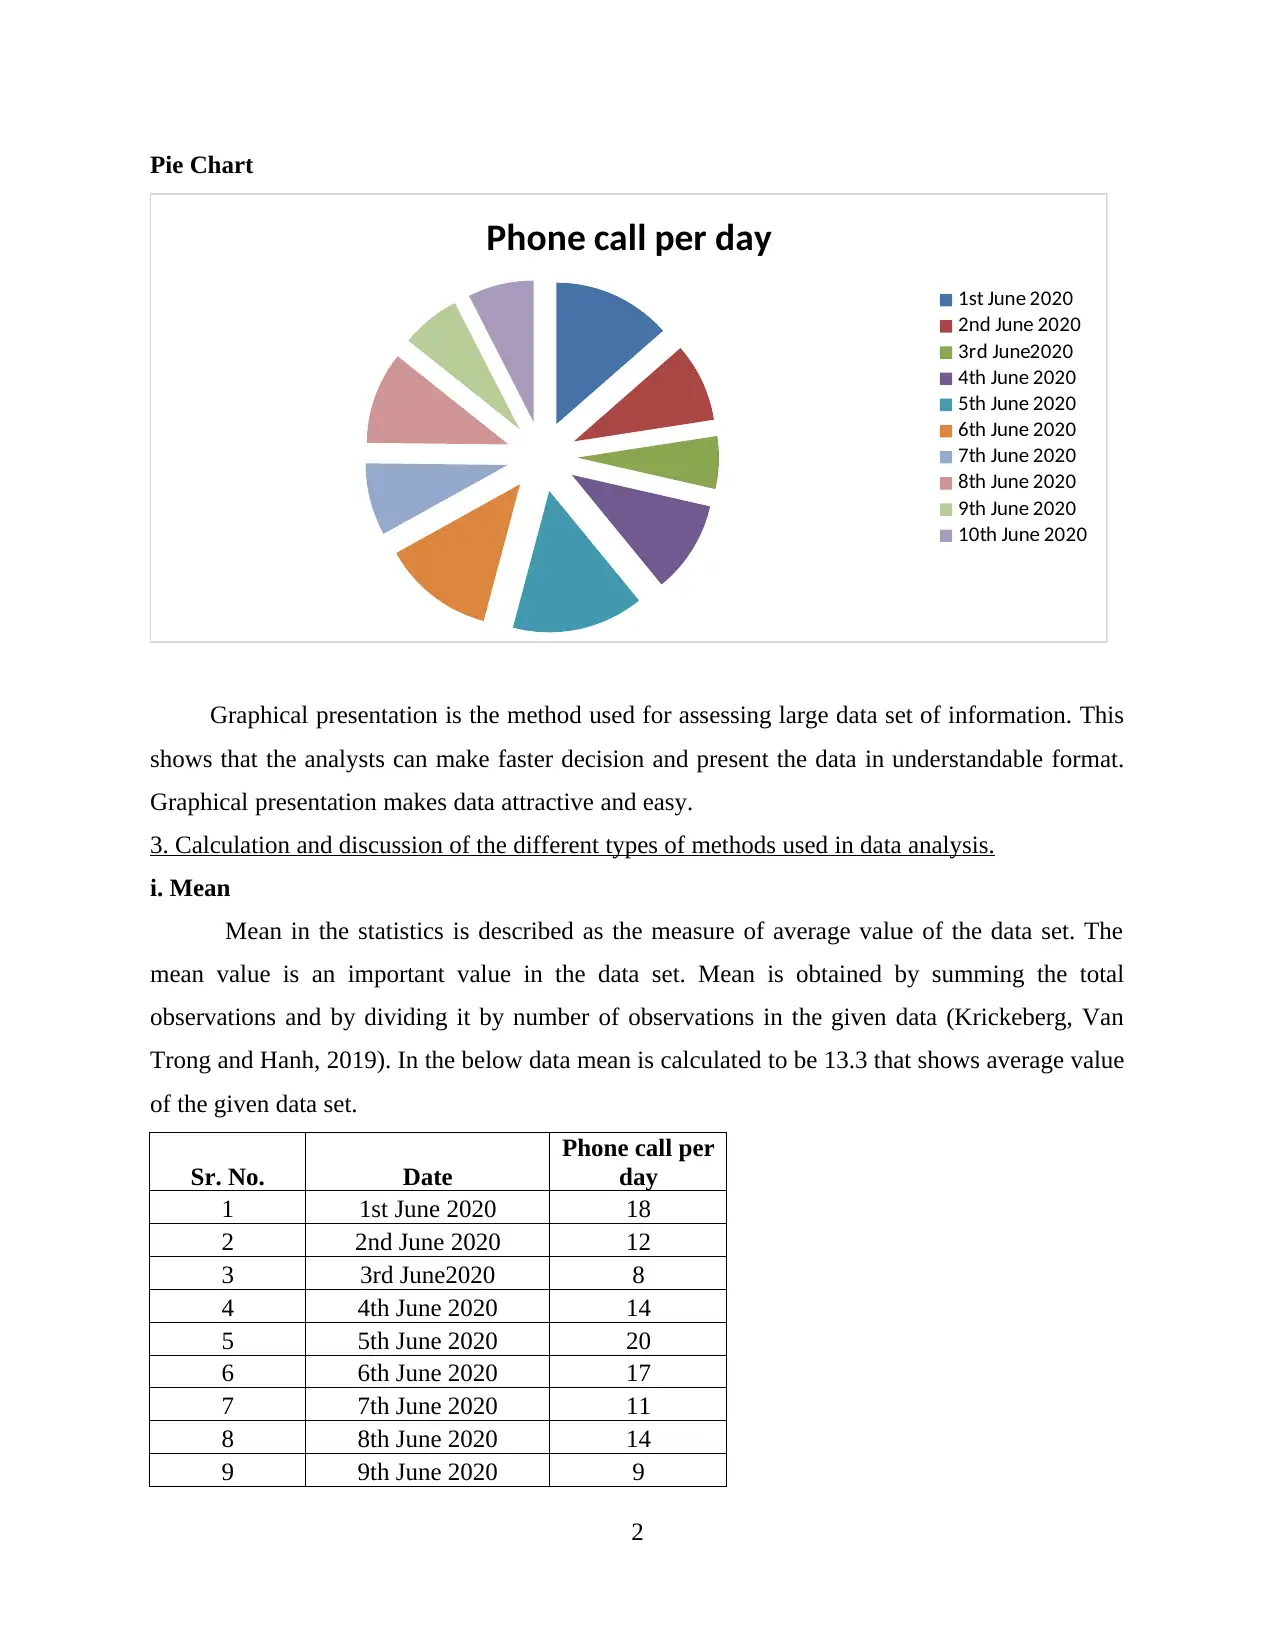
Pie Chart
Phone call per day
1st June 2020
2nd June 2020
3rd June2020
4th June 2020
5th June 2020
6th June 2020
7th June 2020
8th June 2020
9th June 2020
10th June 2020
Graphical presentation is the method used for assessing large data set of information. This
shows that the analysts can make faster decision and present the data in understandable format.
Graphical presentation makes data attractive and easy.
3. Calculation and discussion of the different types of methods used in data analysis.
i. Mean
Mean in the statistics is described as the measure of average value of the data set. The
mean value is an important value in the data set. Mean is obtained by summing the total
observations and by dividing it by number of observations in the given data (Krickeberg, Van
Trong and Hanh, 2019). In the below data mean is calculated to be 13.3 that shows average value
of the given data set.
Sr. No. Date
Phone call per
day
1 1st June 2020 18
2 2nd June 2020 12
3 3rd June2020 8
4 4th June 2020 14
5 5th June 2020 20
6 6th June 2020 17
7 7th June 2020 11
8 8th June 2020 14
9 9th June 2020 9
2
Paraphrase This Document
Need a fresh take? Get an instant paraphrase of this document with our AI Paraphraser
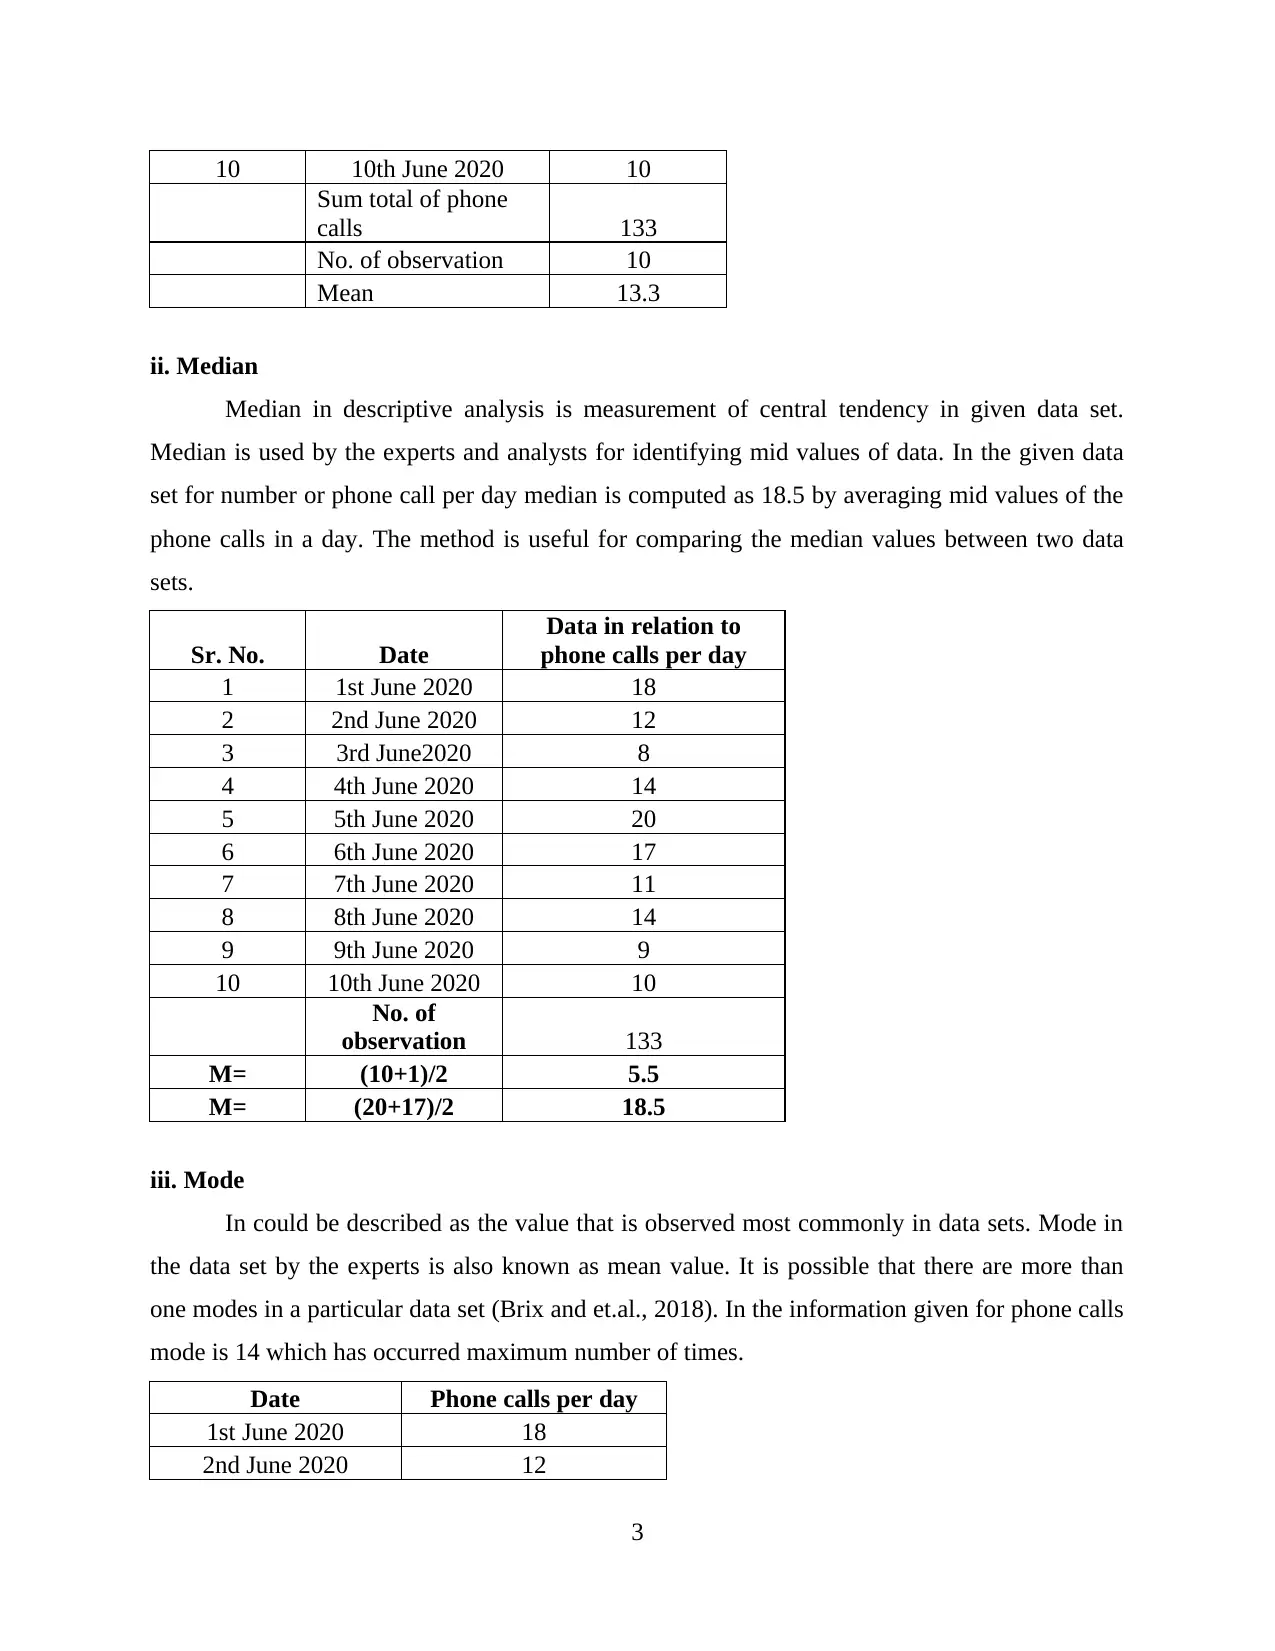
10 10th June 2020 10
Sum total of phone
calls 133
No. of observation 10
Mean 13.3
ii. Median
Median in descriptive analysis is measurement of central tendency in given data set.
Median is used by the experts and analysts for identifying mid values of data. In the given data
set for number or phone call per day median is computed as 18.5 by averaging mid values of the
phone calls in a day. The method is useful for comparing the median values between two data
sets.
Sr. No. Date
Data in relation to
phone calls per day
1 1st June 2020 18
2 2nd June 2020 12
3 3rd June2020 8
4 4th June 2020 14
5 5th June 2020 20
6 6th June 2020 17
7 7th June 2020 11
8 8th June 2020 14
9 9th June 2020 9
10 10th June 2020 10
No. of
observation 133
M= (10+1)/2 5.5
M= (20+17)/2 18.5
iii. Mode
In could be described as the value that is observed most commonly in data sets. Mode in
the data set by the experts is also known as mean value. It is possible that there are more than
one modes in a particular data set (Brix and et.al., 2018). In the information given for phone calls
mode is 14 which has occurred maximum number of times.
Date Phone calls per day
1st June 2020 18
2nd June 2020 12
3
3rd June2020 8
4th June 2020 14
5th June 2020 20
6th June 2020 17
7th June 2020 11
8th June 2020 14
9th June 2020 9
10th June 2020 10
Mode = 14
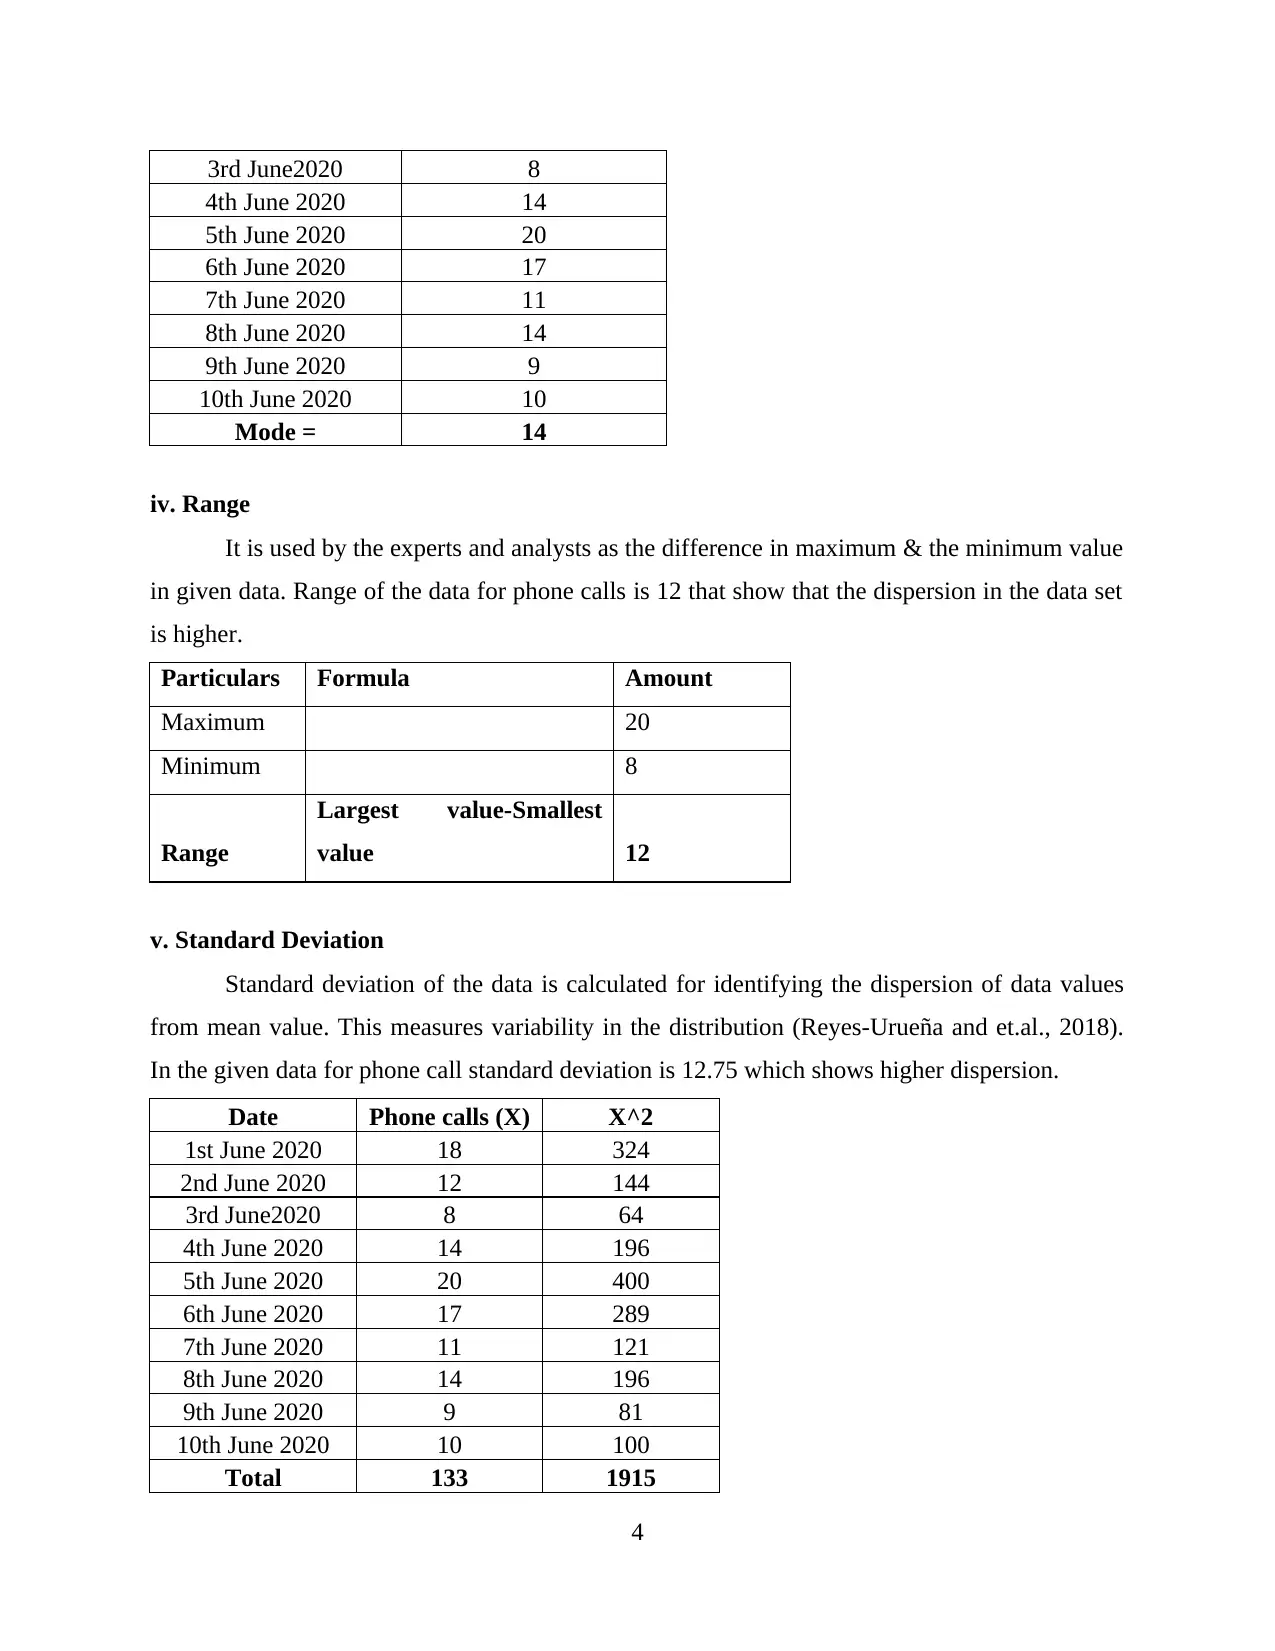
iv. Range
It is used by the experts and analysts as the difference in maximum & the minimum value
in given data. Range of the data for phone calls is 12 that show that the dispersion in the data set
is higher.
Particulars Formula Amount
Maximum 20
Minimum 8
Range
Largest value-Smallest
value 12
v. Standard Deviation
Standard deviation of the data is calculated for identifying the dispersion of data values
from mean value. This measures variability in the distribution (Reyes-Urueña and et.al., 2018).
In the given data for phone call standard deviation is 12.75 which shows higher dispersion.
Date Phone calls (X) X^2
1st June 2020 18 324
2nd June 2020 12 144
3rd June2020 8 64
4th June 2020 14 196
5th June 2020 20 400
6th June 2020 17 289
7th June 2020 11 121
8th June 2020 14 196
9th June 2020 9 81
10th June 2020 10 100
Total 133 1915
4
4th June 2020 14
5th June 2020 20
6th June 2020 17
7th June 2020 11
8th June 2020 14
9th June 2020 9
10th June 2020 10
Mode = 14
iv. Range
It is used by the experts and analysts as the difference in maximum & the minimum value
in given data. Range of the data for phone calls is 12 that show that the dispersion in the data set
is higher.
Particulars Formula Amount
Maximum 20
Minimum 8
Range
Largest value-Smallest
value 12
v. Standard Deviation
Standard deviation of the data is calculated for identifying the dispersion of data values
from mean value. This measures variability in the distribution (Reyes-Urueña and et.al., 2018).
In the given data for phone call standard deviation is 12.75 which shows higher dispersion.
Date Phone calls (X) X^2
1st June 2020 18 324
2nd June 2020 12 144
3rd June2020 8 64
4th June 2020 14 196
5th June 2020 20 400
6th June 2020 17 289
7th June 2020 11 121
8th June 2020 14 196
9th June 2020 9 81
10th June 2020 10 100
Total 133 1915
4
⊘ This is a preview!⊘
Do you want full access?
Subscribe today to unlock all pages.
Trusted by 1+ million students worldwide
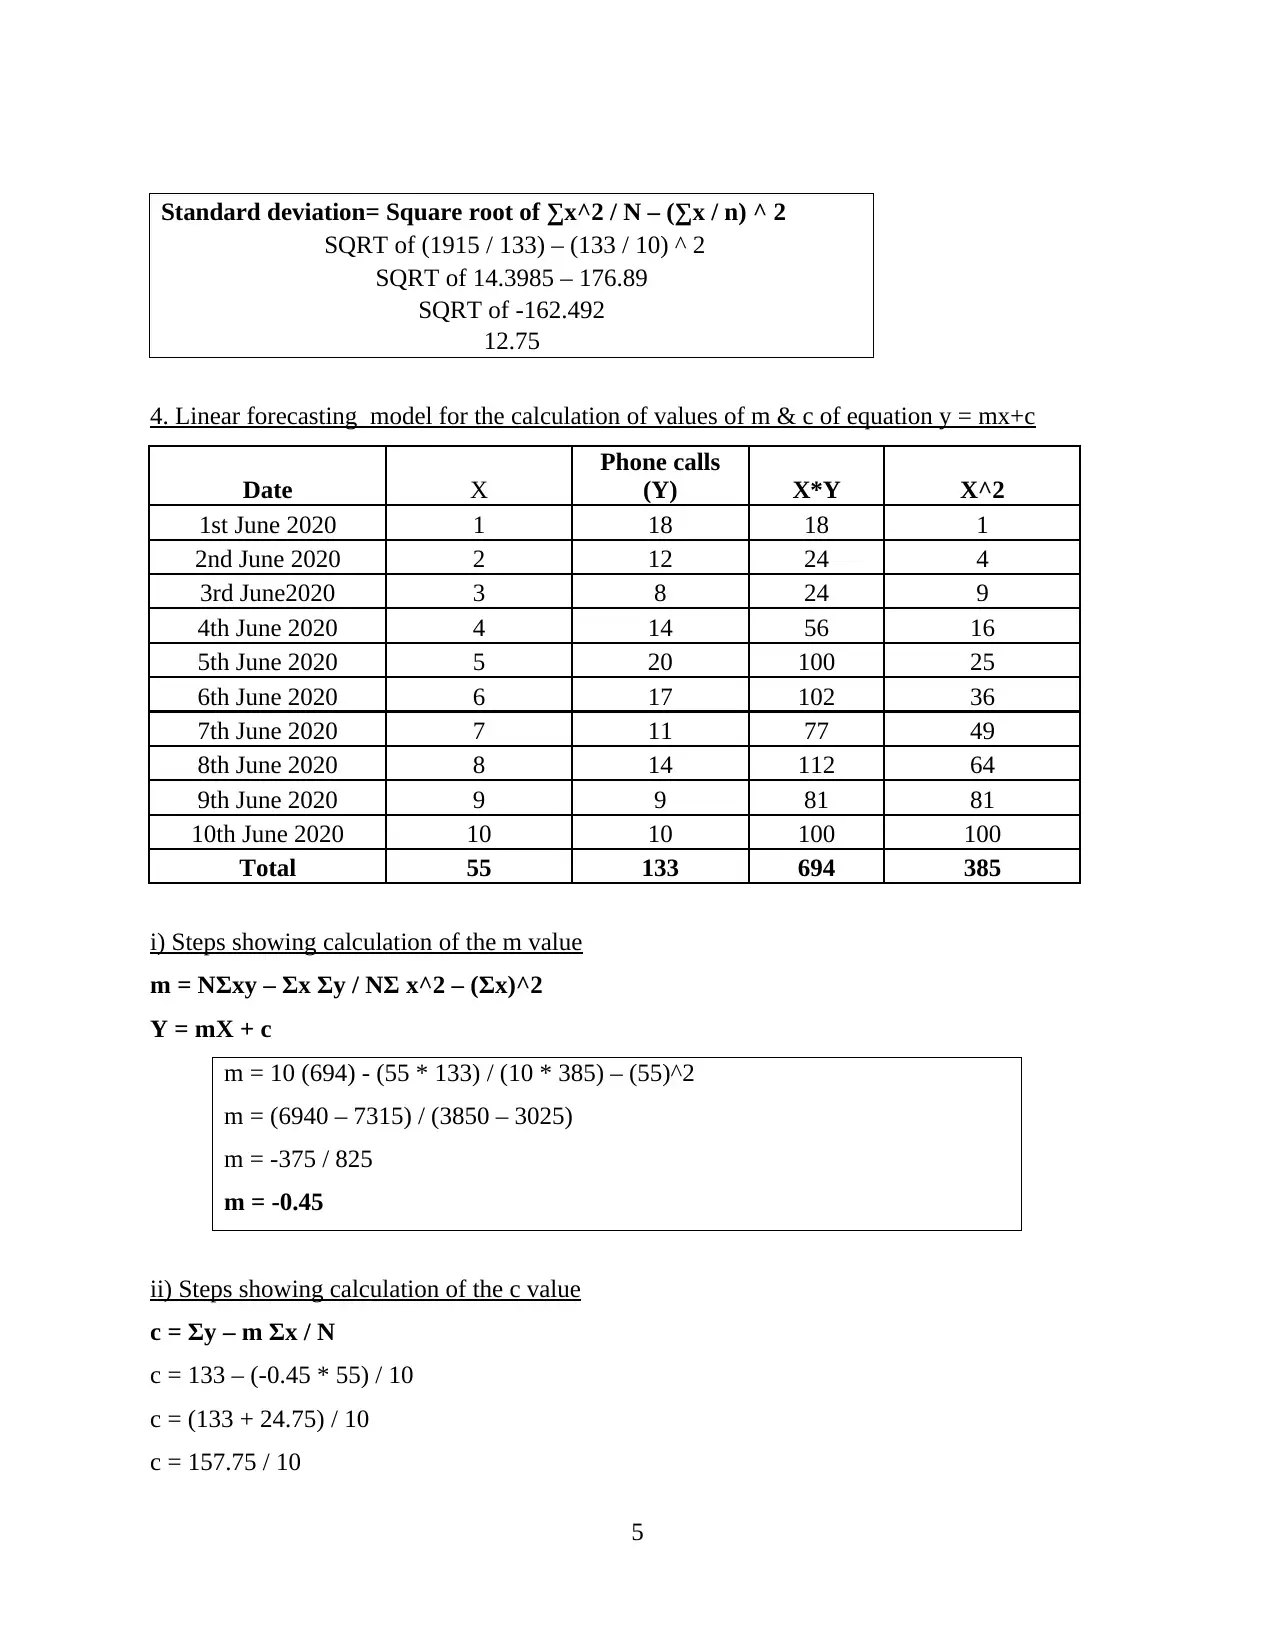
Standard deviation= Square root of ∑x^2 / N – (∑x / n) ^ 2
SQRT of (1915 / 133) – (133 / 10) ^ 2
SQRT of 14.3985 – 176.89
SQRT of -162.492
12.75
4. Linear forecasting model for the calculation of values of m & c of equation y = mx+c
Date X
Phone calls
(Y) X*Y X^2
1st June 2020 1 18 18 1
2nd June 2020 2 12 24 4
3rd June2020 3 8 24 9
4th June 2020 4 14 56 16
5th June 2020 5 20 100 25
6th June 2020 6 17 102 36
7th June 2020 7 11 77 49
8th June 2020 8 14 112 64
9th June 2020 9 9 81 81
10th June 2020 10 10 100 100
Total 55 133 694 385
i) Steps showing calculation of the m value
m = NΣxy – Σx Σy / NΣ x^2 – (Σx)^2
Y = mX + c
m = 10 (694) - (55 * 133) / (10 * 385) – (55)^2
m = (6940 – 7315) / (3850 – 3025)
m = -375 / 825
m = -0.45
ii) Steps showing calculation of the c value
c = Σy – m Σx / N
c = 133 – (-0.45 * 55) / 10
c = (133 + 24.75) / 10
c = 157.75 / 10
5
Paraphrase This Document
Need a fresh take? Get an instant paraphrase of this document with our AI Paraphraser
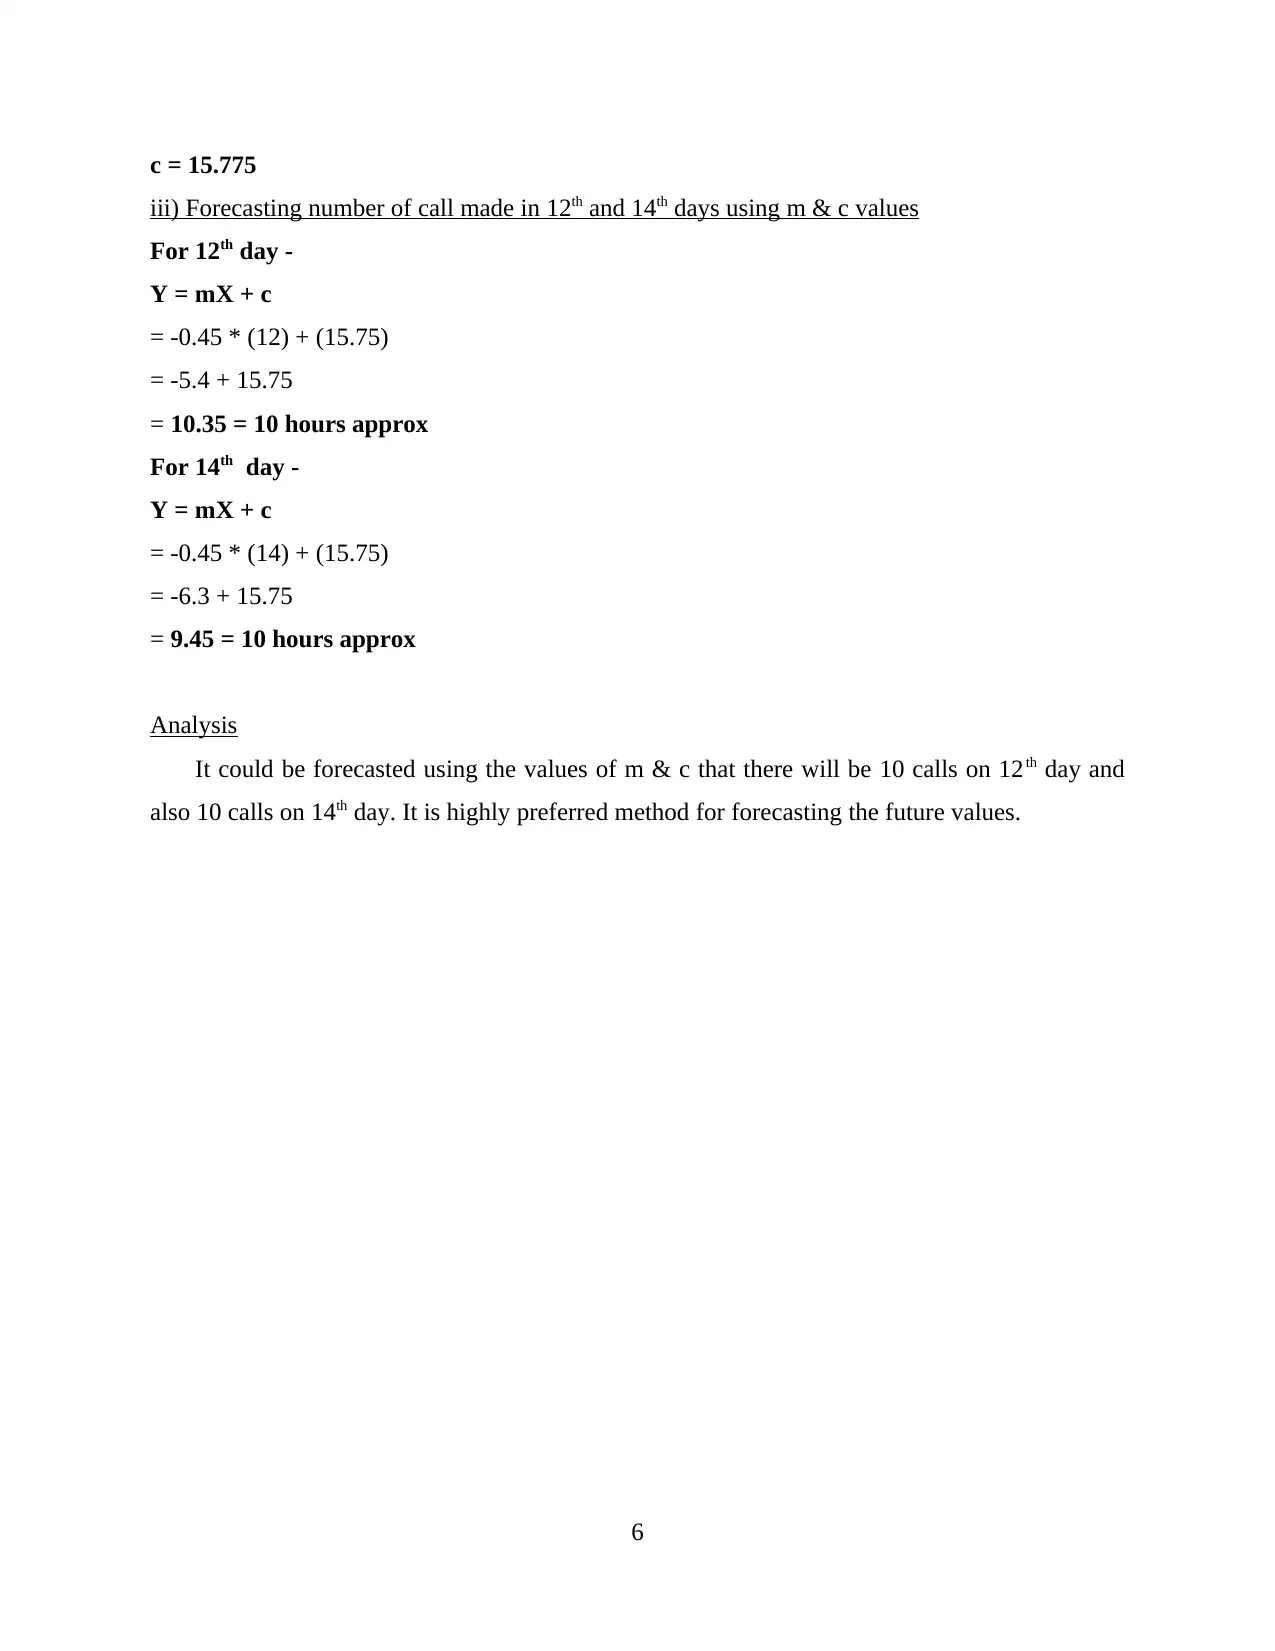
c = 15.775
iii) Forecasting number of call made in 12th and 14th days using m & c values
For 12th day -
Y = mX + c
= -0.45 * (12) + (15.75)
= -5.4 + 15.75
= 10.35 = 10 hours approx
For 14th day -
Y = mX + c
= -0.45 * (14) + (15.75)
= -6.3 + 15.75
= 9.45 = 10 hours approx
Analysis
It could be forecasted using the values of m & c that there will be 10 calls on 12th day and
also 10 calls on 14th day. It is highly preferred method for forecasting the future values.
6
REFERENCES
Books and Journals
Krickeberg, K., Van Trong, P. and Hanh, P.T.M., 2019. Descriptive Data Analysis and Statistics.
In Epidemiology (pp. 111-123). Springer, Cham.
Brix, T.J., and et.al., 2018. ODM Data Analysis—A tool for the automatic validation, monitoring
and generation of generic descriptive statistics of patient data. PloS one. 13(6).
p.e0199242.
Reyes-Urueña, J.M., and et.al., 2018. Estimating the HIV undiagnosed population in Catalonia,
Spain: descriptive and comparative data analysis to identify differences in MSM stratified
by migrant and Spanish-born population. BMJ open. 8(2).
7
⊘ This is a preview!⊘
Do you want full access?
Subscribe today to unlock all pages.
Trusted by 1+ million students worldwide
1 out of 9
Related Documents


Your All-in-One AI-Powered Toolkit for Academic Success.
+13062052269
info@desklib.com
Available 24*7 on WhatsApp / Email
![[object Object]](/_next/static/media/star-bottom.7253800d.svg)
Unlock your academic potential
© 2024 | Zucol Services PVT LTD | All rights reserved.