Data Analysis Report: Numeracy and Wind Speed Analysis in Nottingham
VerifiedAdded on 2021/02/20
|8
|1467
|32
Report
AI Summary
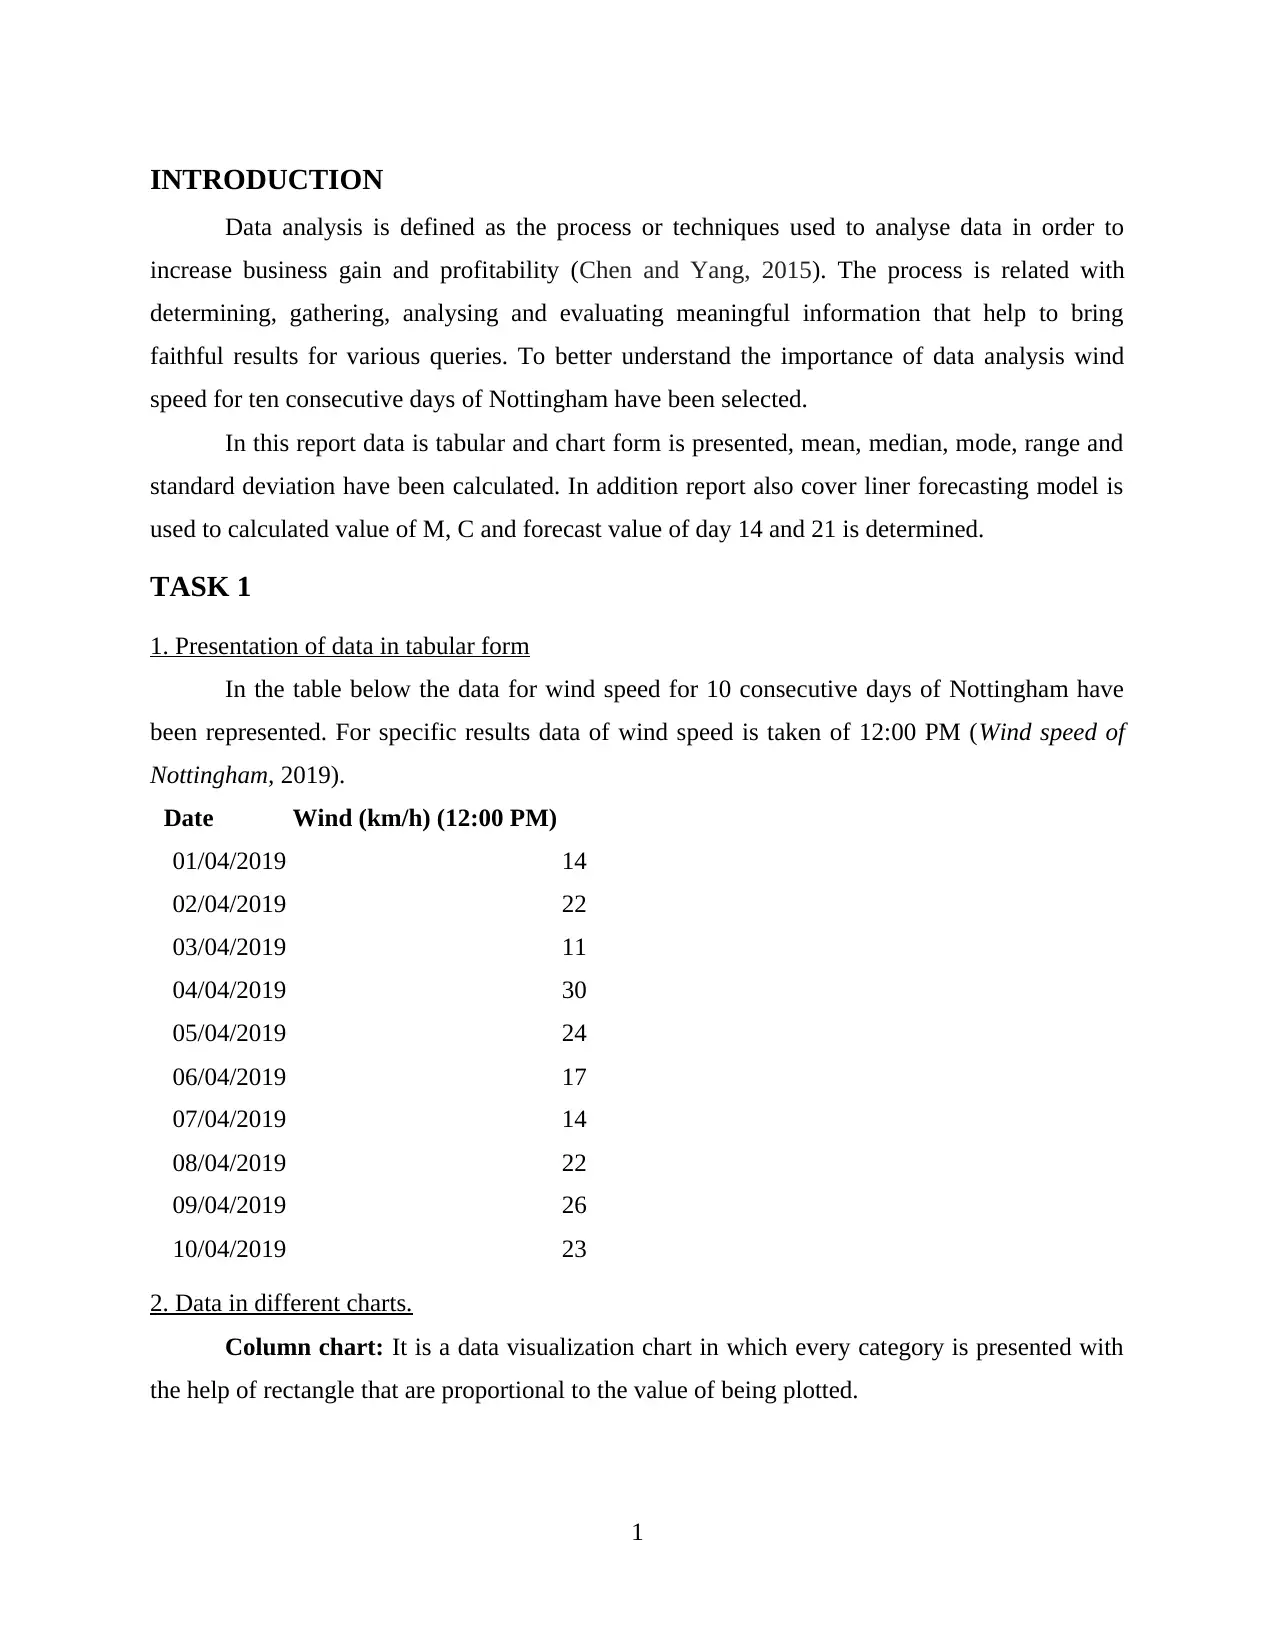
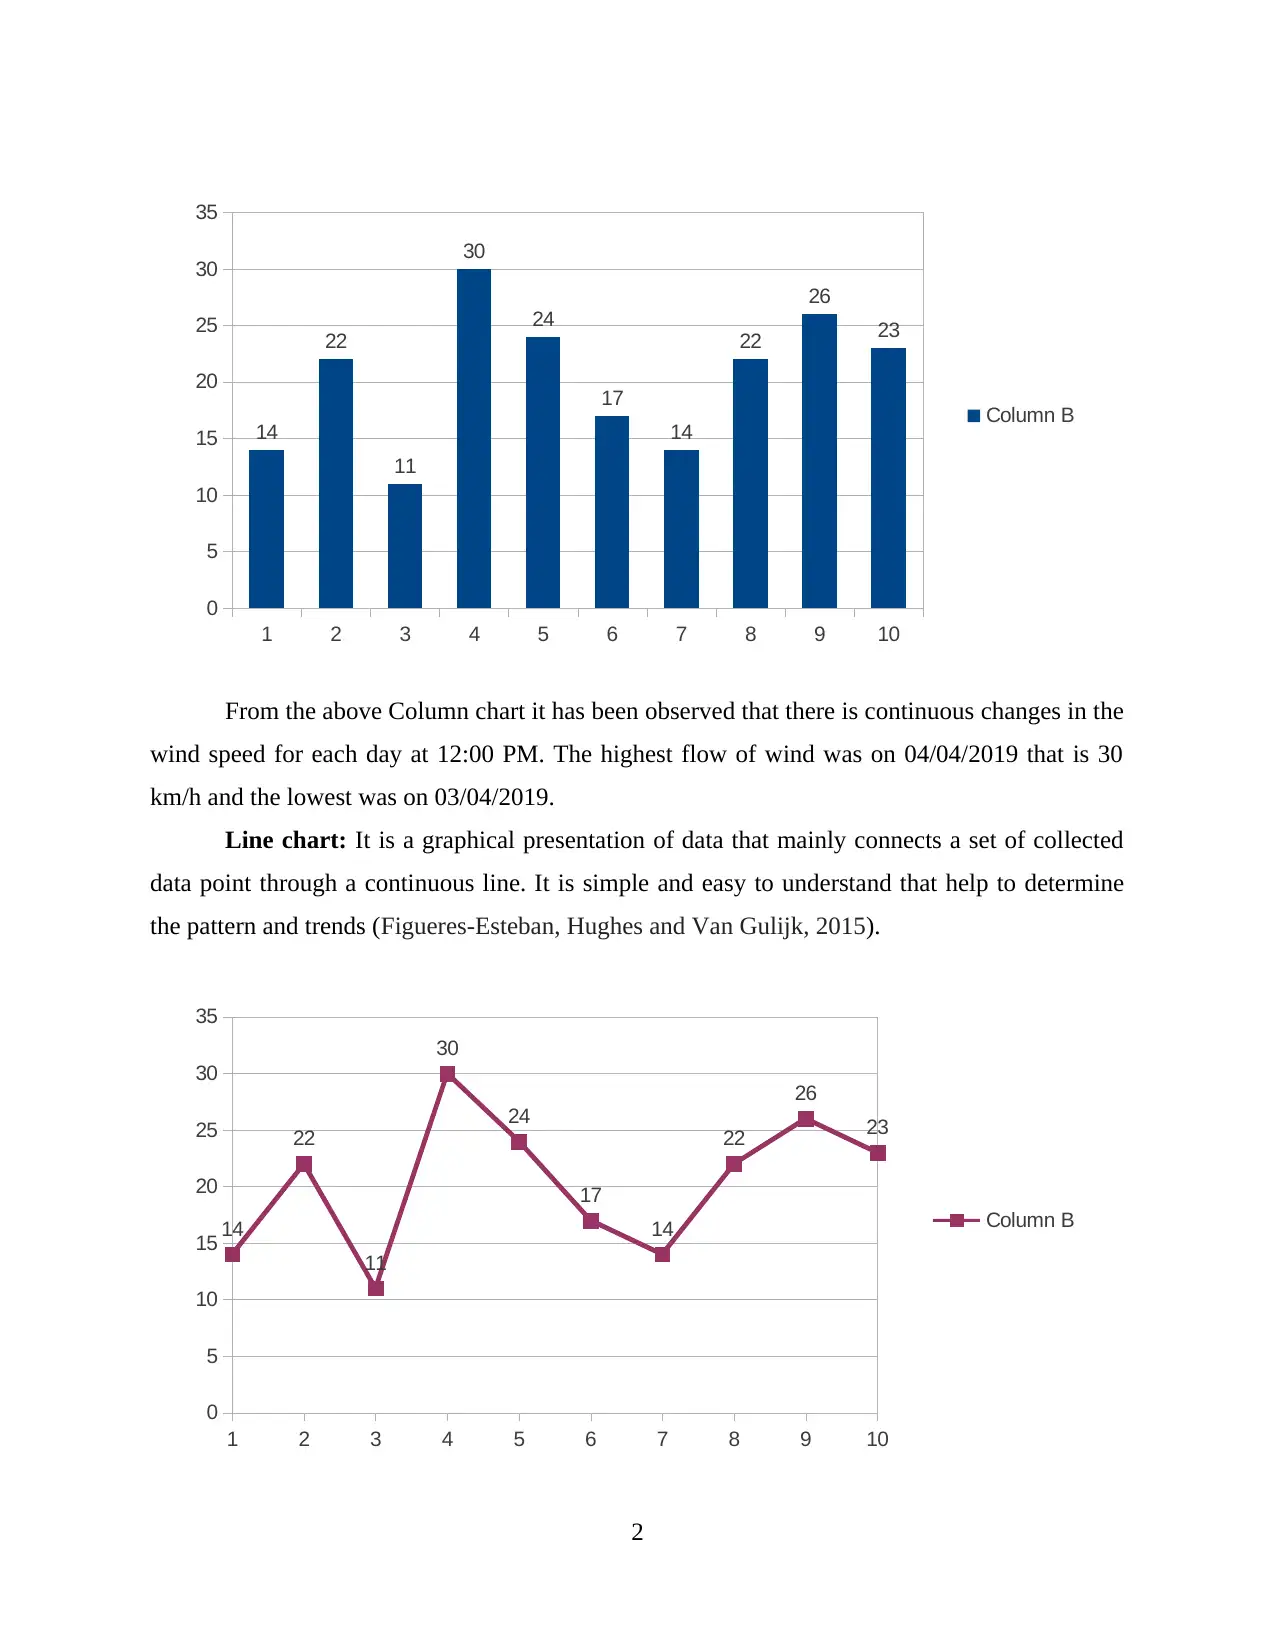
This report presents a comprehensive data analysis of wind speed in Nottingham over a ten-day period. The analysis begins with the presentation of data in tabular and chart formats, including column and line charts, to visualize the wind speed variations. The report then delves into the calculation of key statistical measures such as mean, median, mode, range, and standard deviation to understand the central tendencies and data dispersion. Furthermore, a linear forecasting model is employed to calculate the values of 'M' and 'C,' enabling the prediction of wind speed for days 14 and 21. The report concludes by summarizing the findings and emphasizing the importance of data analysis in informed decision-making. The report uses data from April 2019 to provide a detailed understanding of wind speed patterns and forecasting techniques.
1 out of 8
Related Documents


Your All-in-One AI-Powered Toolkit for Academic Success.
+13062052269
info@desklib.com
Available 24*7 on WhatsApp / Email
![[object Object]](/_next/static/media/star-bottom.7253800d.svg)
Copyright © 2020–2026 A2Z Services. All Rights Reserved. Developed and managed by ZUCOL.