Data Analysis of Expenditure and Linear Forecasting Assignment
VerifiedAdded on 2022/12/28
|12
|1548
|90
Homework Assignment
AI Summary
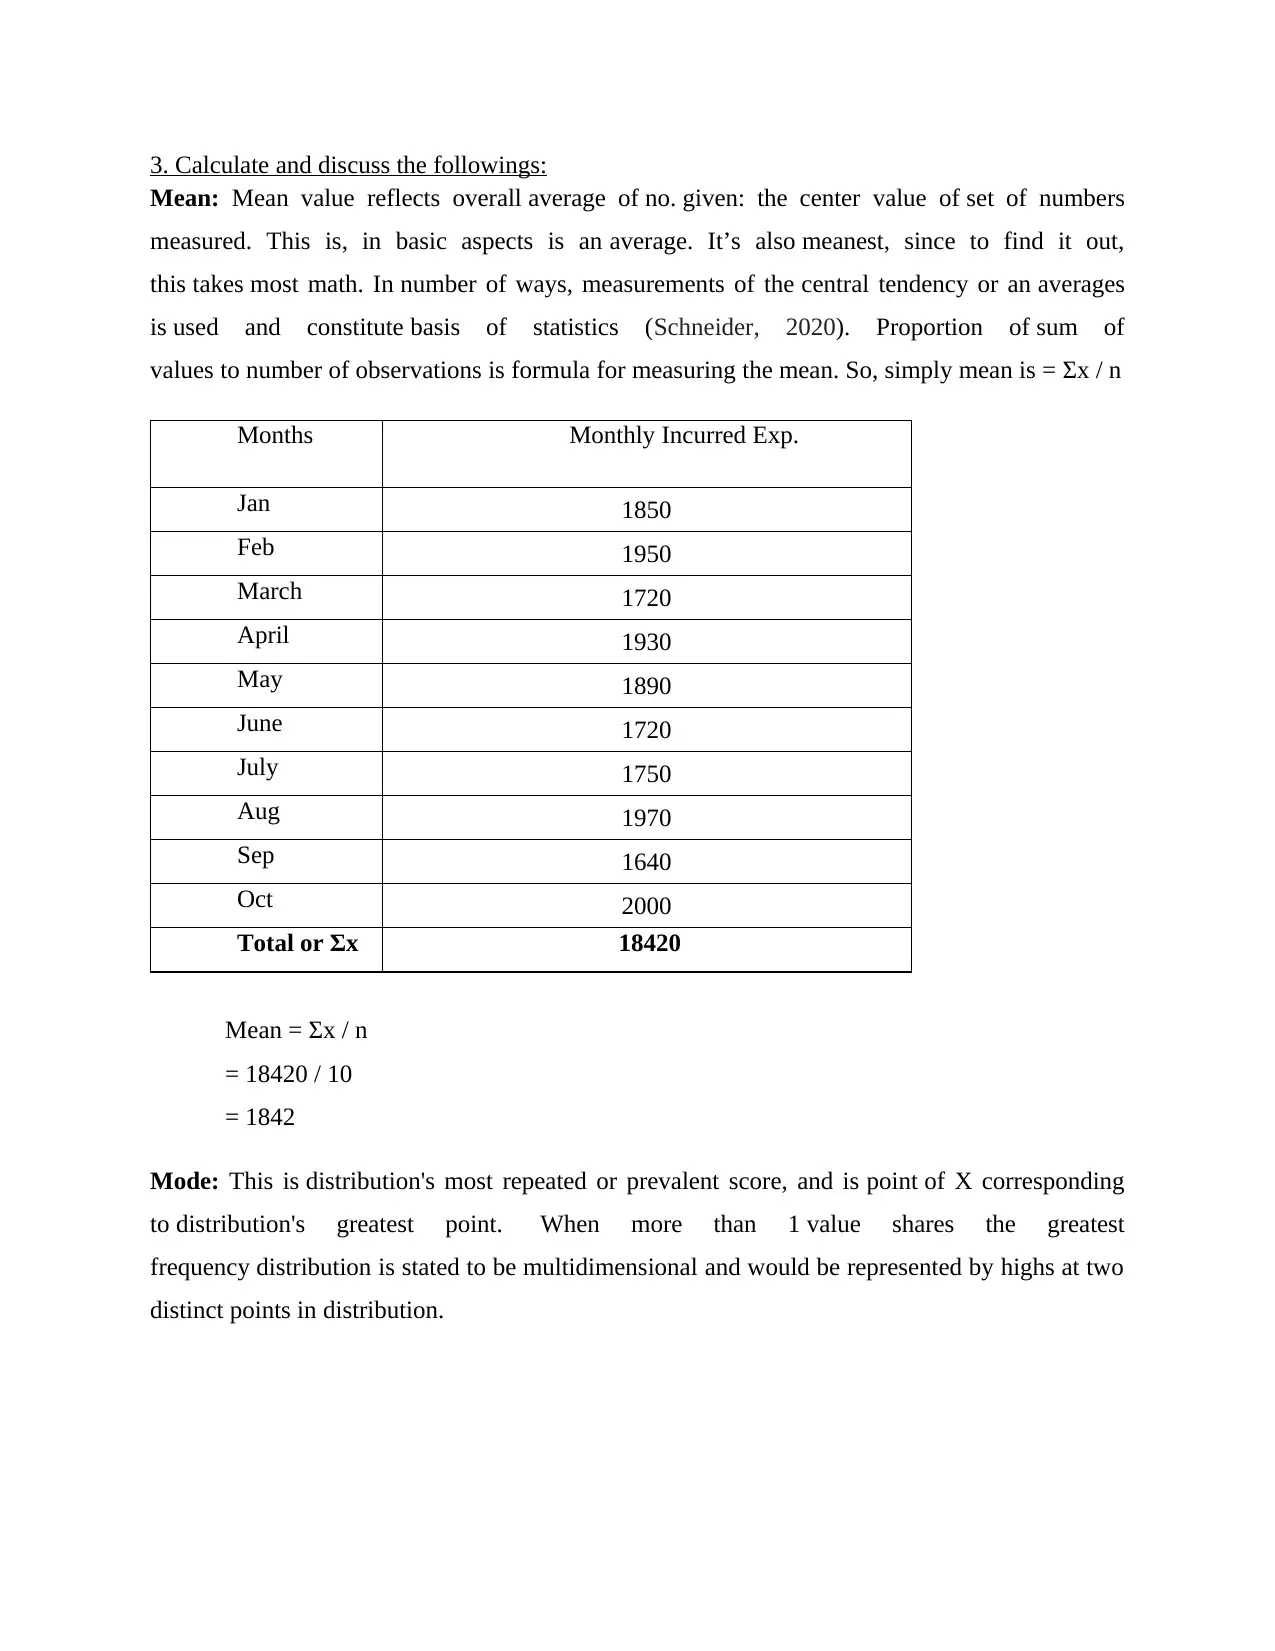
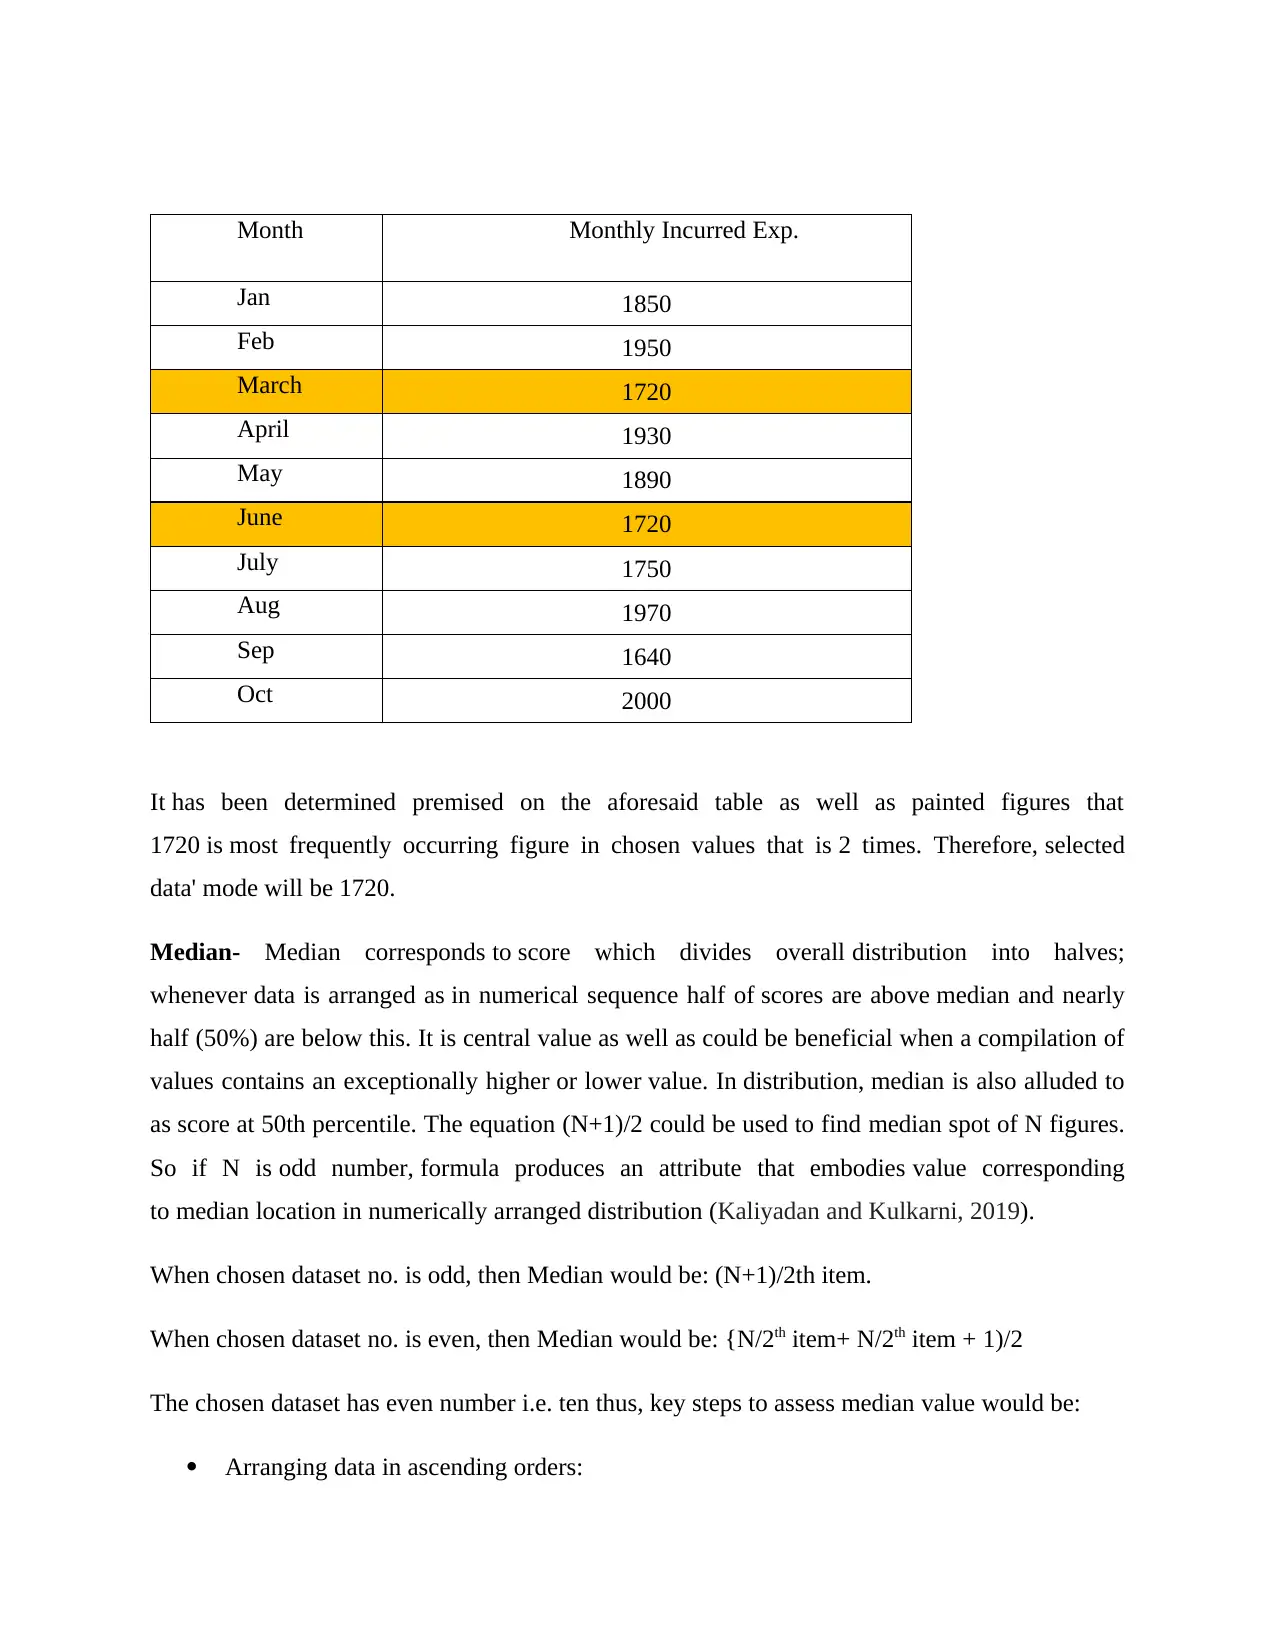
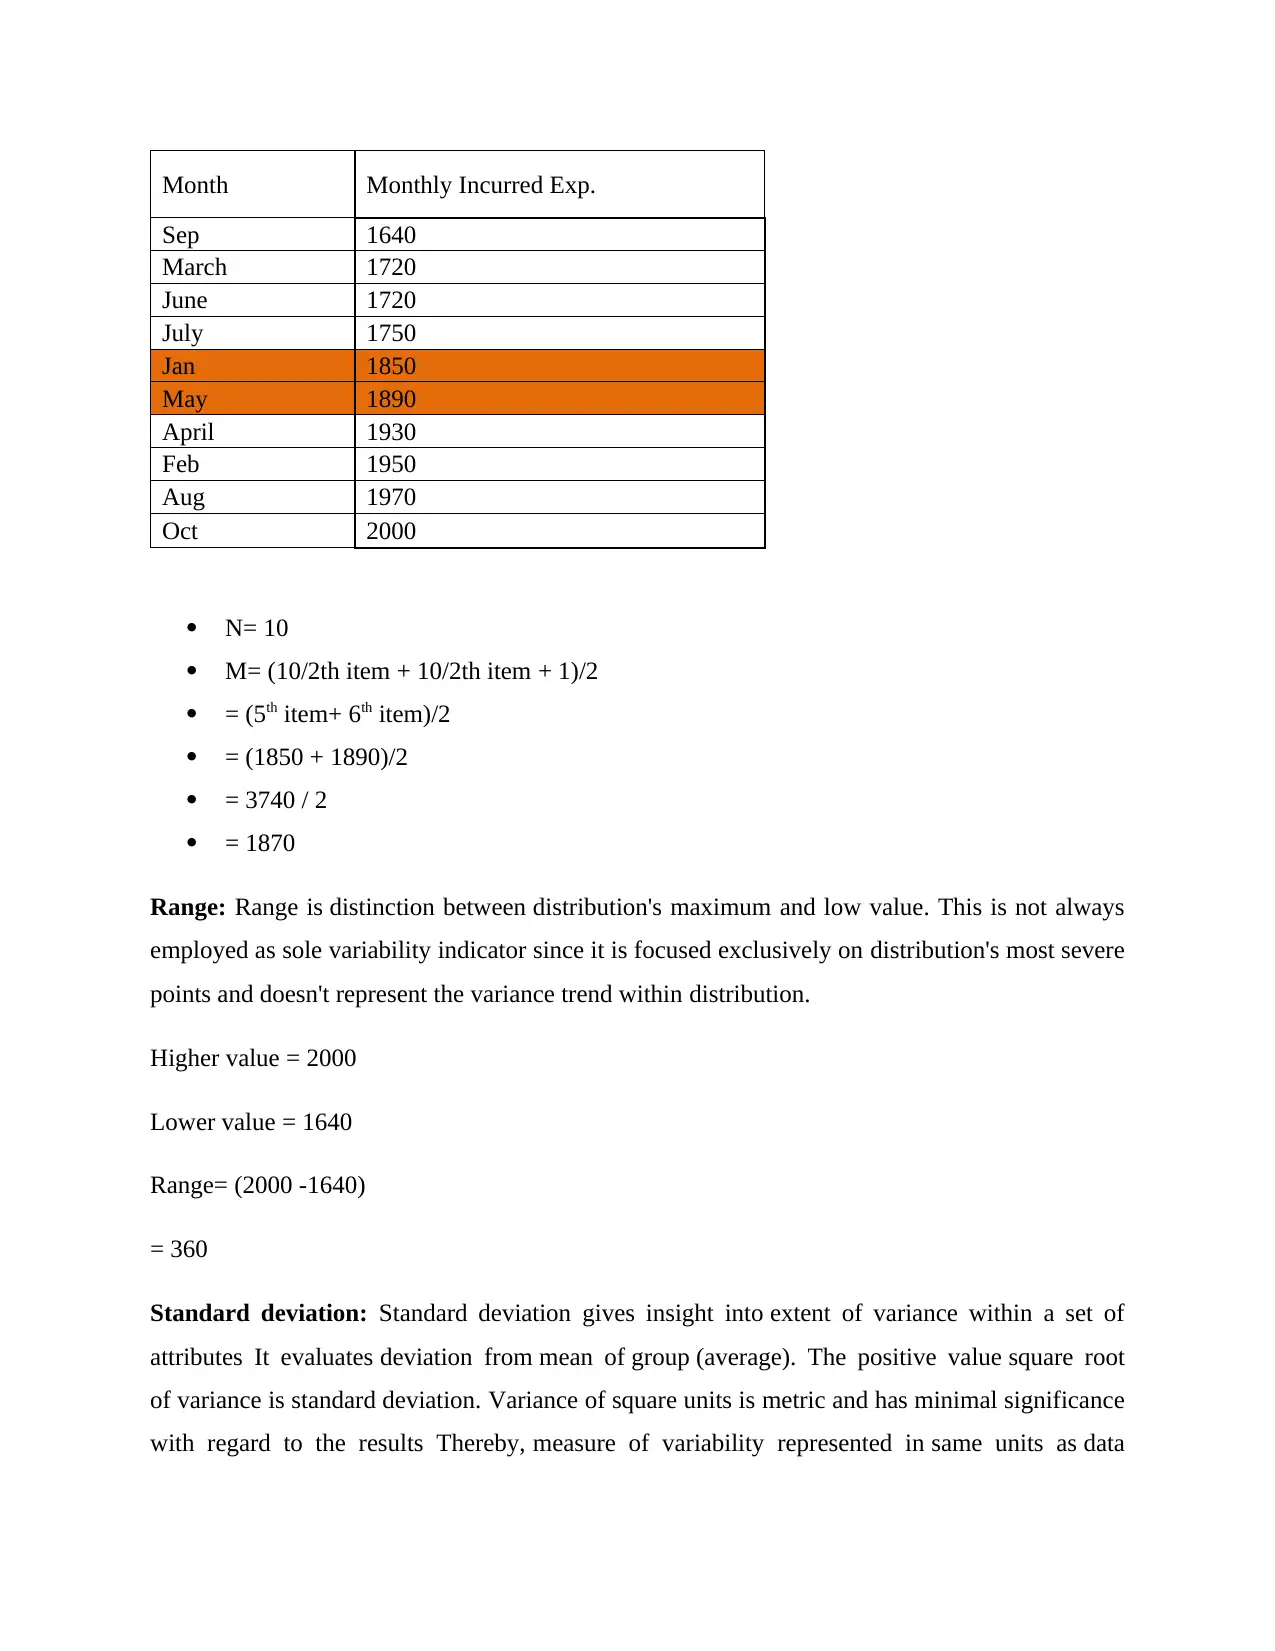
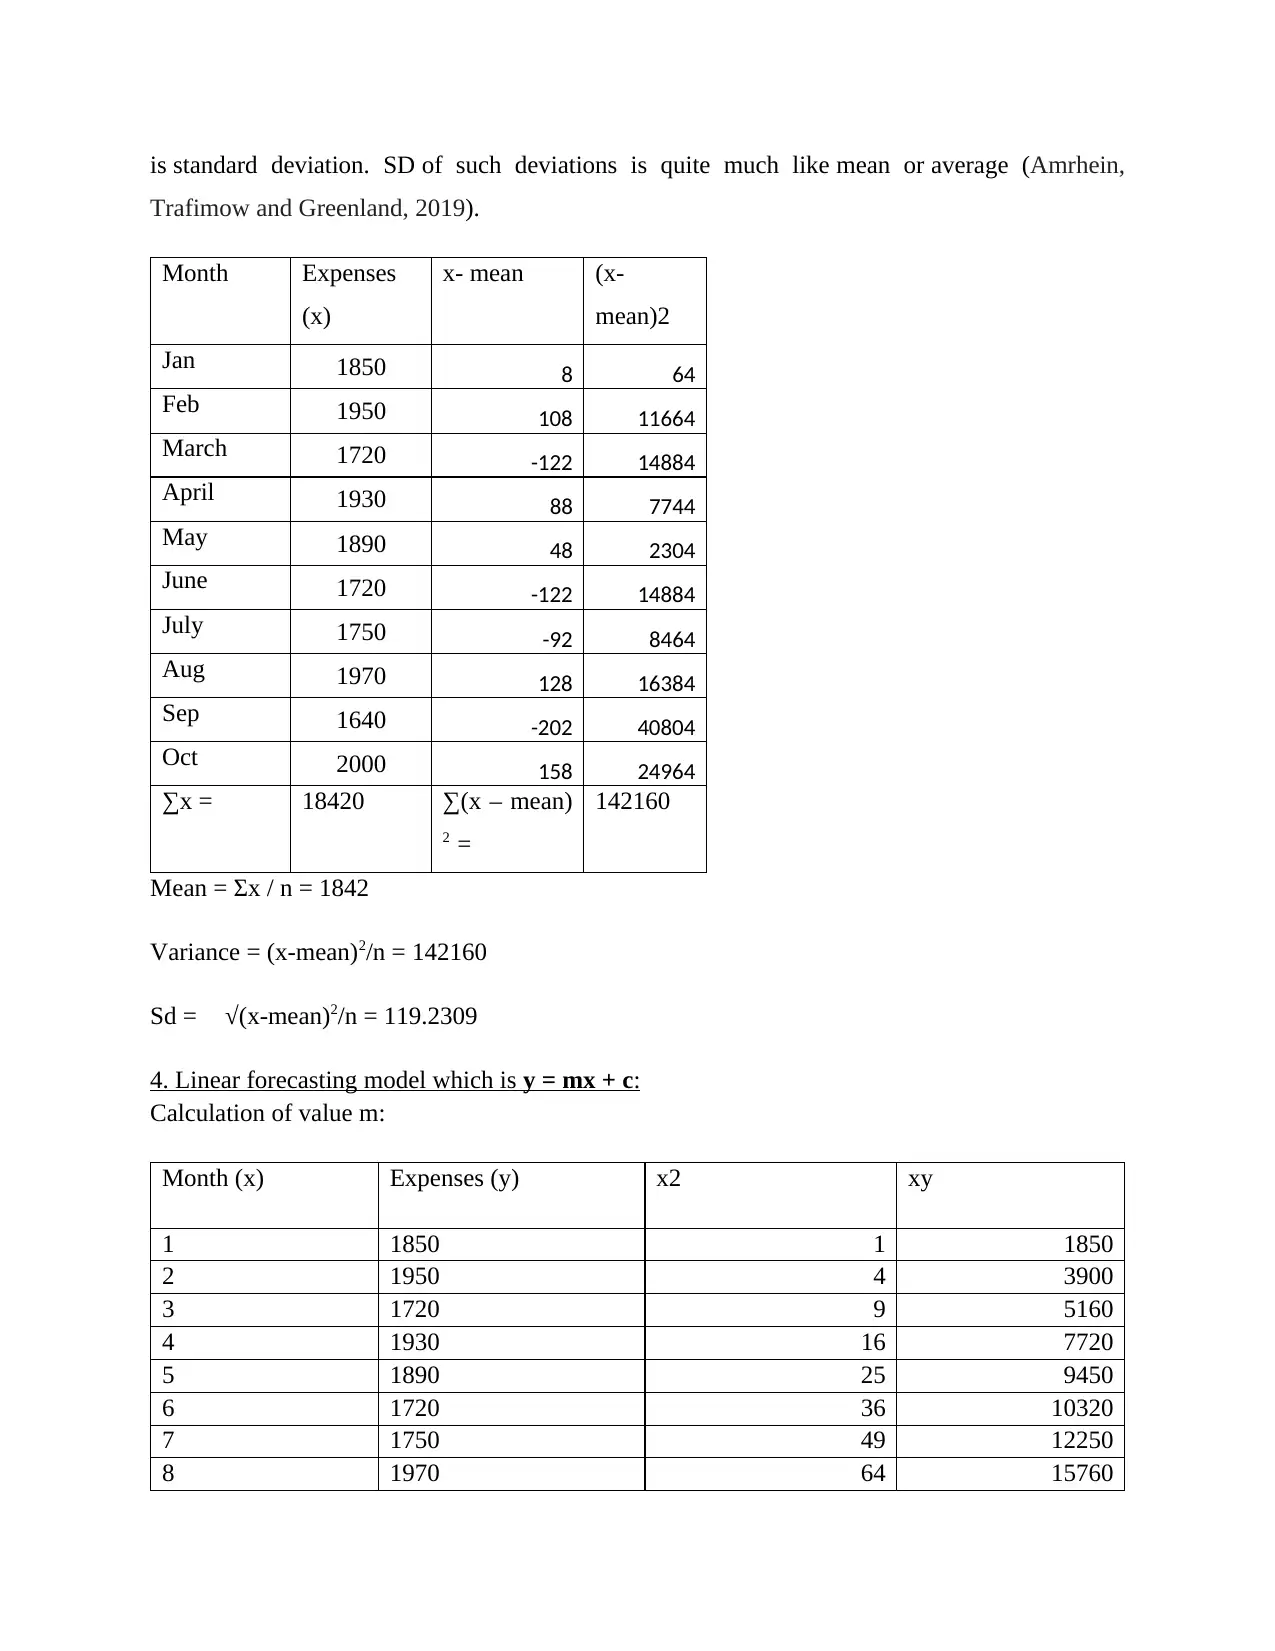
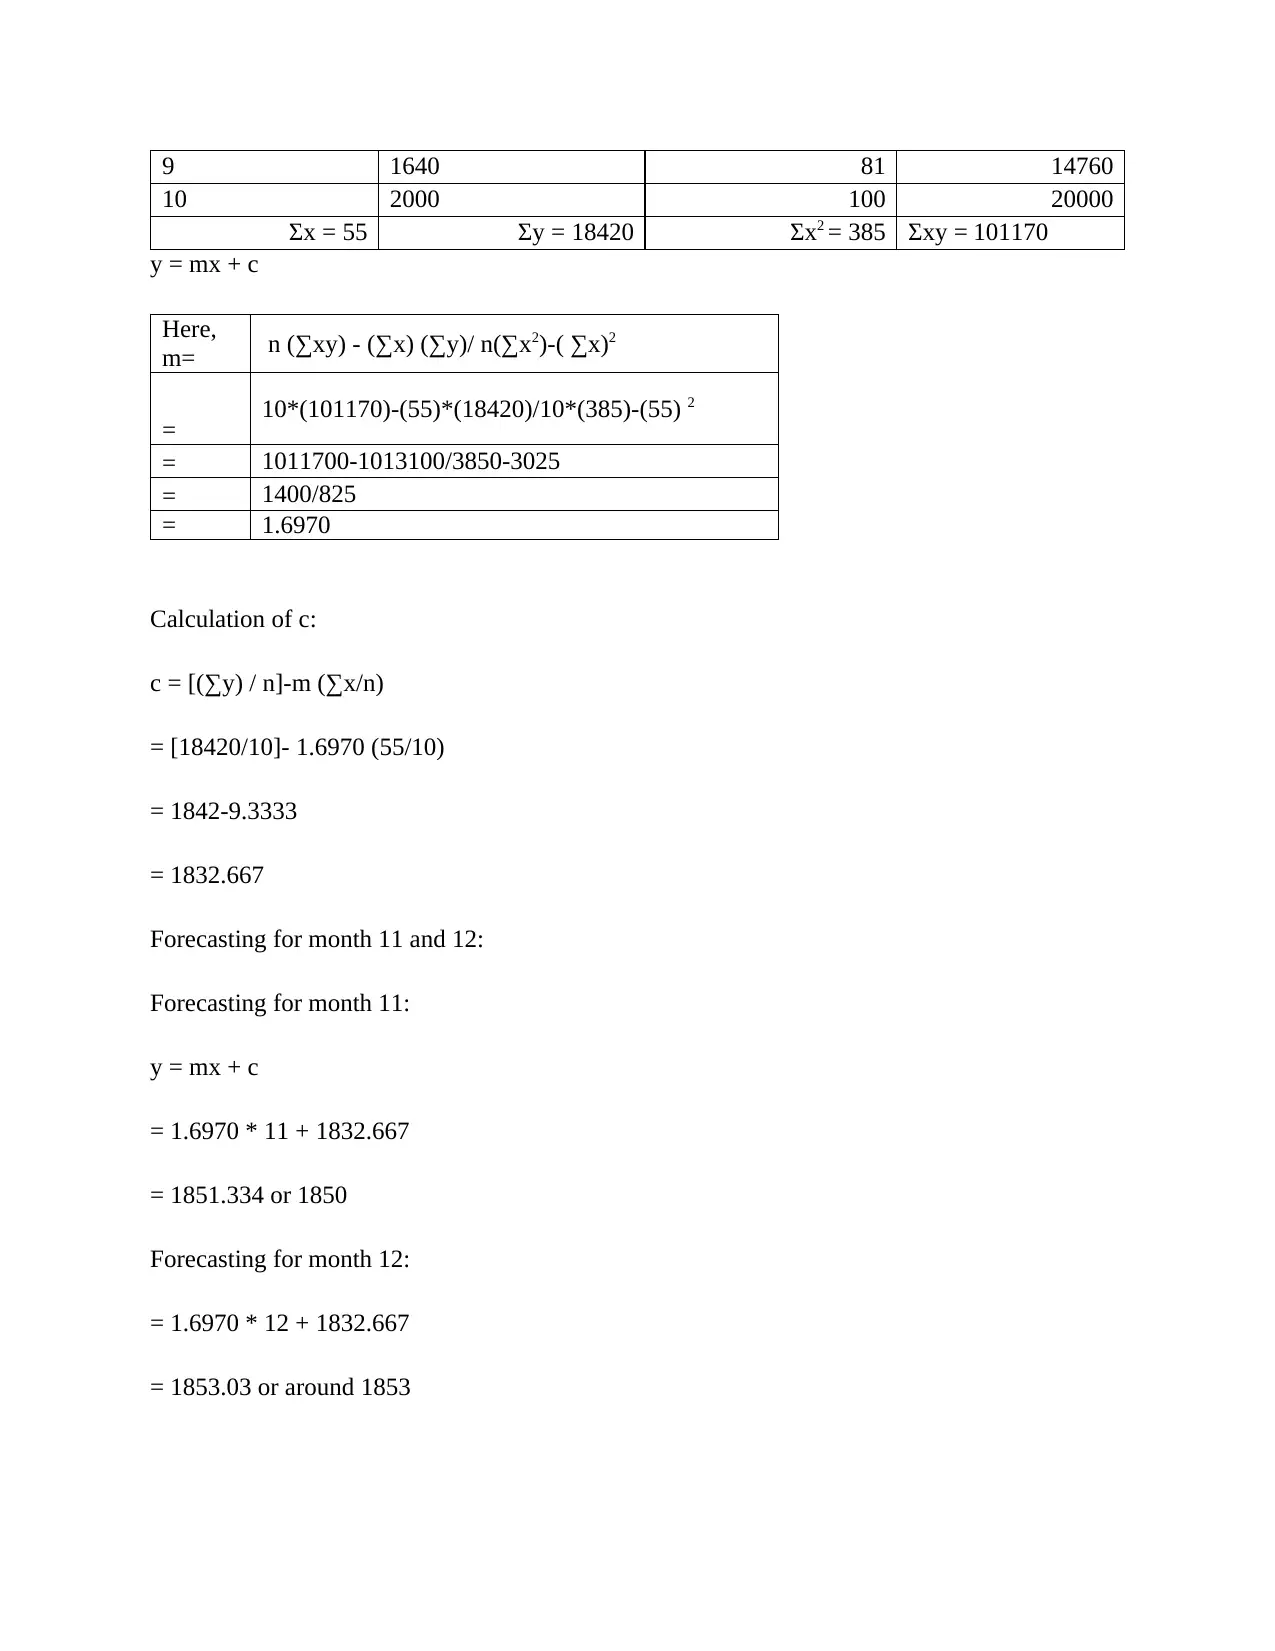
This assignment delves into the realm of data analysis, focusing on the practical application of statistical methods to analyze expenditure data over a ten-month period. The report begins by presenting the data in both tabular and graphical formats, utilizing column and bar charts to visualize expenditure trends. Key statistical concepts such as mean, mode, median, range, and standard deviation are calculated and discussed, providing a comprehensive understanding of the data's characteristics. Furthermore, the assignment incorporates a linear forecasting model to predict expenditures for the eleventh and twelfth months, demonstrating the predictive capabilities of data analysis. The conclusion summarizes the findings and emphasizes the importance of data analysis in informed decision-making within a business context. References to relevant books and journals are included to support the analysis and findings.

1 out of 12
Related Documents


Your All-in-One AI-Powered Toolkit for Academic Success.
+13062052269
info@desklib.com
Available 24*7 on WhatsApp / Email
![[object Object]](/_next/static/media/star-bottom.7253800d.svg)
Copyright © 2020–2026 A2Z Services. All Rights Reserved. Developed and managed by ZUCOL.