Numeracy and Data Analysis: Analysis of Liverpool's Humidity Data
VerifiedAdded on 2023/01/16
|11
|1615
|65
Homework Assignment
AI Summary
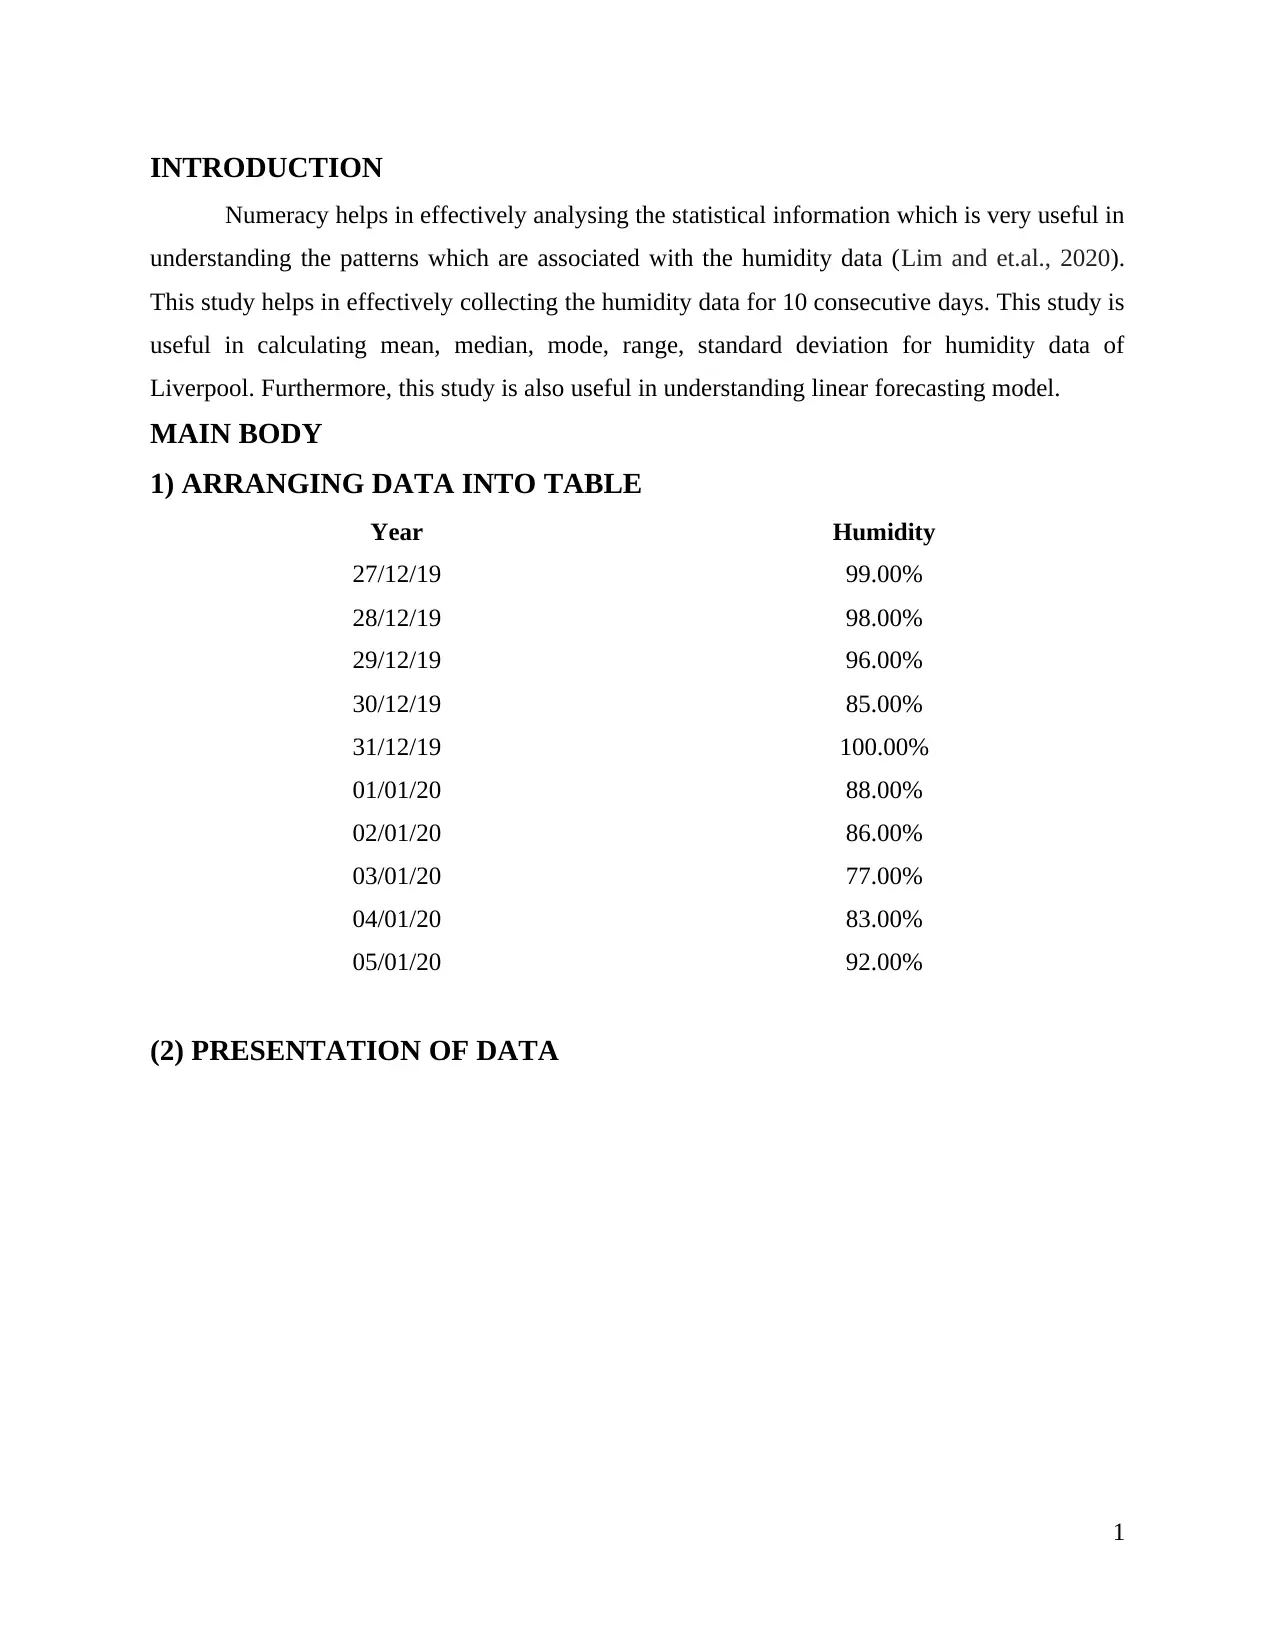
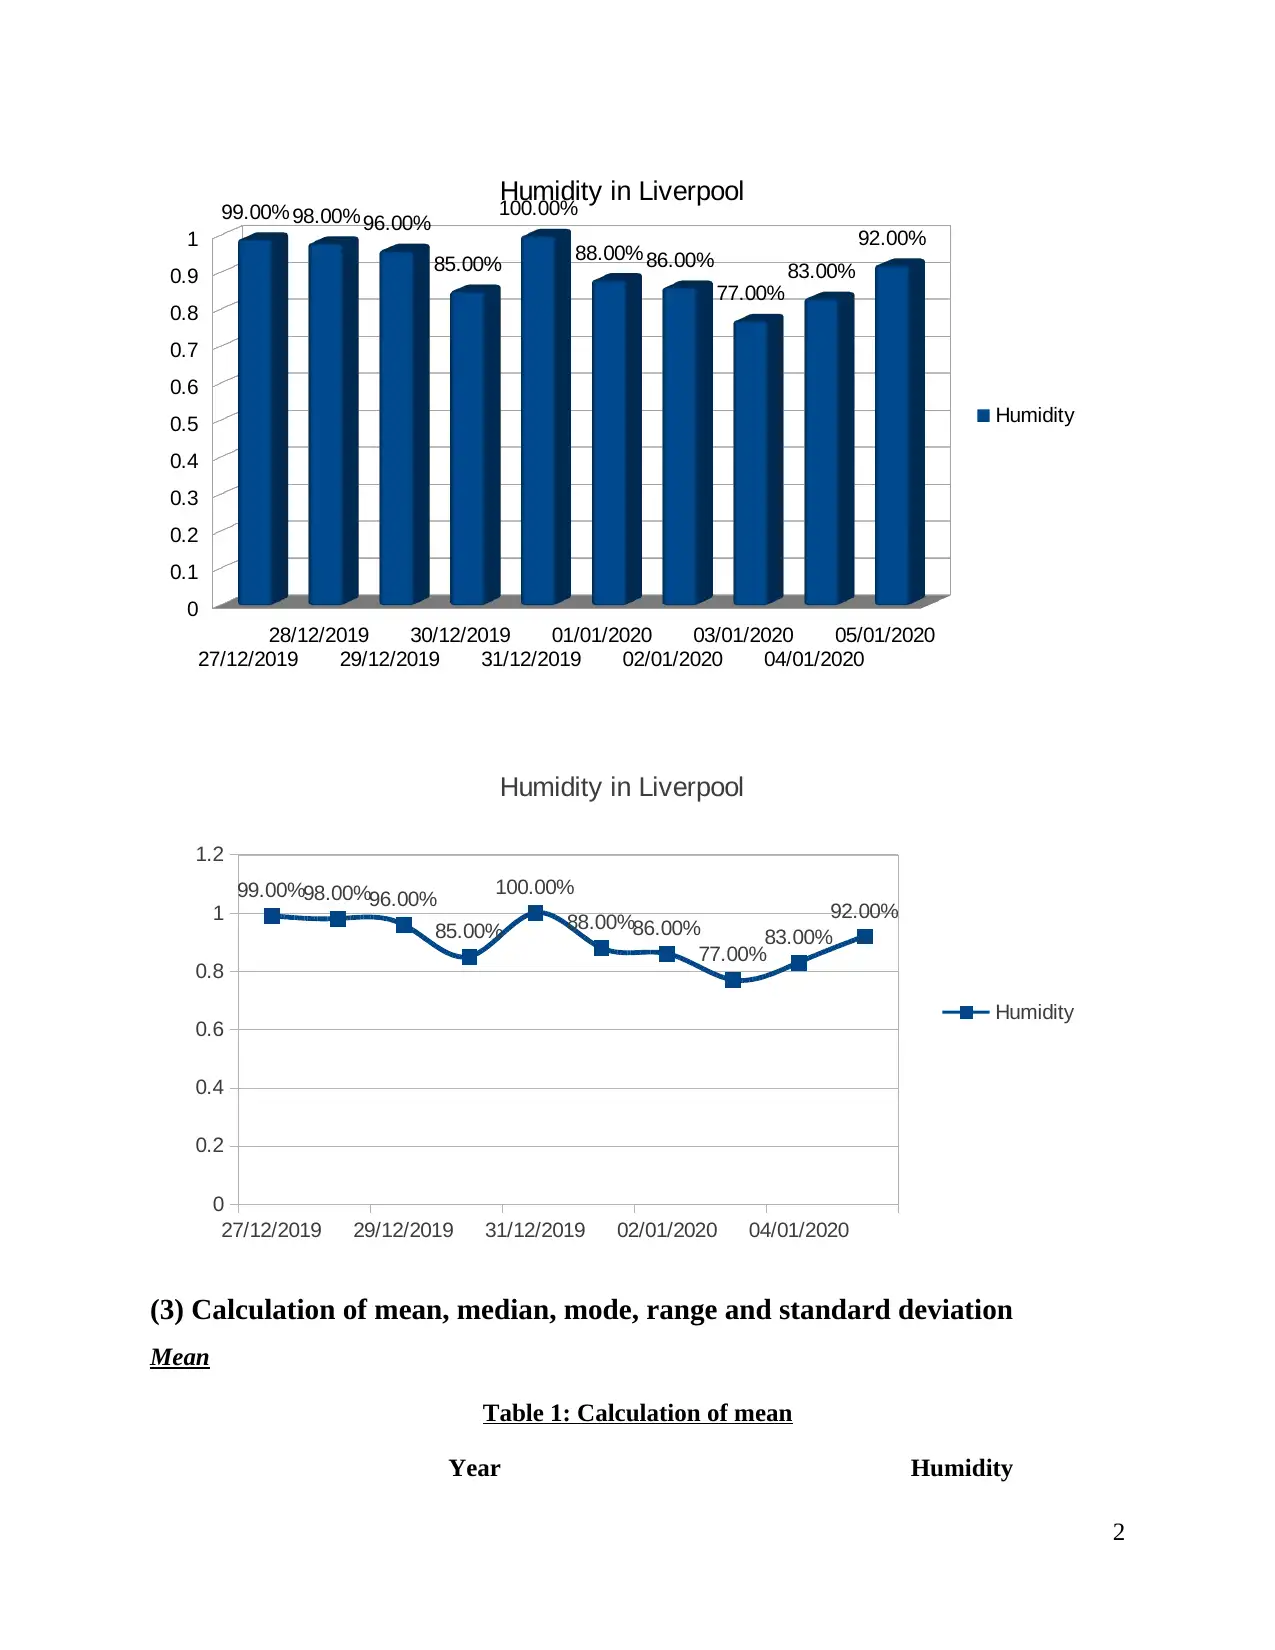
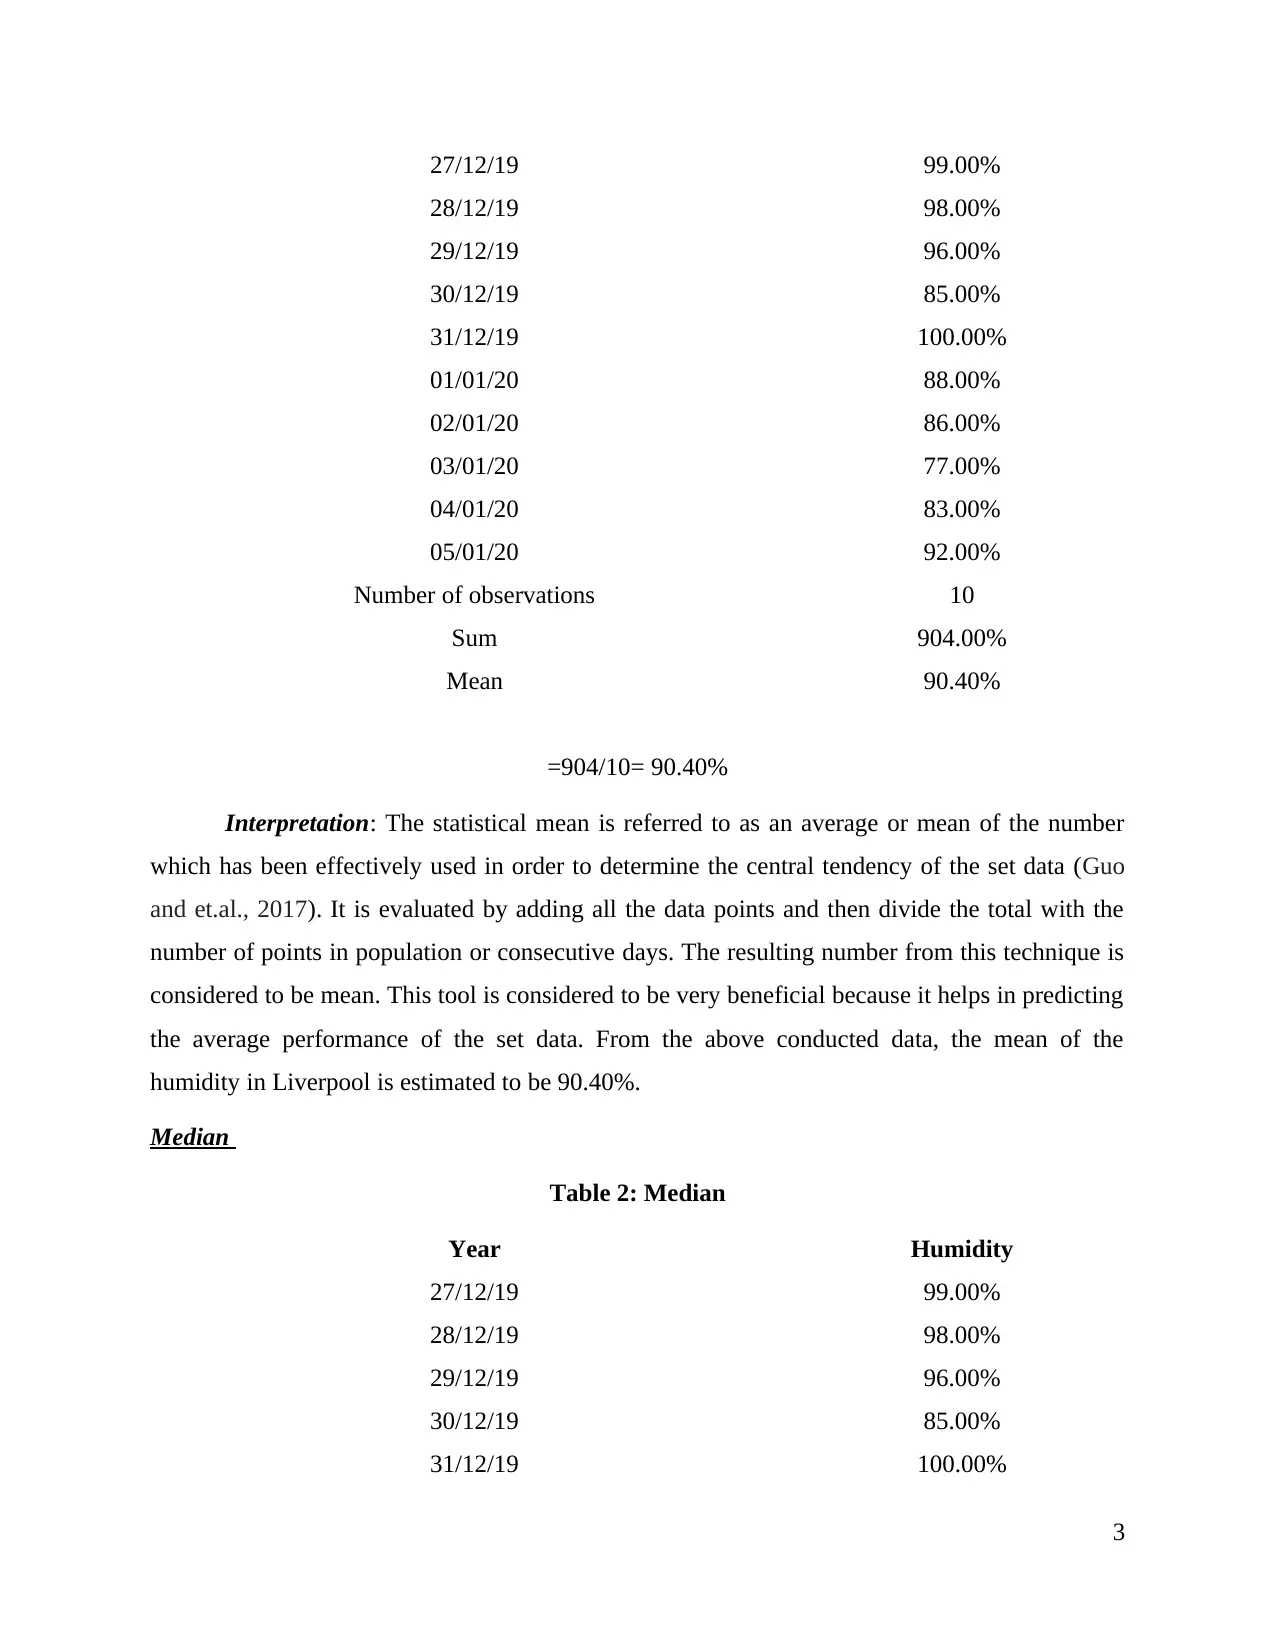
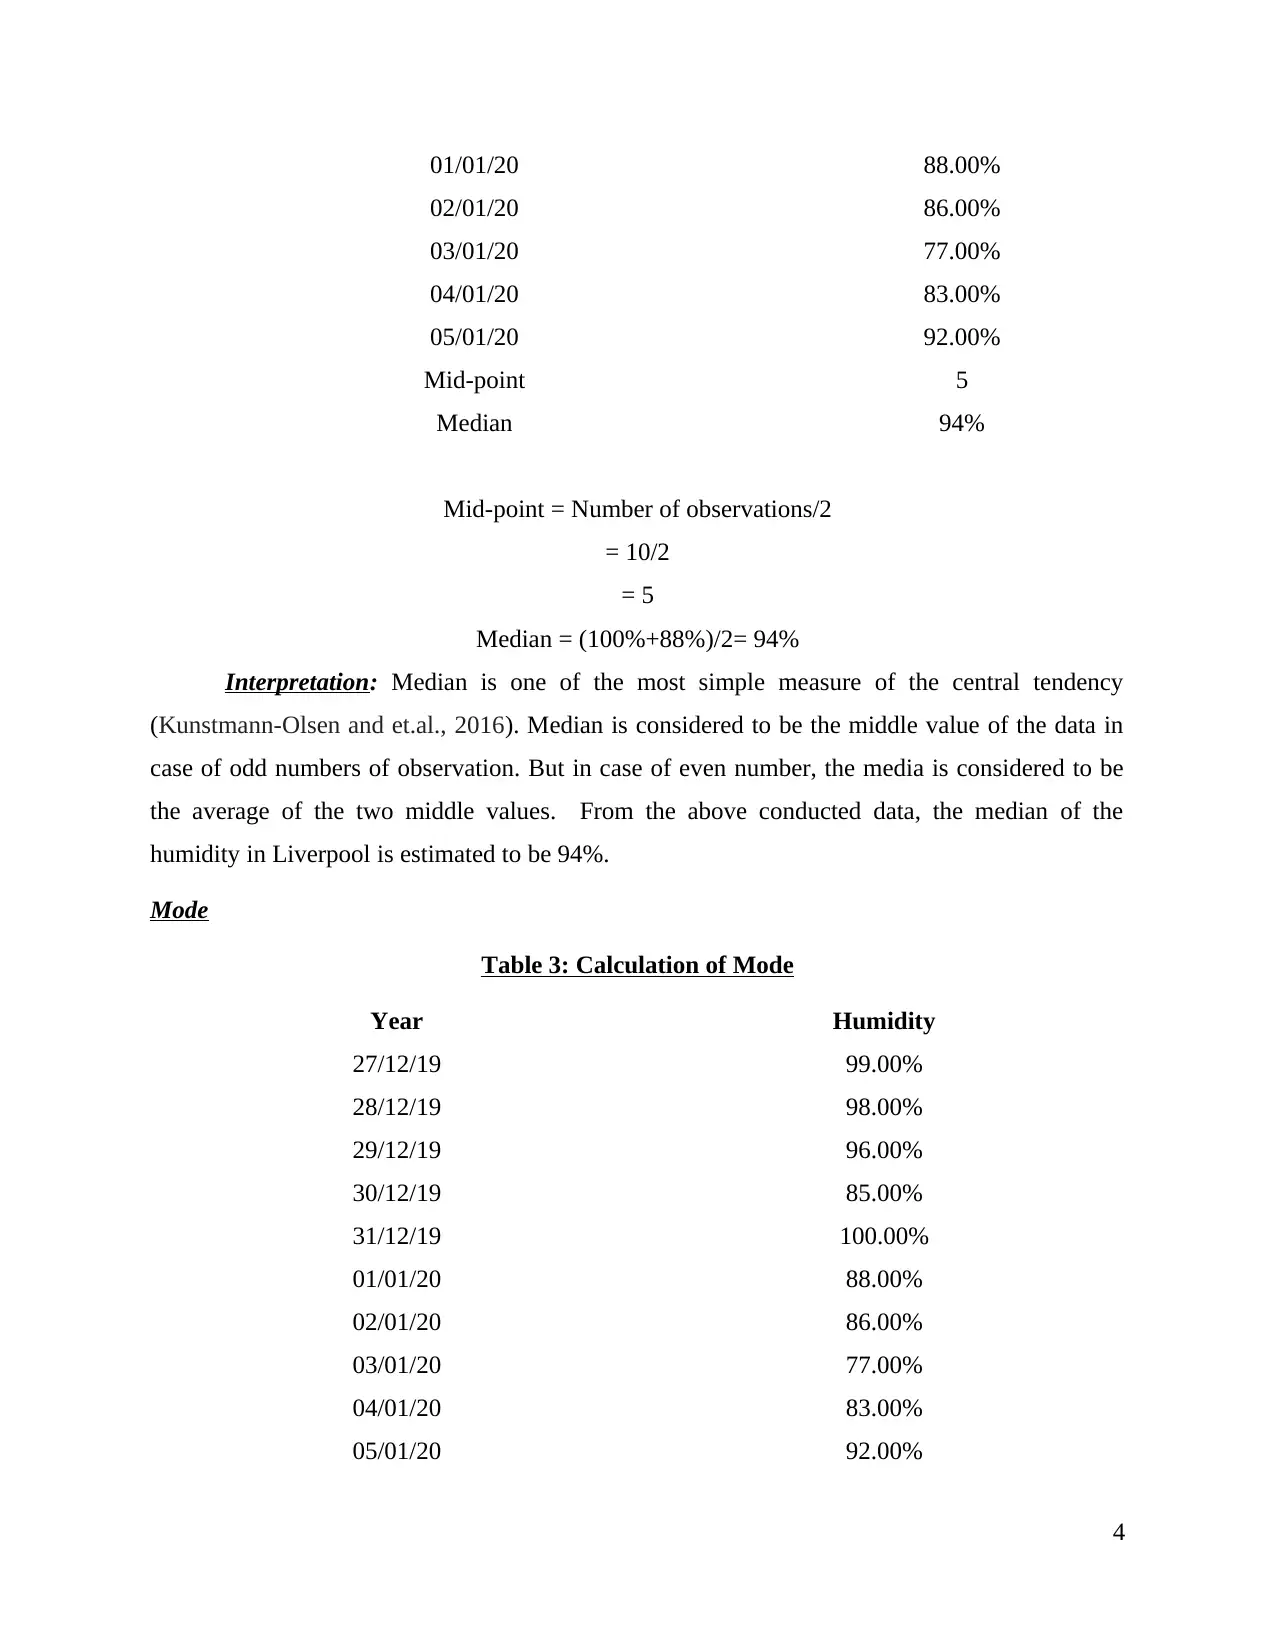
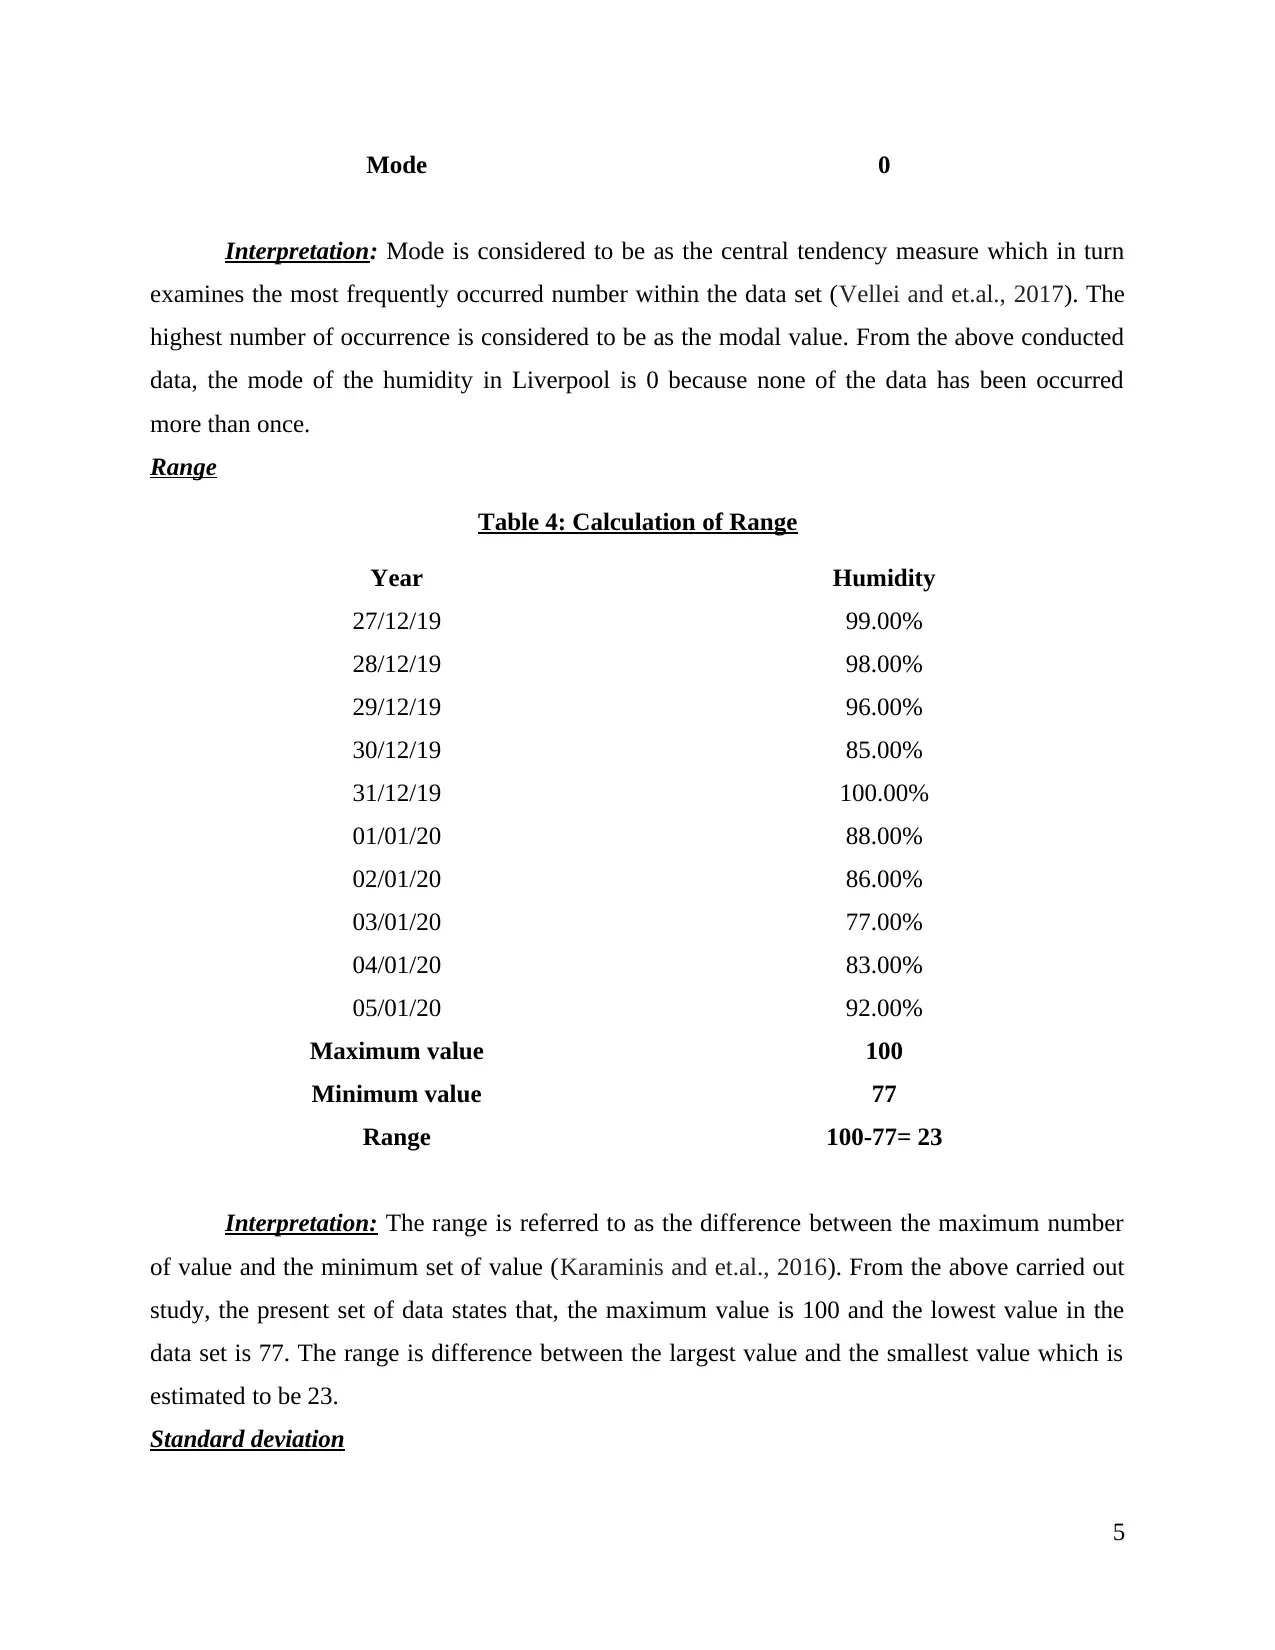
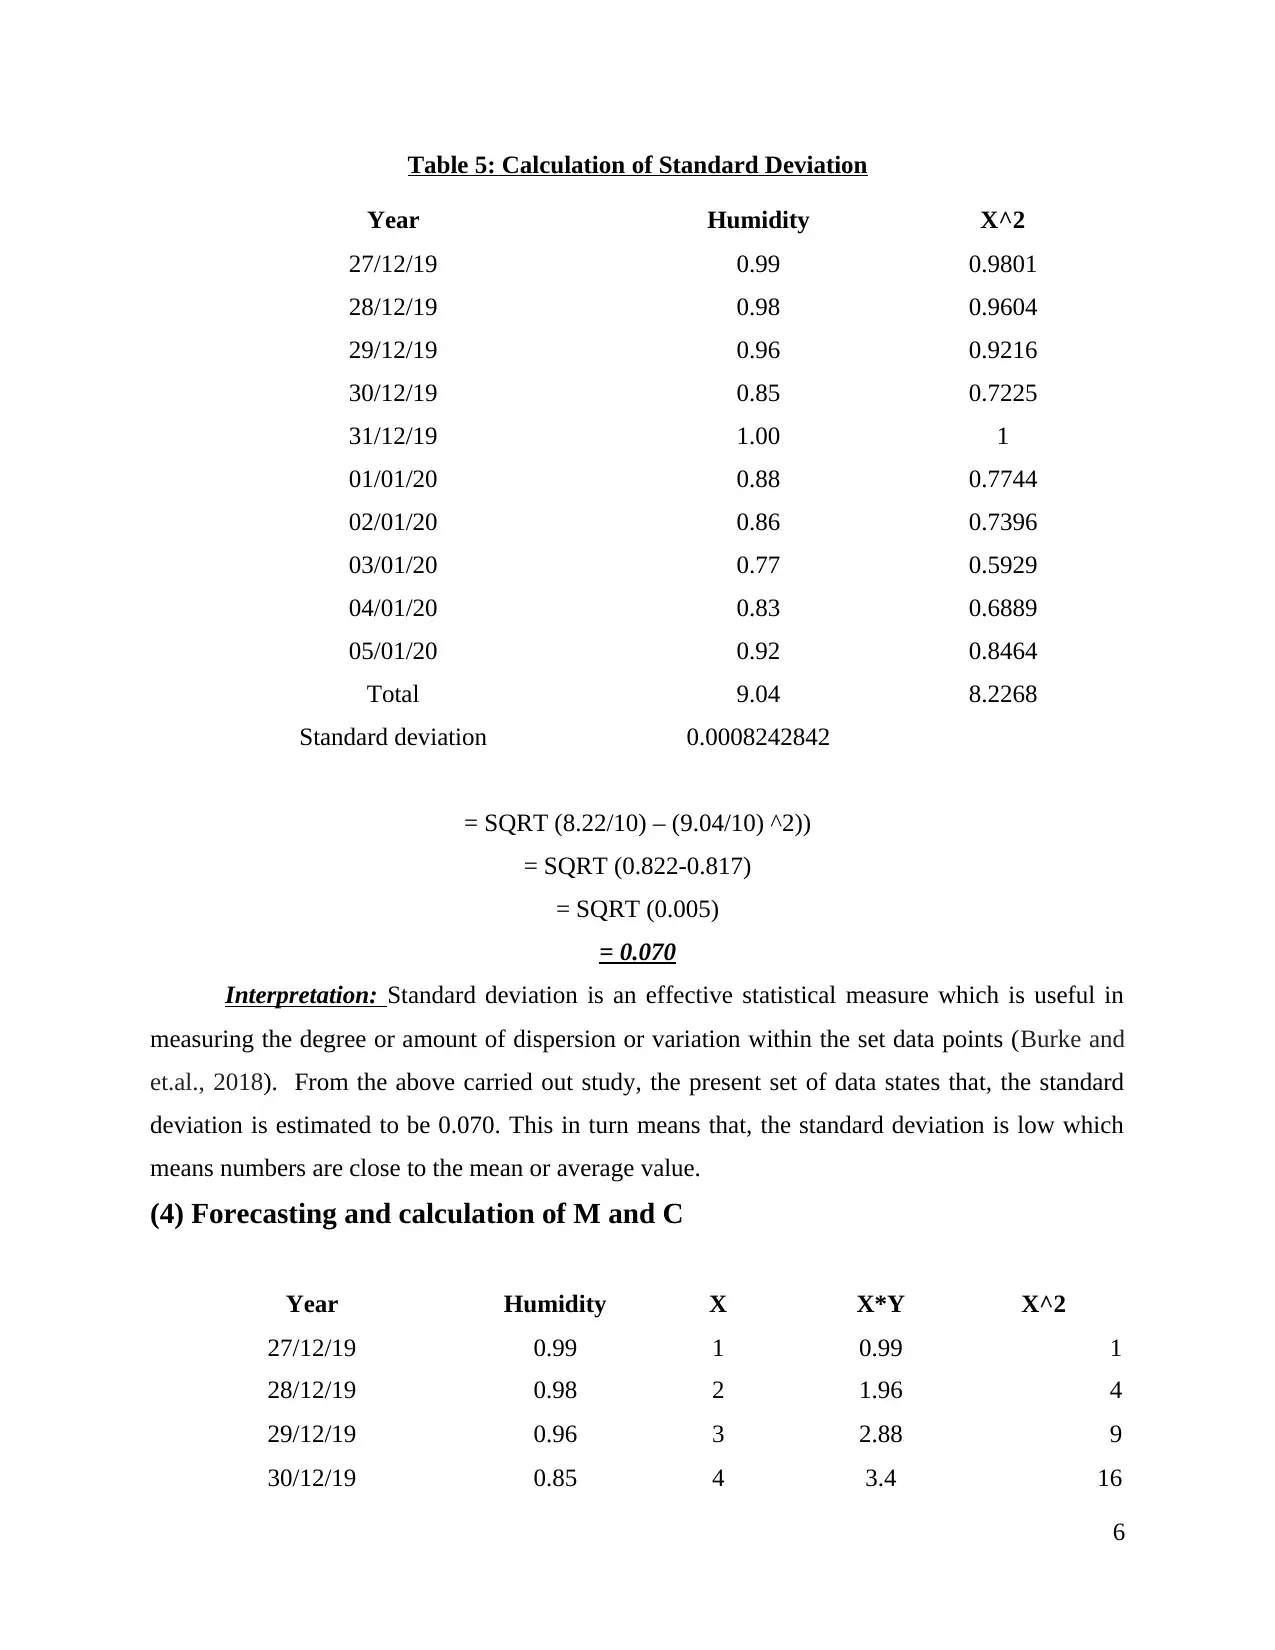
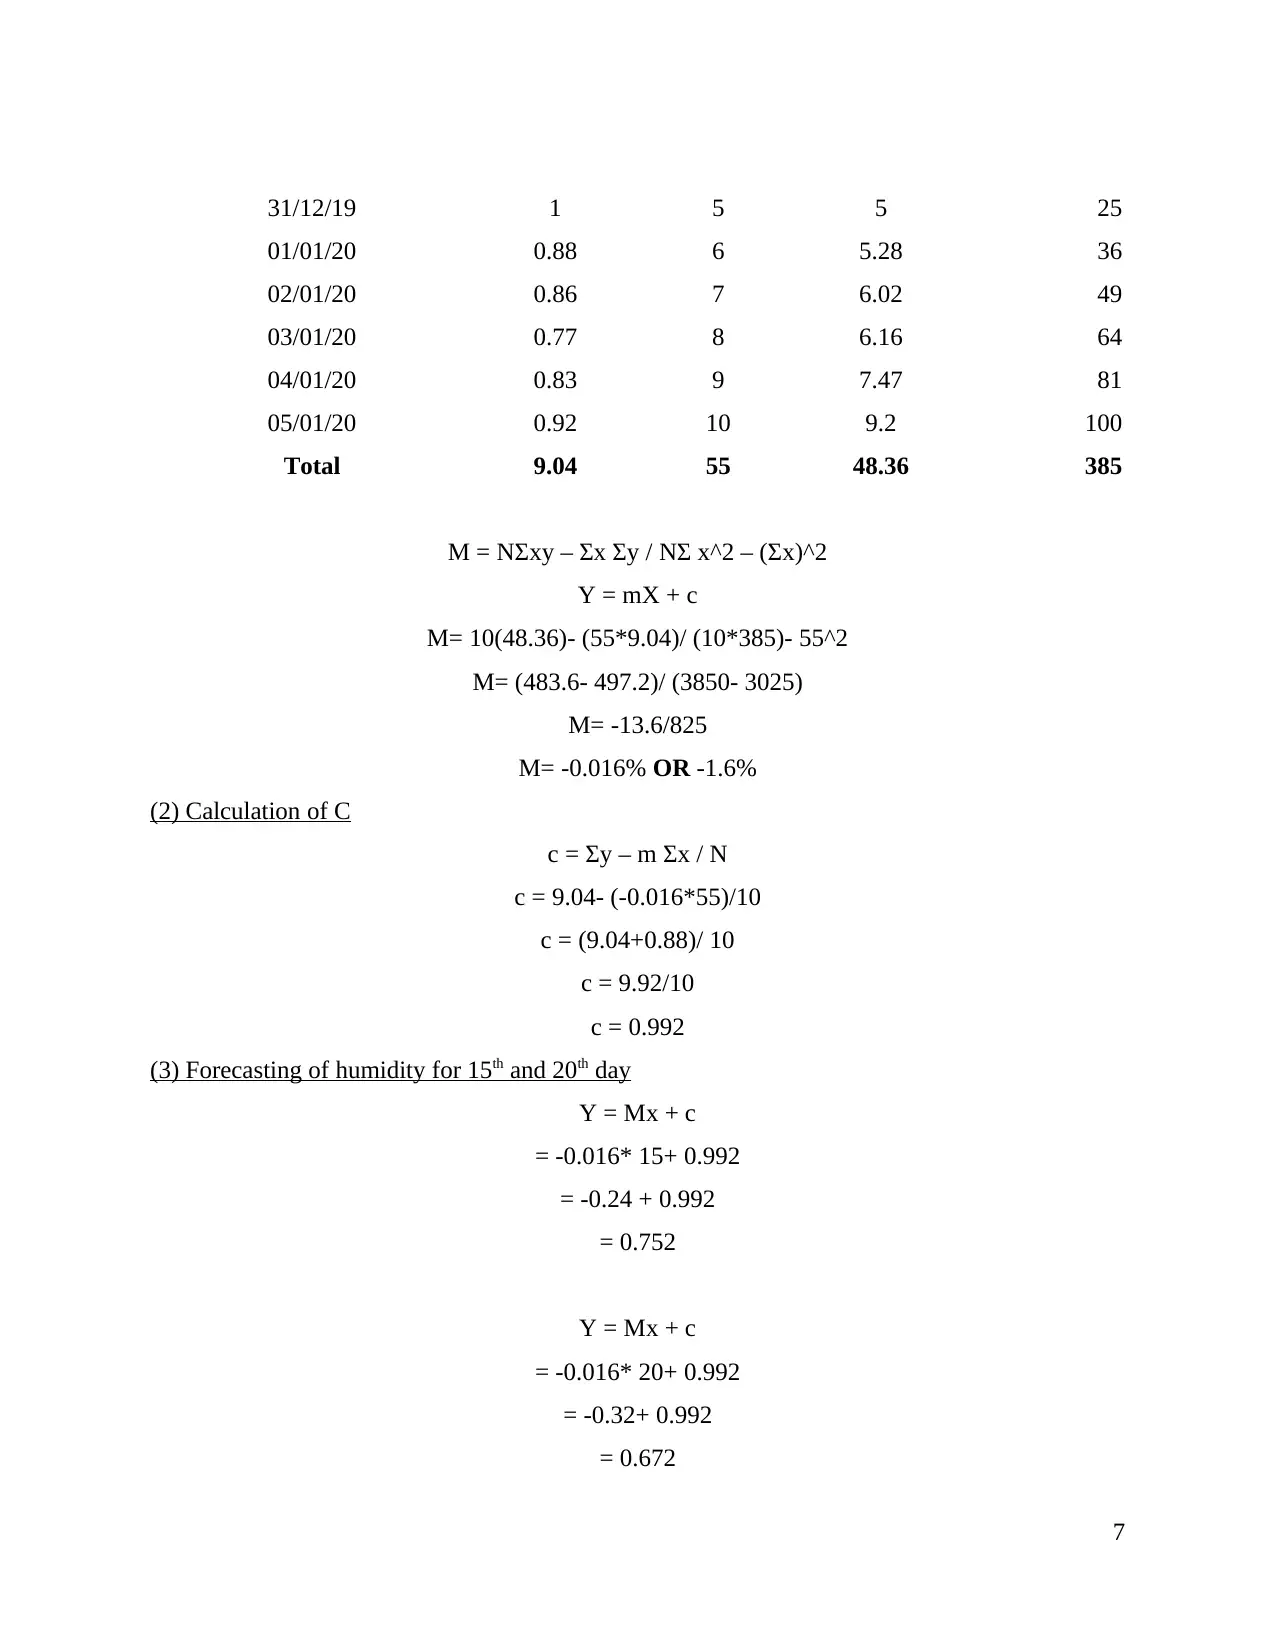
This assignment presents a detailed analysis of humidity data collected over ten consecutive days in Liverpool. The study begins by organizing the data into a table and presenting it graphically. It then proceeds to calculate key statistical measures, including the mean, median, mode, range, and standard deviation of the humidity data, providing interpretations for each. Furthermore, the assignment explores a linear forecasting model to predict future humidity levels, calculating the constants M and C and forecasting humidity for the 15th and 20th days. The study concludes with a summary of the findings and references relevant sources.
1 out of 11
Related Documents


Your All-in-One AI-Powered Toolkit for Academic Success.
+13062052269
info@desklib.com
Available 24*7 on WhatsApp / Email
![[object Object]](/_next/static/media/star-bottom.7253800d.svg)
© 2024 | Zucol Services PVT LTD | All rights reserved.