Data Analysis & Forecasting Report - Numeracy and Data Analysis Module
VerifiedAdded on 2022/12/27
|13
|1608
|109
Report
AI Summary
This report provides a comprehensive analysis of data, focusing on data analysis techniques and forecasting methods. It begins with an introduction to data analysis, highlighting its importance in processing big data into useful information. The report then presents data in a tabular format and analyze...
Numeracy and Data
Analysis
Analysis
Paraphrase This Document
Need a fresh take? Get an instant paraphrase of this document with our AI Paraphraser
Table of Contents
INTRODUCTION...........................................................................................................................3
MAIN BODY...................................................................................................................................3
1. Data given in table format .......................................................................................................3
2. Analysing two types of chart ..................................................................................................3
3. Calculation of techniques.........................................................................................................4
4. Linear forecasting model.........................................................................................................8
CONCLUSION..............................................................................................................................11
REFERENCES................................................................................................................................1
INTRODUCTION
Data analysis refers to the steps that involve gathering all information, processing it,
exploring the data and using to identify the pattern and other insights. This plays crucial role in
processing big data into useful information (Gupta and Pal, 2020). This helps in conducting
many activities and function to analyse the data to carry out certain further task and by using the
some techniques such as mean, mode, median and standard deviation. Apart from that
forecasting analysis of specific data trends based on past and present has been discussed to
predict the variable of upcoming time period to anticipated expenses and will lead to utilize and
allocate the plan and budget.
MAIN BODY
1. Data given in table format
Month Monthly
Expenses
Jan 4000
Feb 1000
March 3000
April 5000
May 2000
June 14000
July 9000
Aug 10000
Sep 11000
Oct 7000
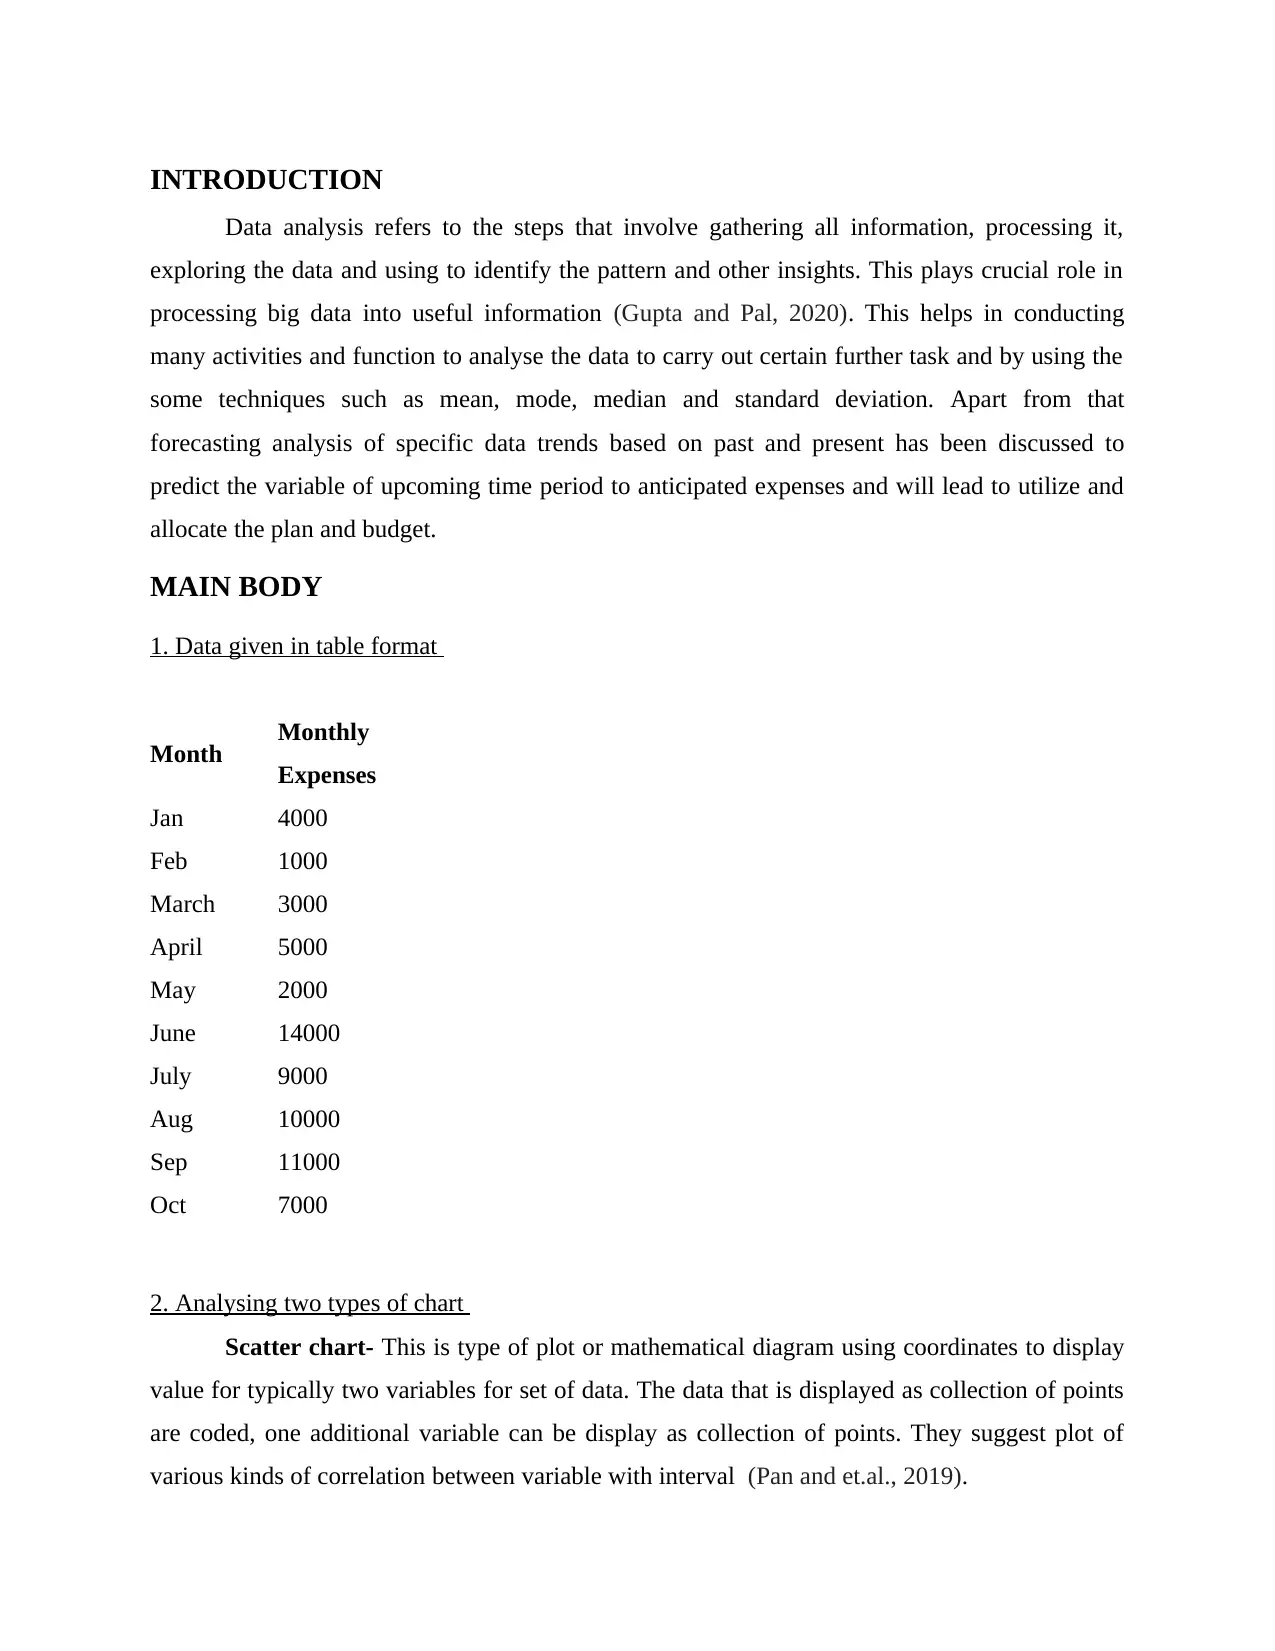
2. Analysing two types of chart
Scatter chart- This is type of plot or mathematical diagram using coordinates to display
value for typically two variables for set of data. The data that is displayed as collection of points
are coded, one additional variable can be display as collection of points. They suggest plot of
various kinds of correlation between variable with interval (Pan and et.al., 2019).
Data analysis refers to the steps that involve gathering all information, processing it,
exploring the data and using to identify the pattern and other insights. This plays crucial role in
processing big data into useful information (Gupta and Pal, 2020). This helps in conducting
many activities and function to analyse the data to carry out certain further task and by using the
some techniques such as mean, mode, median and standard deviation. Apart from that
forecasting analysis of specific data trends based on past and present has been discussed to
predict the variable of upcoming time period to anticipated expenses and will lead to utilize and
allocate the plan and budget.
MAIN BODY
1. Data given in table format
Month Monthly
Expenses
Jan 4000
Feb 1000
March 3000
April 5000
May 2000
June 14000
July 9000
Aug 10000
Sep 11000
Oct 7000
2. Analysing two types of chart
Scatter chart- This is type of plot or mathematical diagram using coordinates to display
value for typically two variables for set of data. The data that is displayed as collection of points
are coded, one additional variable can be display as collection of points. They suggest plot of
various kinds of correlation between variable with interval (Pan and et.al., 2019).
You're viewing a preview
Unlock full access by subscribing today!


0 2 4 6 8 10 12
0
2000
4000
6000
8000
10000
12000
14000
16000
4000
5000
6000
1000 1000
10000
11000
12000
14000
15000
Monthly Expenses
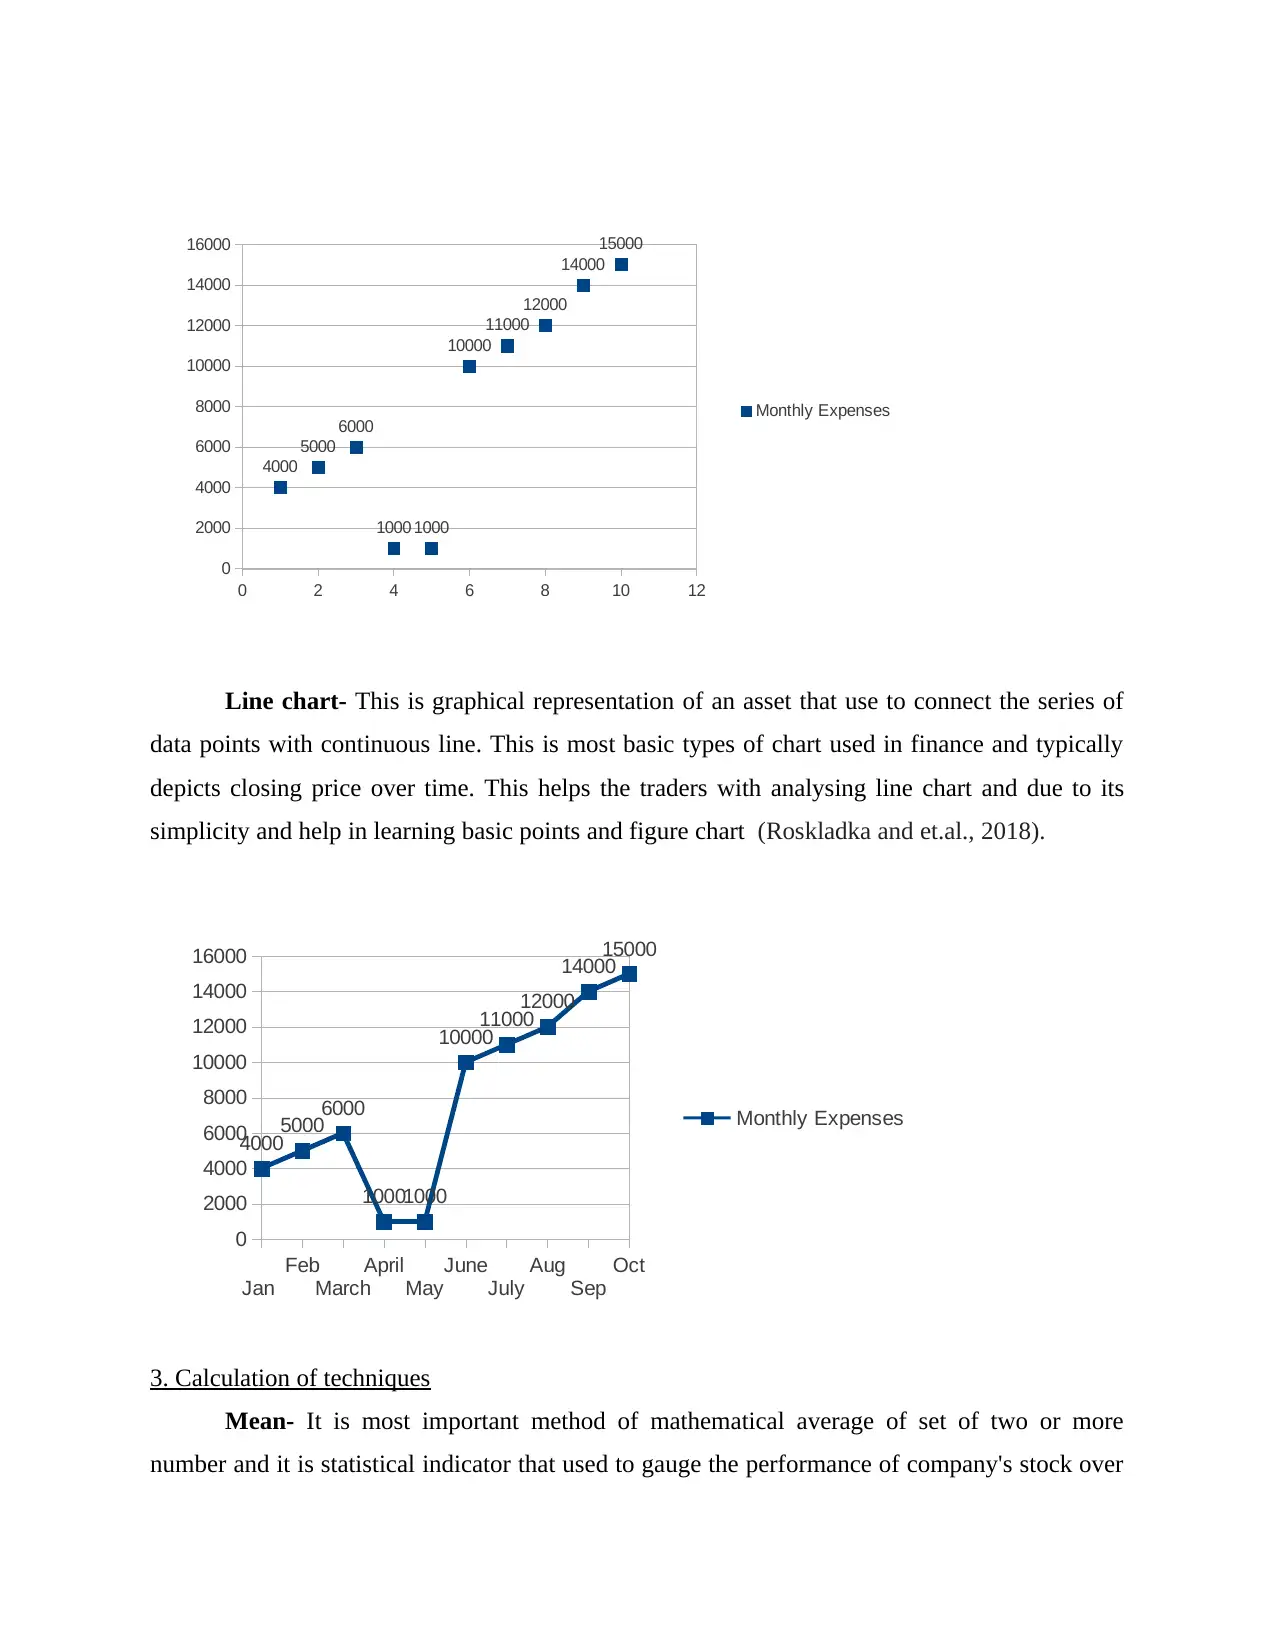
Line chart- This is graphical representation of an asset that use to connect the series of
data points with continuous line. This is most basic types of chart used in finance and typically
depicts closing price over time. This helps the traders with analysing line chart and due to its
simplicity and help in learning basic points and figure chart (Roskladka and et.al., 2018).
Jan
Feb
March
April
May
June
July
Aug
Sep
Oct
0
2000
4000
6000
8000
10000
12000
14000
16000
400050006000
10001000
10000
11000
12000
14000
15000
Monthly Expenses
3. Calculation of techniques
Mean- It is most important method of mathematical average of set of two or more
number and it is statistical indicator that used to gauge the performance of company's stock over
0
2000
4000
6000
8000
10000
12000
14000
16000
4000
5000
6000
1000 1000
10000
11000
12000
14000
15000
Monthly Expenses
Line chart- This is graphical representation of an asset that use to connect the series of
data points with continuous line. This is most basic types of chart used in finance and typically
depicts closing price over time. This helps the traders with analysing line chart and due to its
simplicity and help in learning basic points and figure chart (Roskladka and et.al., 2018).
Jan
Feb
March
April
May
June
July
Aug
Sep
Oct
0
2000
4000
6000
8000
10000
12000
14000
16000
400050006000
10001000
10000
11000
12000
14000
15000
Monthly Expenses
3. Calculation of techniques
Mean- It is most important method of mathematical average of set of two or more
number and it is statistical indicator that used to gauge the performance of company's stock over
Paraphrase This Document
Need a fresh take? Get an instant paraphrase of this document with our AI Paraphraser
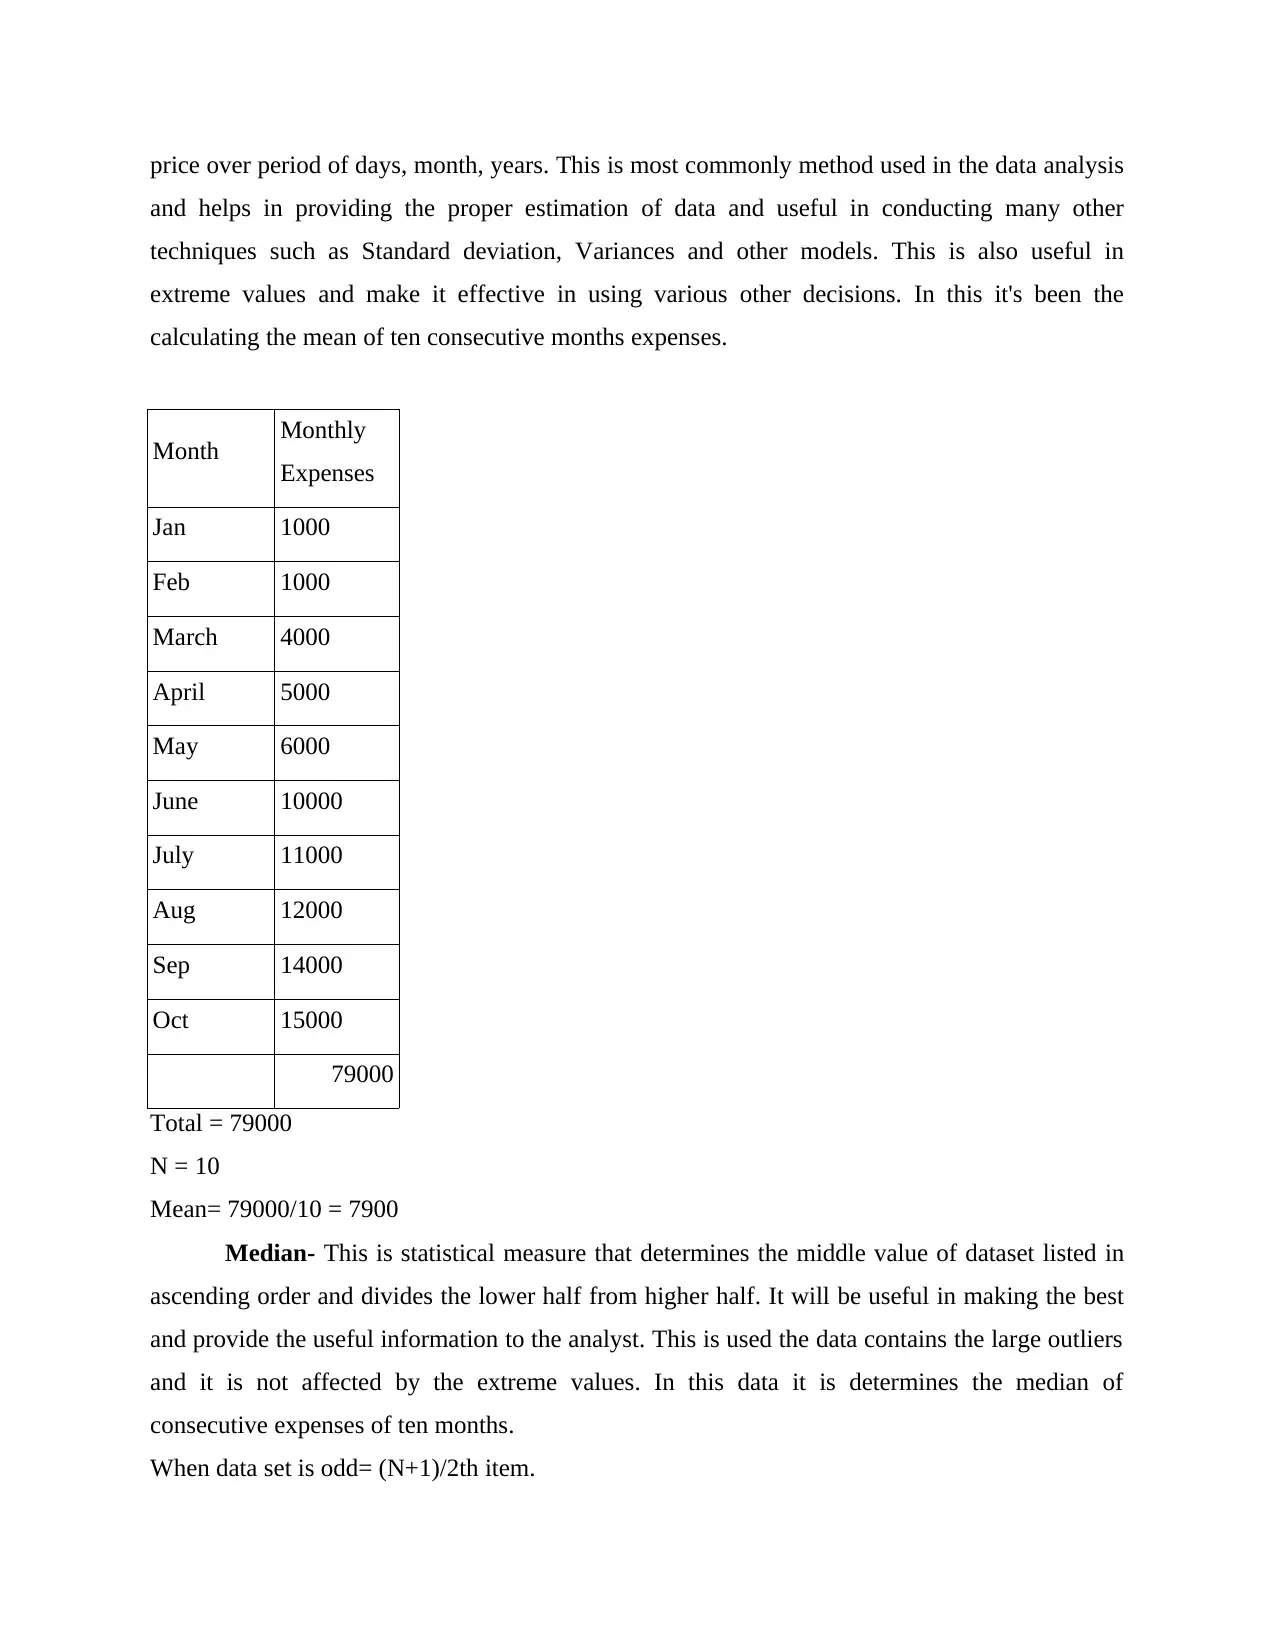
price over period of days, month, years. This is most commonly method used in the data analysis
and helps in providing the proper estimation of data and useful in conducting many other
techniques such as Standard deviation, Variances and other models. This is also useful in
extreme values and make it effective in using various other decisions. In this it's been the
calculating the mean of ten consecutive months expenses.
Month Monthly
Expenses
Jan 1000
Feb 1000
March 4000
April 5000
May 6000
June 10000
July 11000
Aug 12000
Sep 14000
Oct 15000
79000
Total = 79000
N = 10
Mean= 79000/10 = 7900
Median- This is statistical measure that determines the middle value of dataset listed in
ascending order and divides the lower half from higher half. It will be useful in making the best
and provide the useful information to the analyst. This is used the data contains the large outliers
and it is not affected by the extreme values. In this data it is determines the median of
consecutive expenses of ten months.
When data set is odd= (N+1)/2th item.
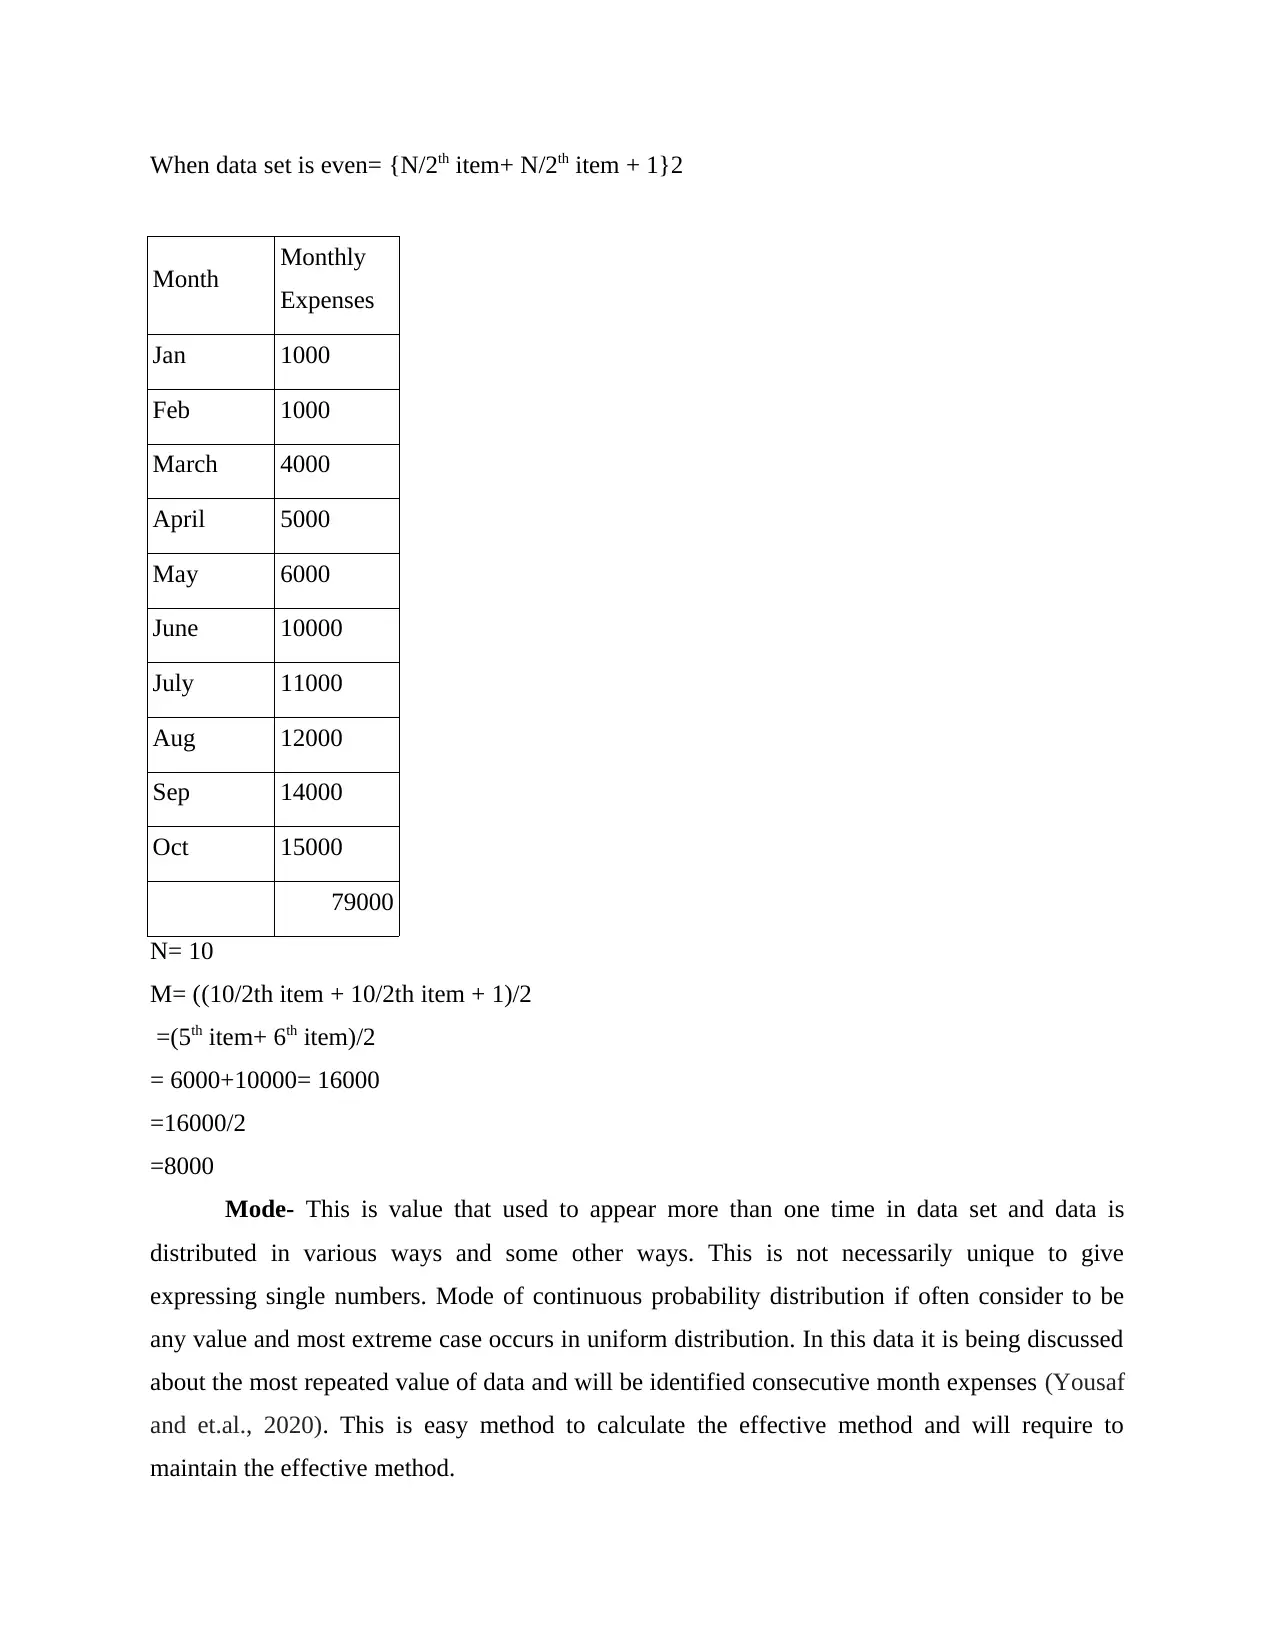
When data set is even= {N/2th item+ N/2th item + 1}2
Month Monthly
Expenses
Jan 1000
Feb 1000
March 4000
April 5000
May 6000
June 10000
July 11000
Aug 12000
Sep 14000
Oct 15000
79000
N= 10
M= ((10/2th item + 10/2th item + 1)/2
=(5th item+ 6th item)/2
= 6000+10000= 16000
=16000/2
=8000
Mode- This is value that used to appear more than one time in data set and data is
distributed in various ways and some other ways. This is not necessarily unique to give
expressing single numbers. Mode of continuous probability distribution if often consider to be
any value and most extreme case occurs in uniform distribution. In this data it is being discussed
about the most repeated value of data and will be identified consecutive month expenses (Yousaf
and et.al., 2020). This is easy method to calculate the effective method and will require to
maintain the effective method.
You're viewing a preview
Unlock full access by subscribing today!
Month Monthly
Expenses
Jan 1000
Feb 1000
March 4000
April 5000
May 6000
June 10000
July 11000
Aug 12000
Sep 14000
Oct 15000
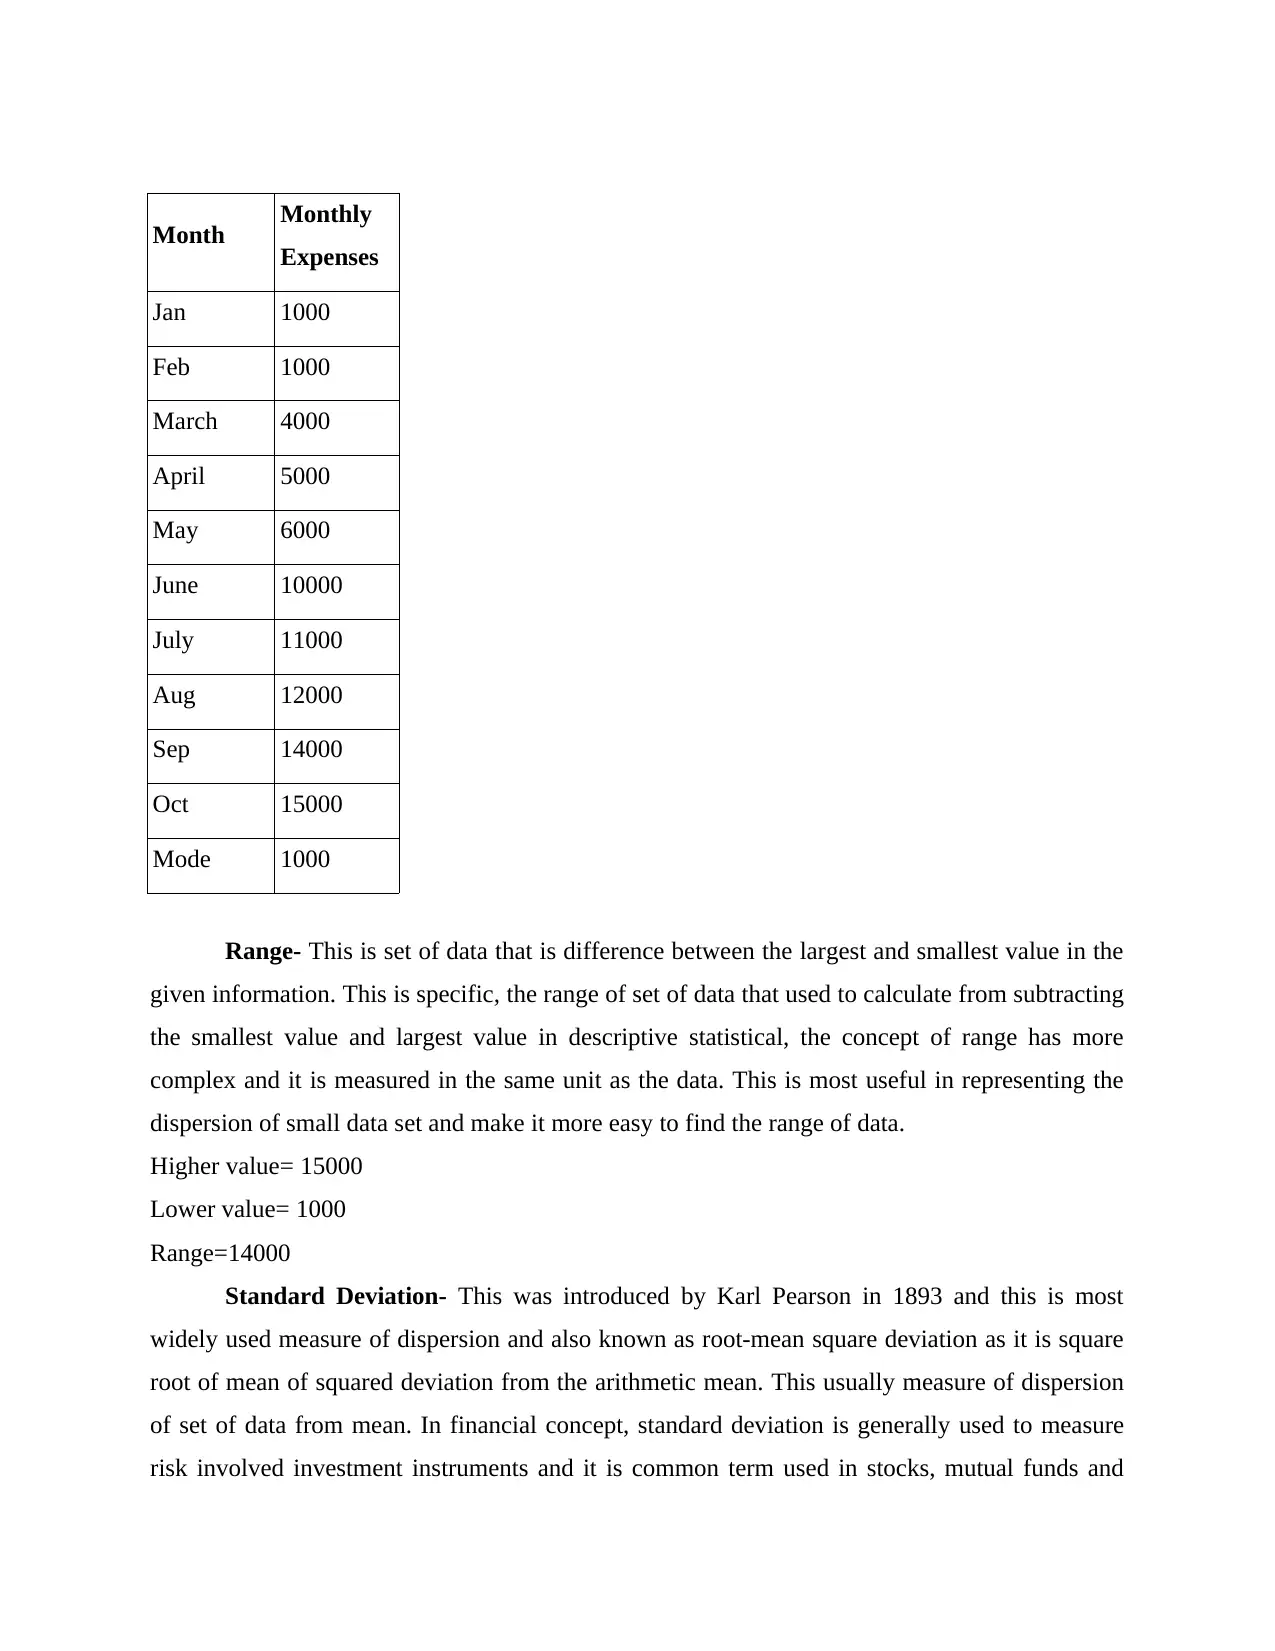
Mode 1000
Range- This is set of data that is difference between the largest and smallest value in the
given information. This is specific, the range of set of data that used to calculate from subtracting
the smallest value and largest value in descriptive statistical, the concept of range has more
complex and it is measured in the same unit as the data. This is most useful in representing the
dispersion of small data set and make it more easy to find the range of data.
Higher value= 15000
Lower value= 1000
Range=14000
Standard Deviation- This was introduced by Karl Pearson in 1893 and this is most
widely used measure of dispersion and also known as root-mean square deviation as it is square
root of mean of squared deviation from the arithmetic mean. This usually measure of dispersion
of set of data from mean. In financial concept, standard deviation is generally used to measure
risk involved investment instruments and it is common term used in stocks, mutual funds and
Expenses
Jan 1000
Feb 1000
March 4000
April 5000
May 6000
June 10000
July 11000
Aug 12000
Sep 14000
Oct 15000
Mode 1000
Range- This is set of data that is difference between the largest and smallest value in the
given information. This is specific, the range of set of data that used to calculate from subtracting
the smallest value and largest value in descriptive statistical, the concept of range has more
complex and it is measured in the same unit as the data. This is most useful in representing the
dispersion of small data set and make it more easy to find the range of data.
Higher value= 15000
Lower value= 1000
Range=14000
Standard Deviation- This was introduced by Karl Pearson in 1893 and this is most
widely used measure of dispersion and also known as root-mean square deviation as it is square
root of mean of squared deviation from the arithmetic mean. This usually measure of dispersion
of set of data from mean. In financial concept, standard deviation is generally used to measure
risk involved investment instruments and it is common term used in stocks, mutual funds and
Paraphrase This Document
Need a fresh take? Get an instant paraphrase of this document with our AI Paraphraser
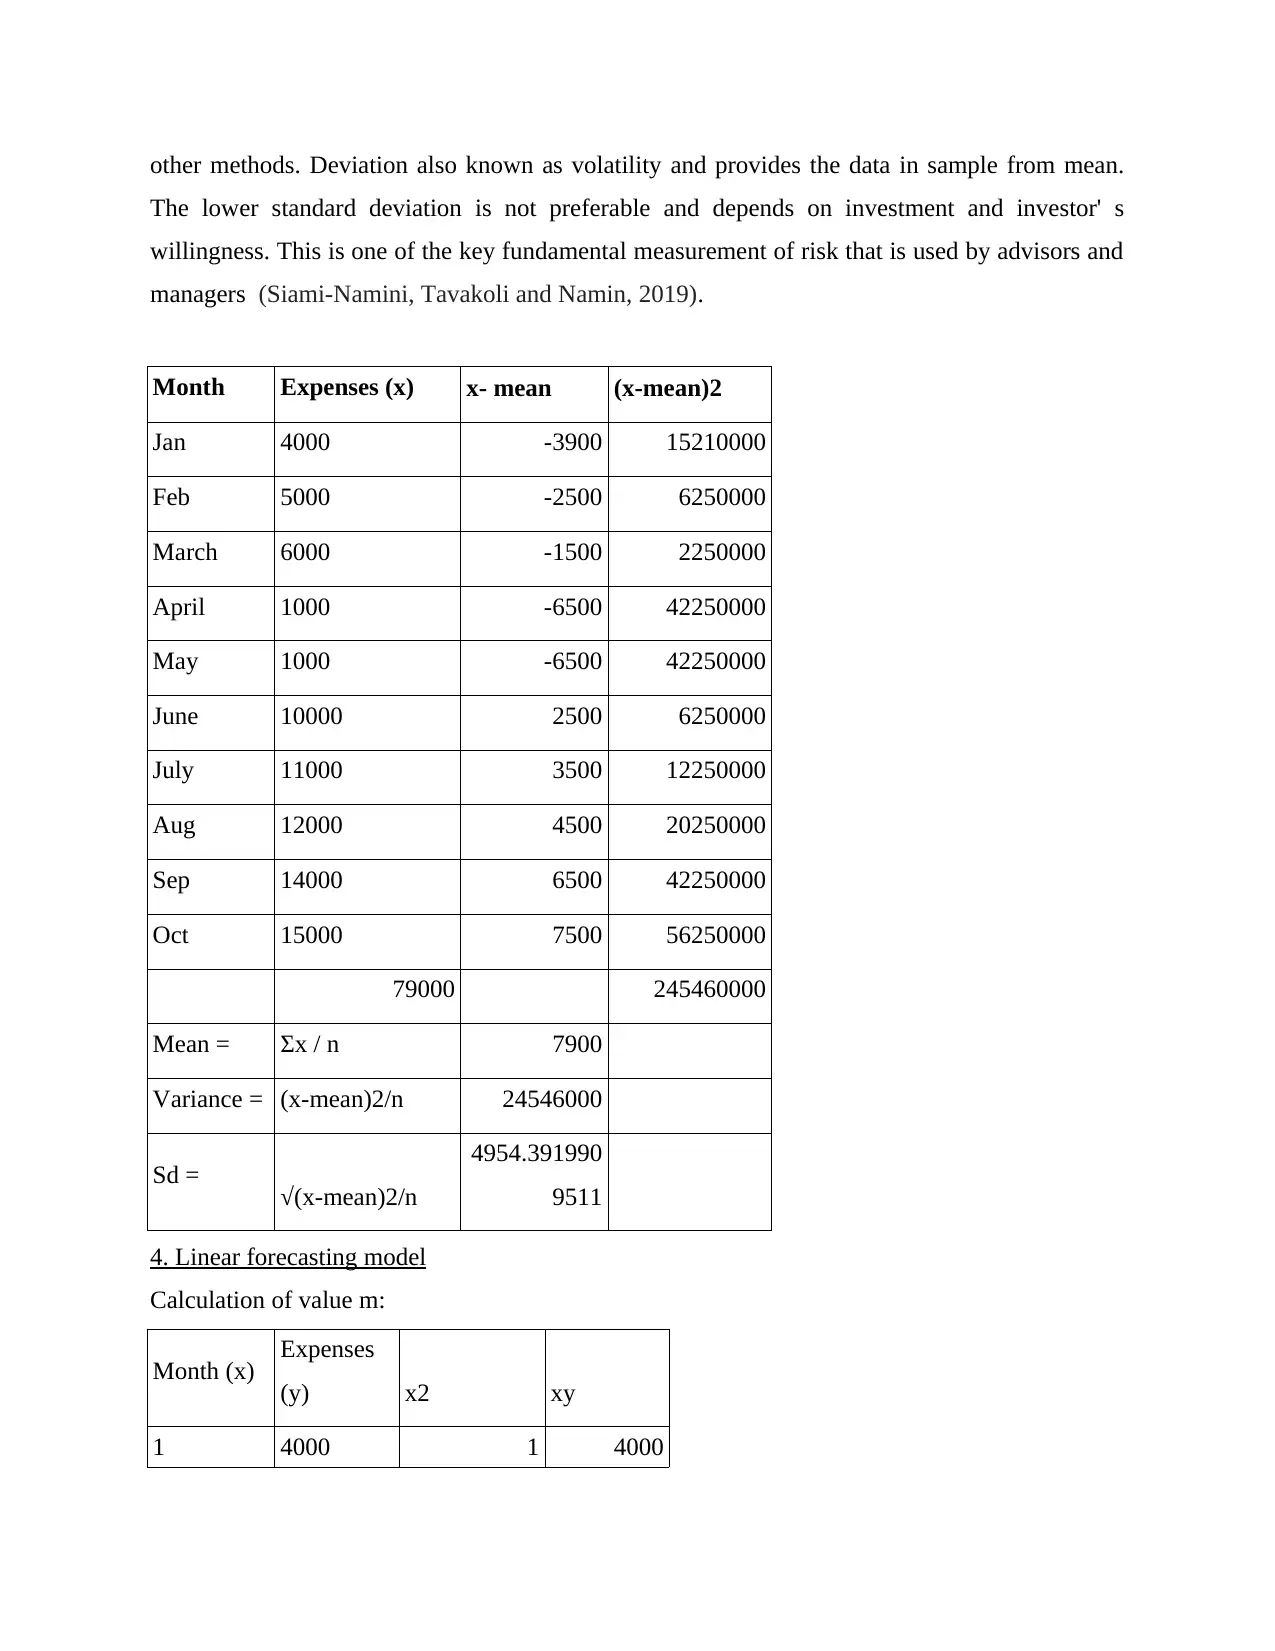
other methods. Deviation also known as volatility and provides the data in sample from mean.
The lower standard deviation is not preferable and depends on investment and investor' s
willingness. This is one of the key fundamental measurement of risk that is used by advisors and
managers (Siami-Namini, Tavakoli and Namin, 2019).
Month Expenses (x) x- mean (x-mean)2
Jan 4000 -3900 15210000
Feb 5000 -2500 6250000
March 6000 -1500 2250000
April 1000 -6500 42250000
May 1000 -6500 42250000
June 10000 2500 6250000
July 11000 3500 12250000
Aug 12000 4500 20250000
Sep 14000 6500 42250000
Oct 15000 7500 56250000
79000 245460000
Mean = Σx / n 7900
Variance = (x-mean)2/n 24546000
Sd = √(x-mean)2/n
4954.391990
9511
4. Linear forecasting model
Calculation of value m:
Month (x) Expenses
(y) x2 xy
1 4000 1 4000
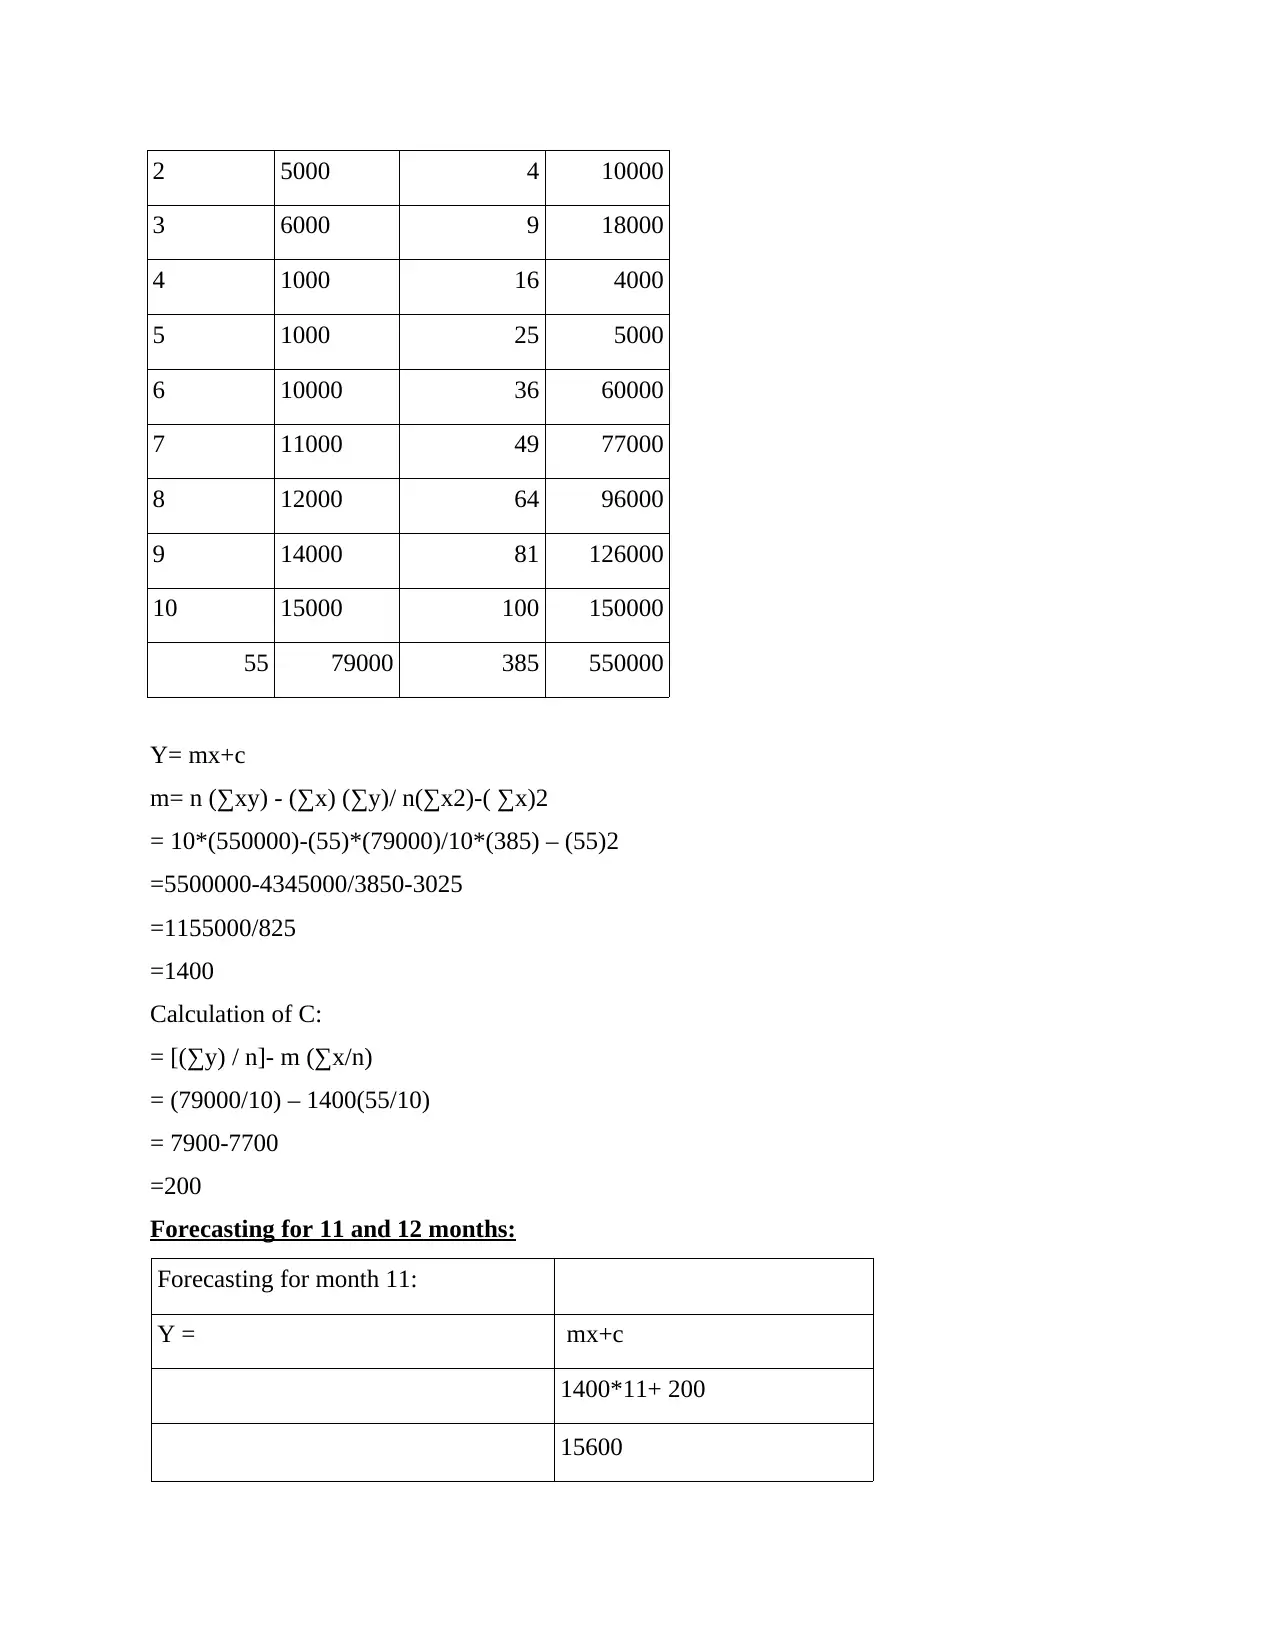
2 5000 4 10000
3 6000 9 18000
4 1000 16 4000
5 1000 25 5000
6 10000 36 60000
7 11000 49 77000
8 12000 64 96000
9 14000 81 126000
10 15000 100 150000
55 79000 385 550000
Y= mx+c
m= n (∑xy) - (∑x) (∑y)/ n(∑x2)-( ∑x)2
= 10*(550000)-(55)*(79000)/10*(385) – (55)2
=5500000-4345000/3850-3025
=1155000/825
=1400
Calculation of C:
= [(∑y) / n]- m (∑x/n)
= (79000/10) – 1400(55/10)
= 7900-7700
=200
Forecasting for 11 and 12 months:
Forecasting for month 11:
Y = mx+c
1400*11+ 200
15600
You're viewing a preview
Unlock full access by subscribing today!

Paraphrase This Document
Need a fresh take? Get an instant paraphrase of this document with our AI Paraphraser

Forecasting for month 12:
= 1400*12+ 200
17000
= 1400*12+ 200
17000
CONCLUSION
From the above report it is concluded that Data analysis is process of collecting and
properly organized the data that helps in drawing the better conclusions and useful for many
investor and data analysts that will help in providing the best information from the data. This is
logical and reasoning and make systematically applicable to certain techniques and useful in
observation of entire collection. In this report, the major analysis is to identify the meaning of
data that derived knowledge and help in making necessary decisions. In this report to analyse the
data following techniques has been used such as Mean, Mode, Median and Standard deviation
and range. Apart from that forecasting model has been evaluated in this report.
You're viewing a preview
Unlock full access by subscribing today!
REFERENCES
Books and Journals:
Gupta, R. and Pal, S. K., 2020. Trend Analysis and Forecasting of COVID-19 outbreak in
India. MedRxiv.
Pan, Y. and et.al., 2019, April. Production analysis and forecasting for unconventional reservoirs
using laplacian echo-state networks. In SPE Western Regional Meeting. Society of
Petroleum Engineers.
Roskladka, A. and et.al., 2018. Data analysis and forecasting of tourism development in
Ukraine. Innovative Marketing. 14(4). pp.19-33.
Siami-Namini, S., Tavakoli, N. and Namin, A. S., 2019. A comparative analysis of forecasting
financial time series using arima, lstm, and bilstm. arXiv preprint arXiv:1911.09512.
Yousaf, M. and et.al., 2020. Statistical analysis of forecasting COVID-19 for upcoming month in
Pakistan. Chaos, Solitons & Fractals. 138. p.109926.
1
1 out of 13
Related Documents


Your All-in-One AI-Powered Toolkit for Academic Success.
+13062052269
info@desklib.com
Available 24*7 on WhatsApp / Email
![[object Object]](/_next/static/media/star-bottom.7253800d.svg)
Unlock your academic potential
© 2024 | Zucol Services PVT LTD | All rights reserved.