Data Analysis Report: Statistical Analysis and Linear Forecasting
VerifiedAdded on 2023/06/09
|11
|1407
|395
Report
AI Summary
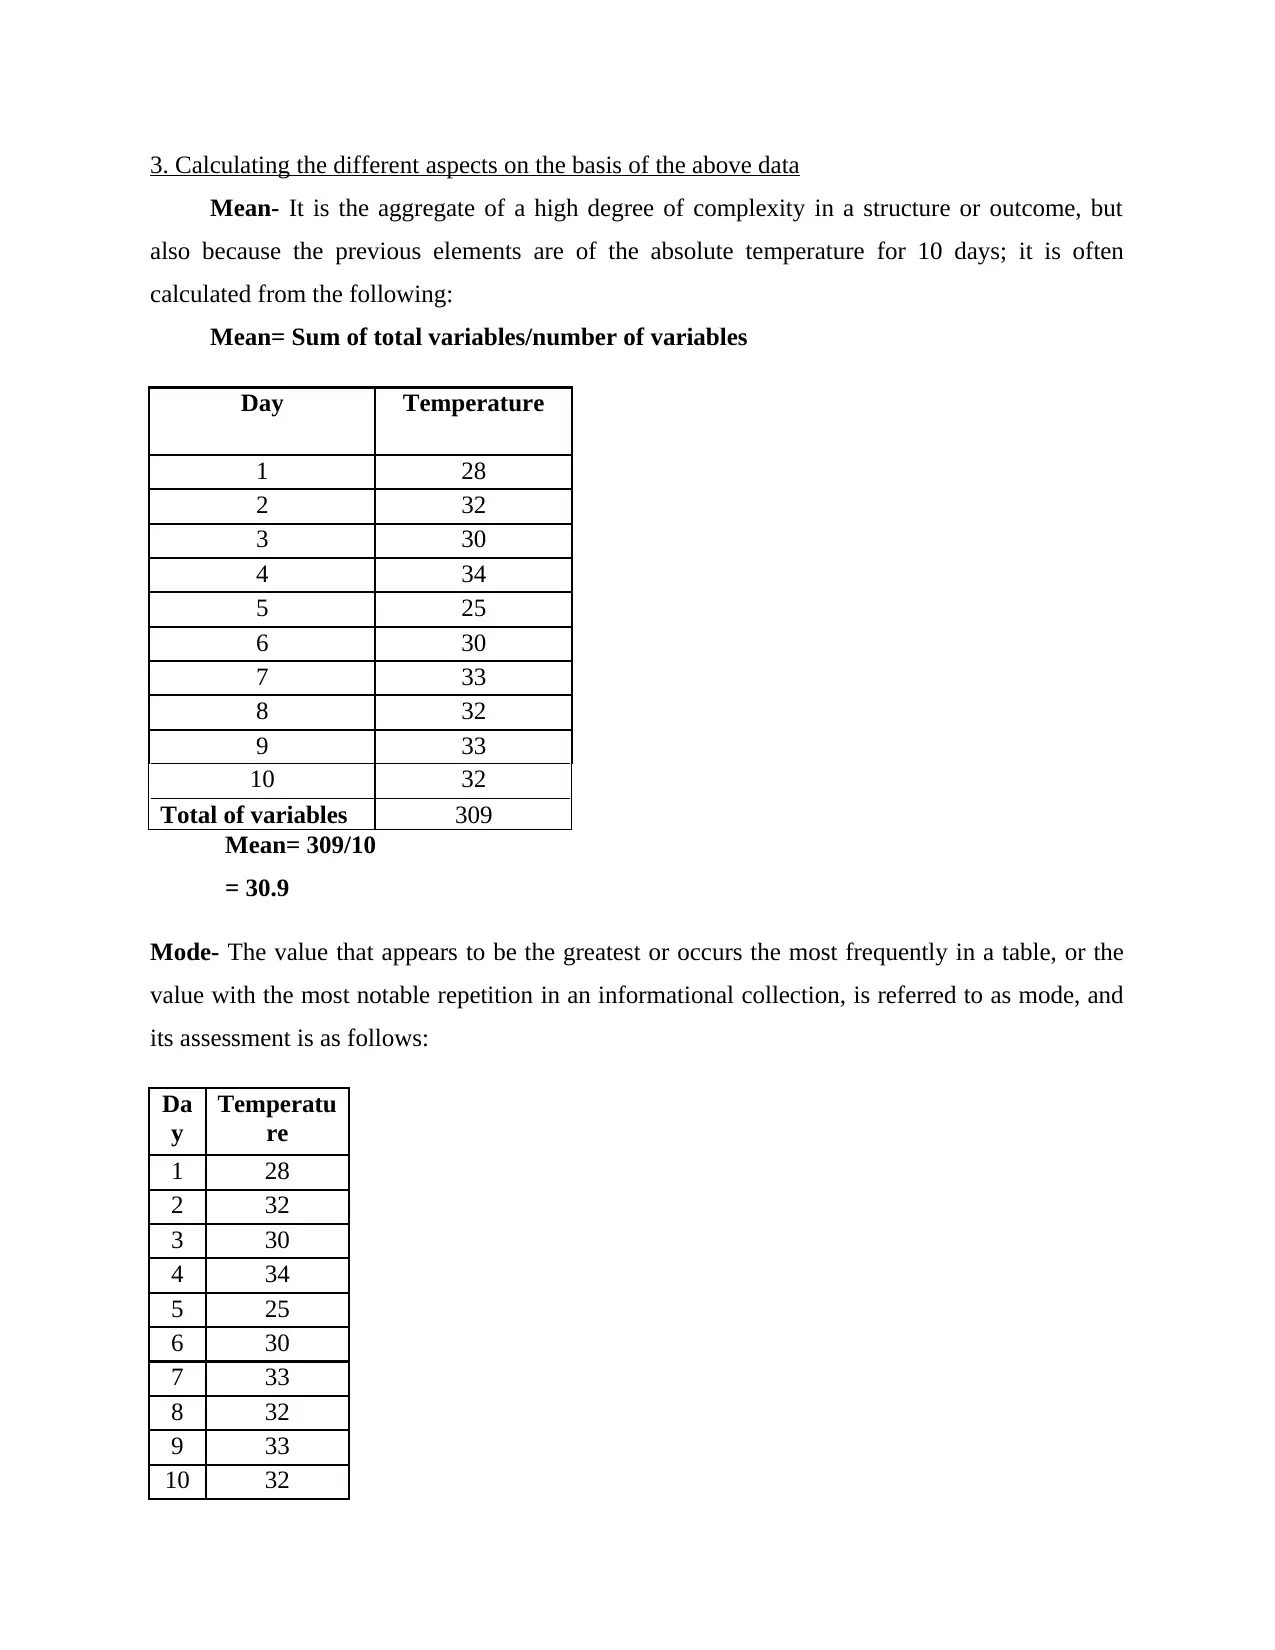
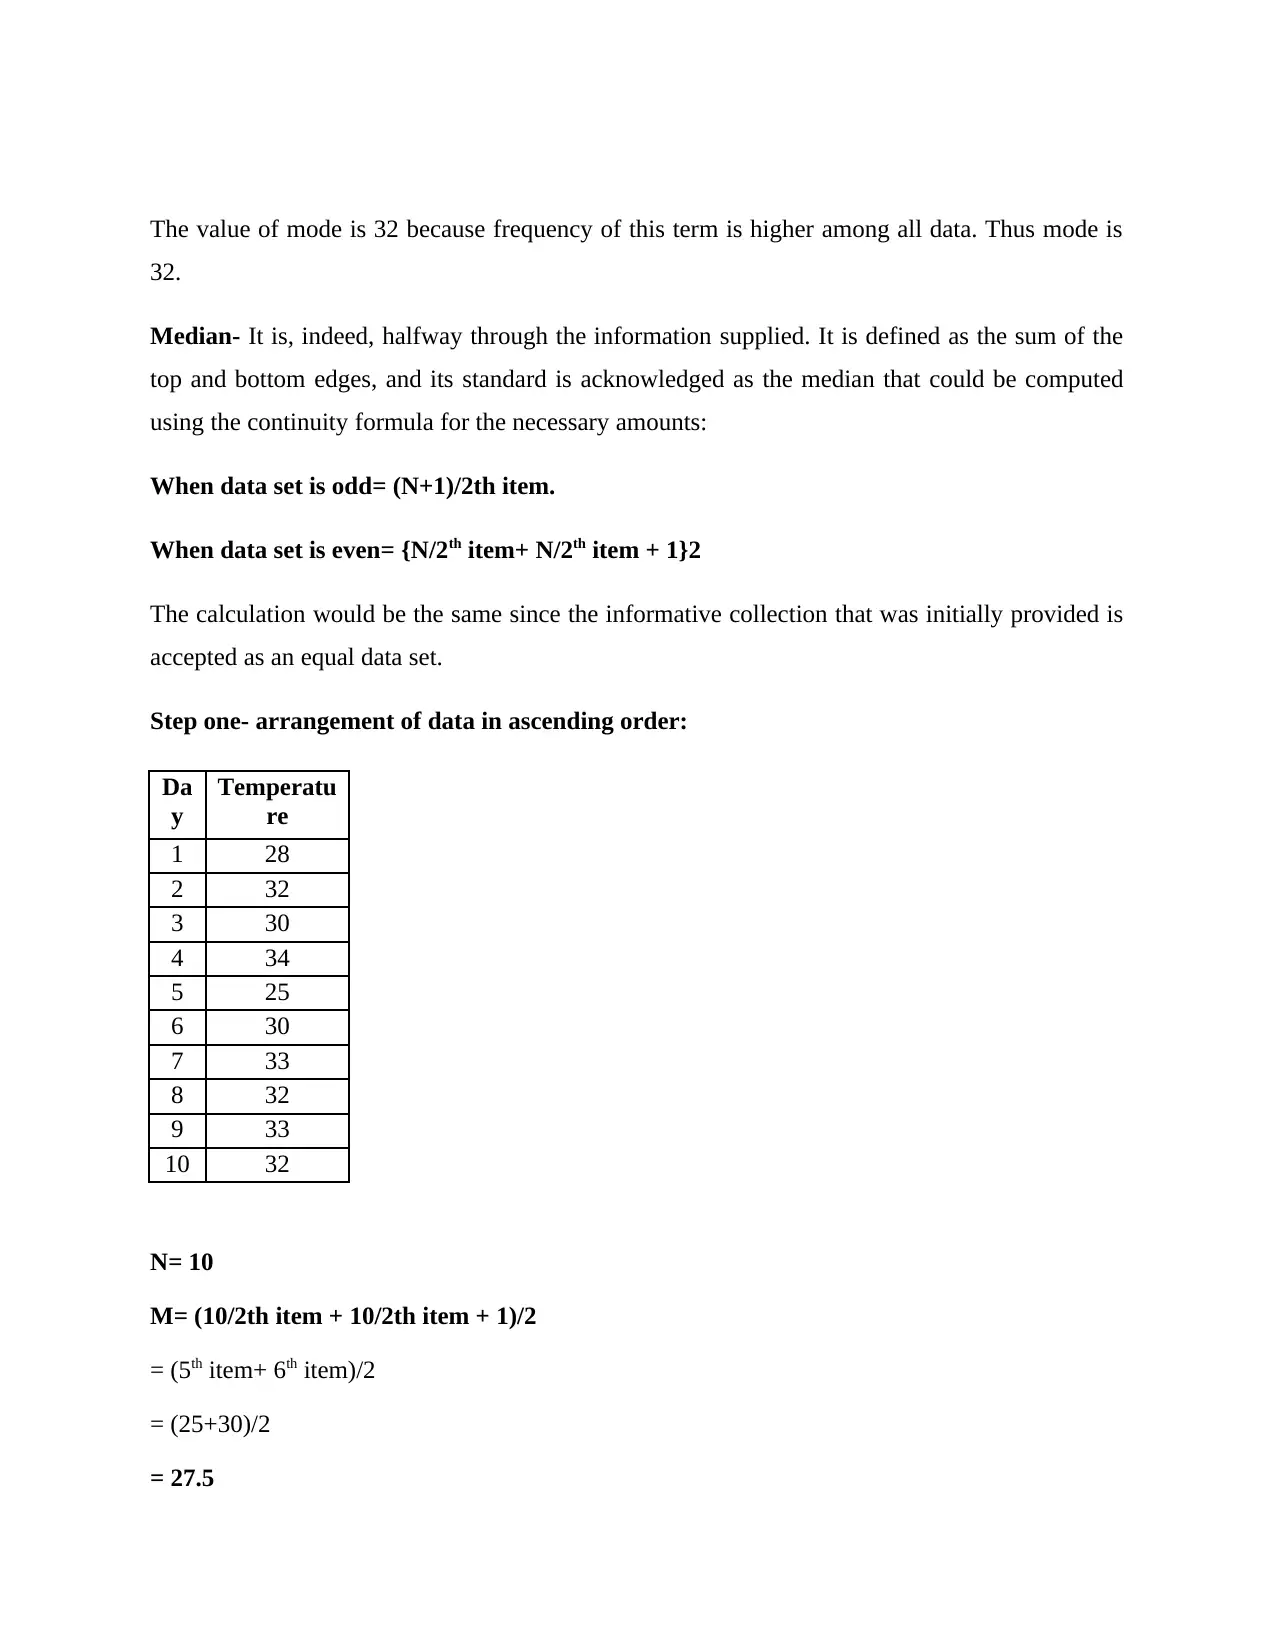
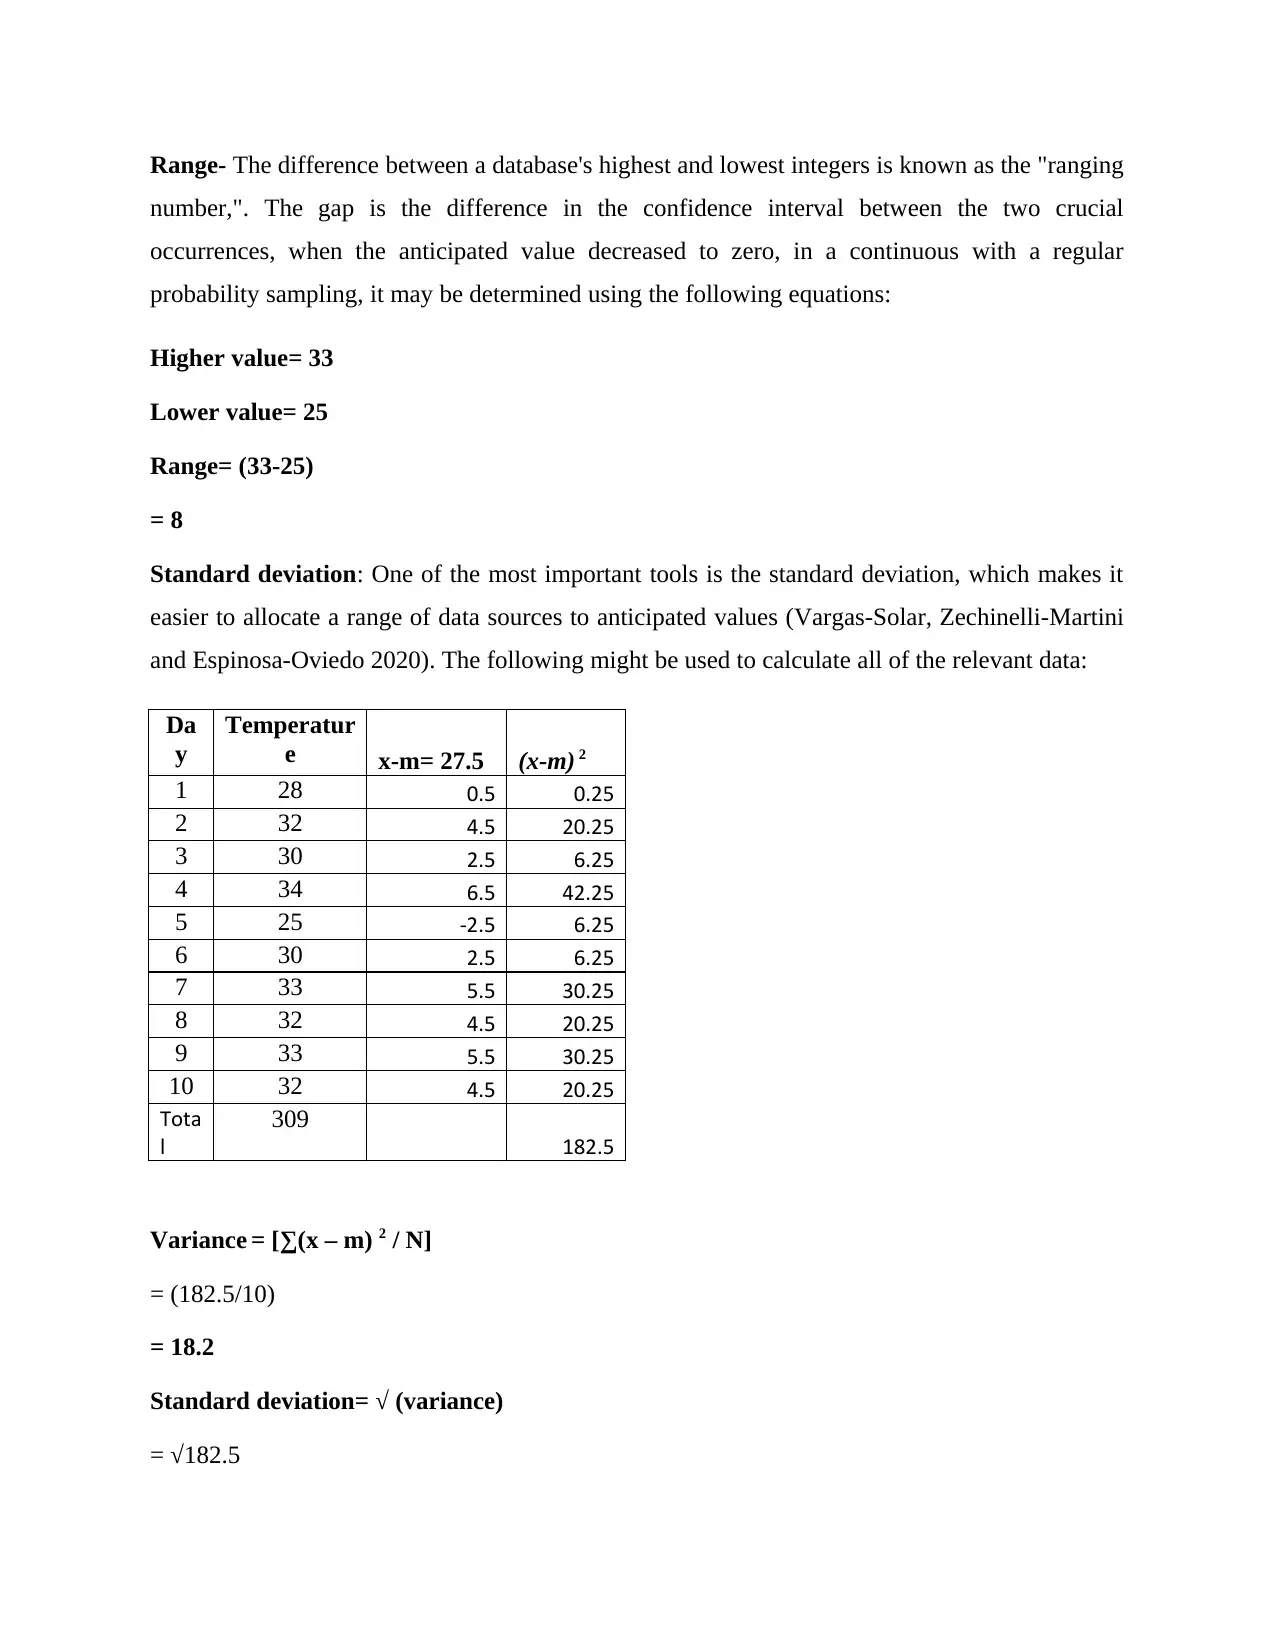
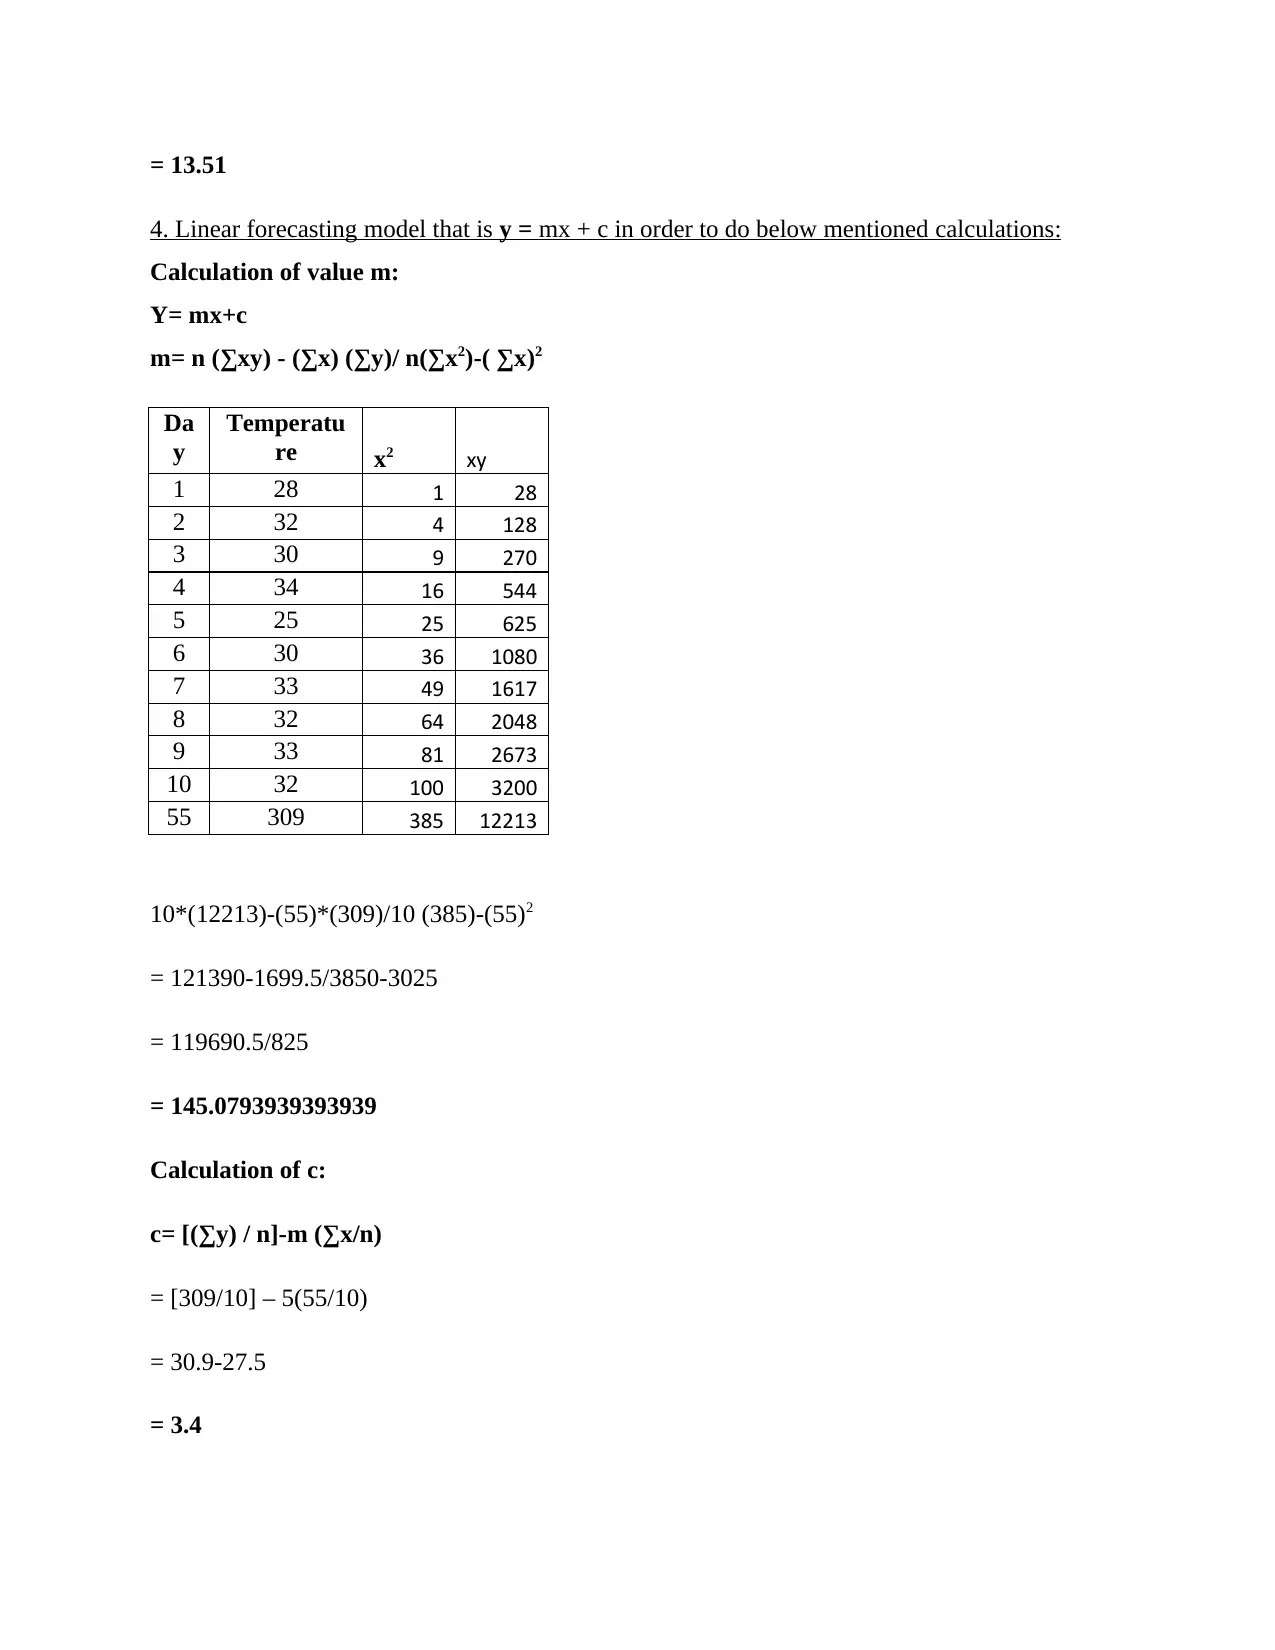
This report provides a comprehensive analysis of a given dataset, starting with its arrangement in a tabular format and its visualization using column and line charts. It then delves into calculating various statistical measures such as mean, mode, median, range, and standard deviation to understand the data's central tendencies and dispersion. A linear forecasting model (y = mx + c) is applied to predict future values for the 11th and 12th days. The report concludes that statistical analysis is crucial for firms across all sectors, aiding in the evaluation of factors affecting total amounts and enabling the implementation of necessary actions. Furthermore, the computations performed are essential for measuring the business's true financial positioning.

1 out of 11
Related Documents


Your All-in-One AI-Powered Toolkit for Academic Success.
+13062052269
info@desklib.com
Available 24*7 on WhatsApp / Email
![[object Object]](/_next/static/media/star-bottom.7253800d.svg)
Copyright © 2020–2025 A2Z Services. All Rights Reserved. Developed and managed by ZUCOL.