Numeracy & Data Analysis: Report on Statistical Calculations

Verified

Added on  2023/06/15

|7
|1267
|466
Report
AI Summary
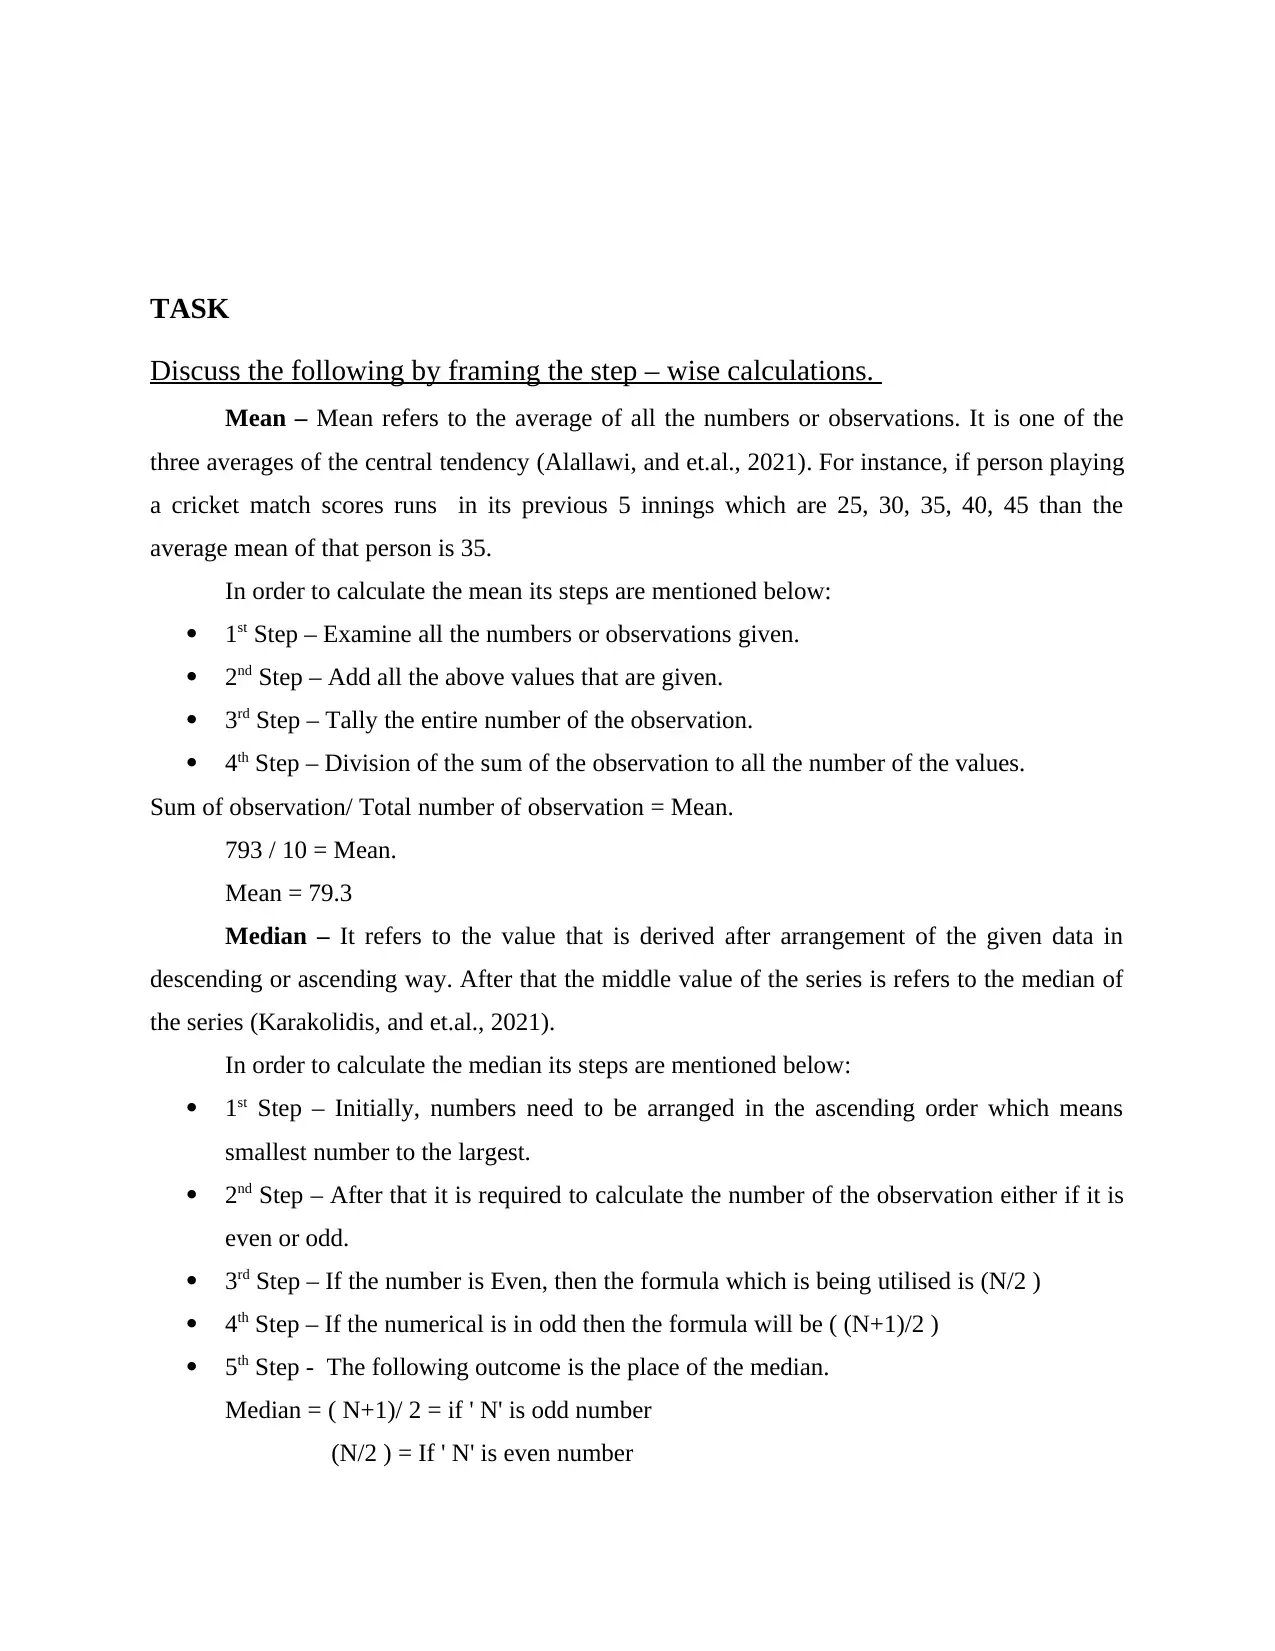
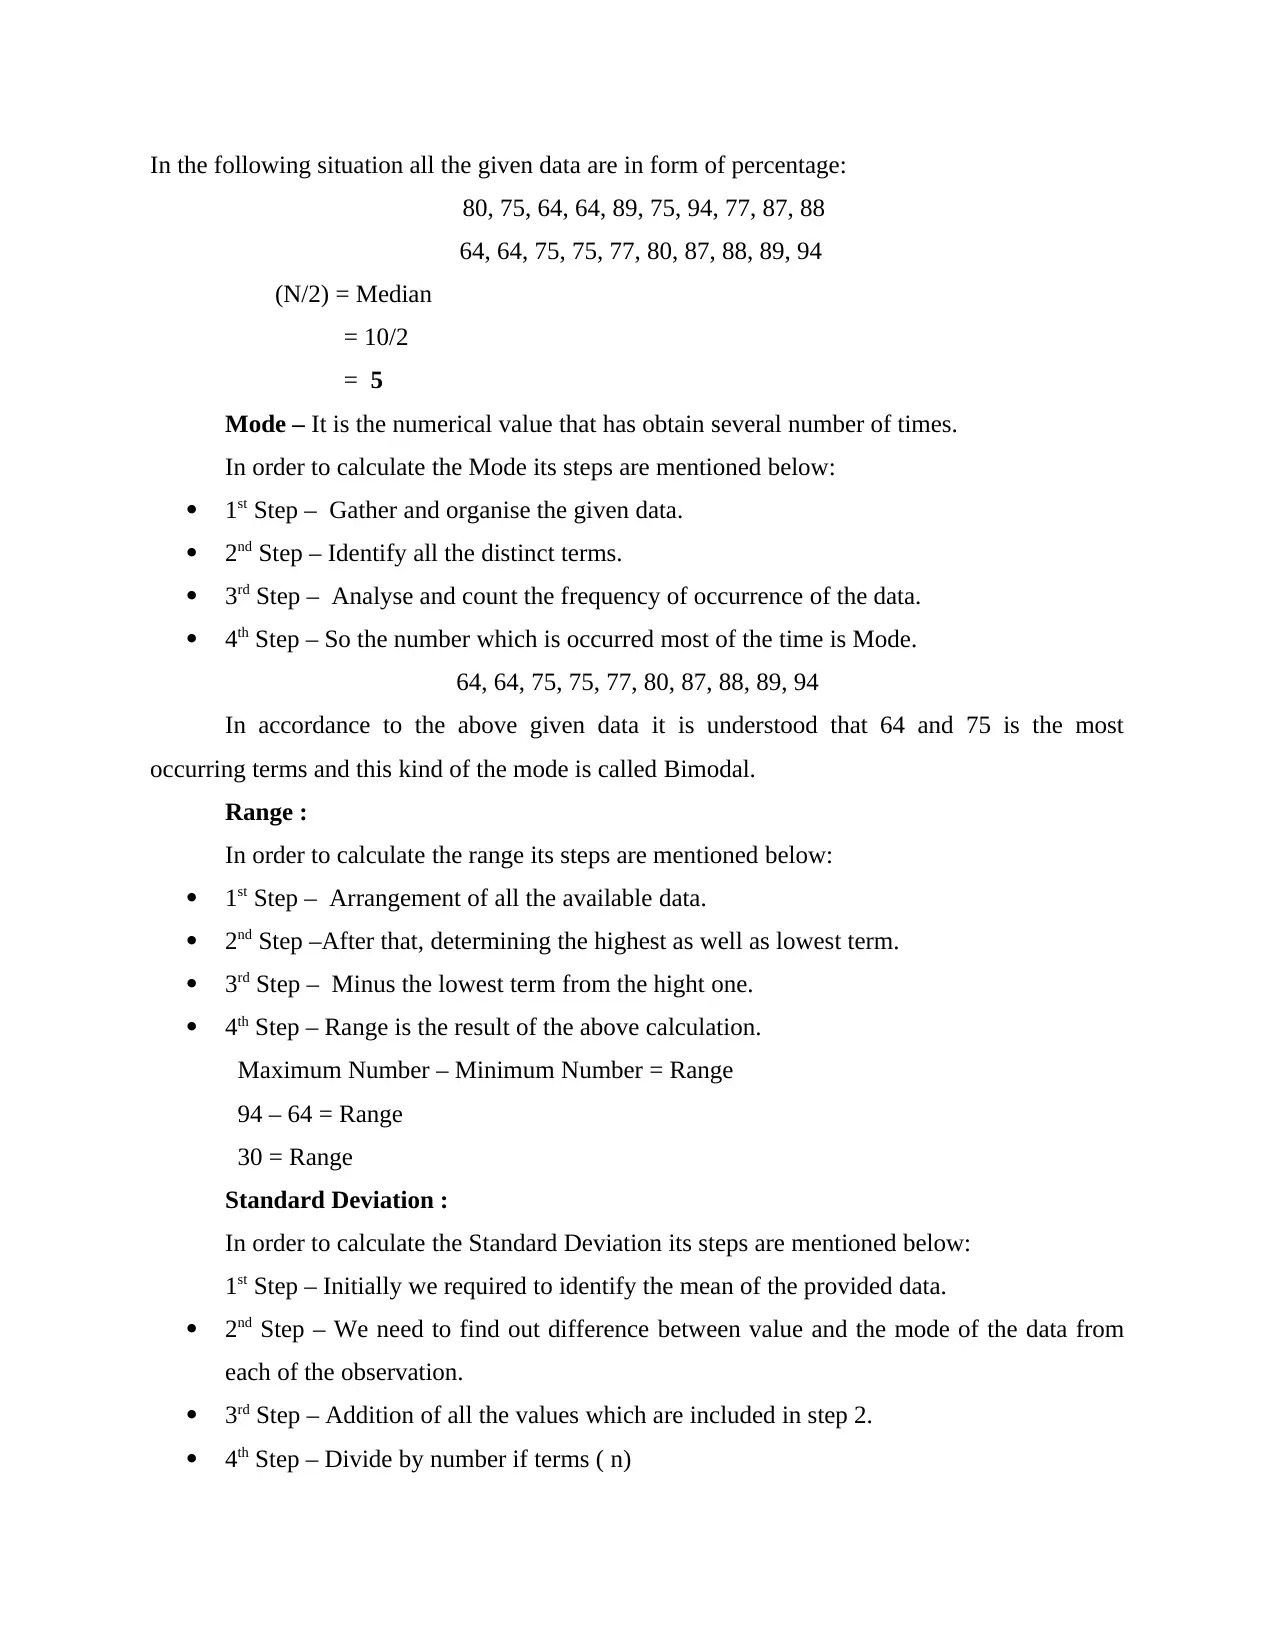
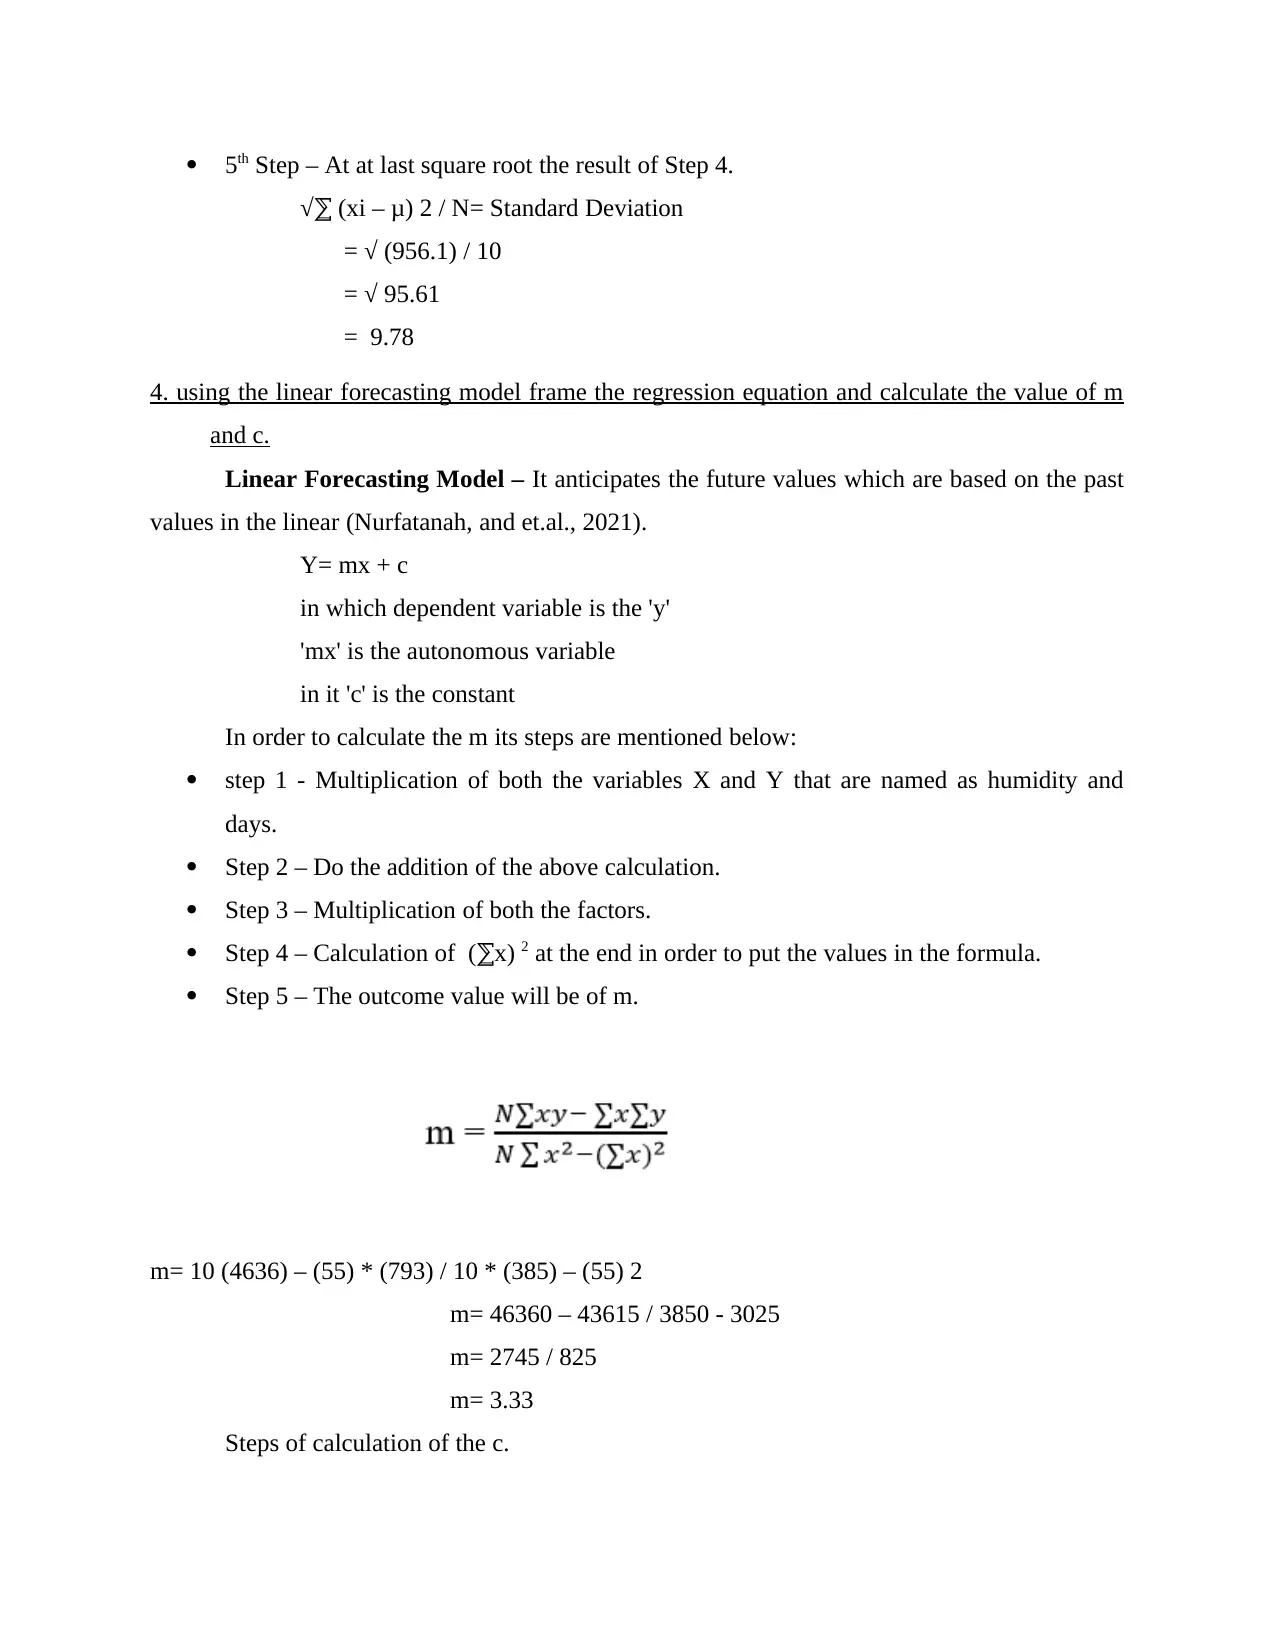
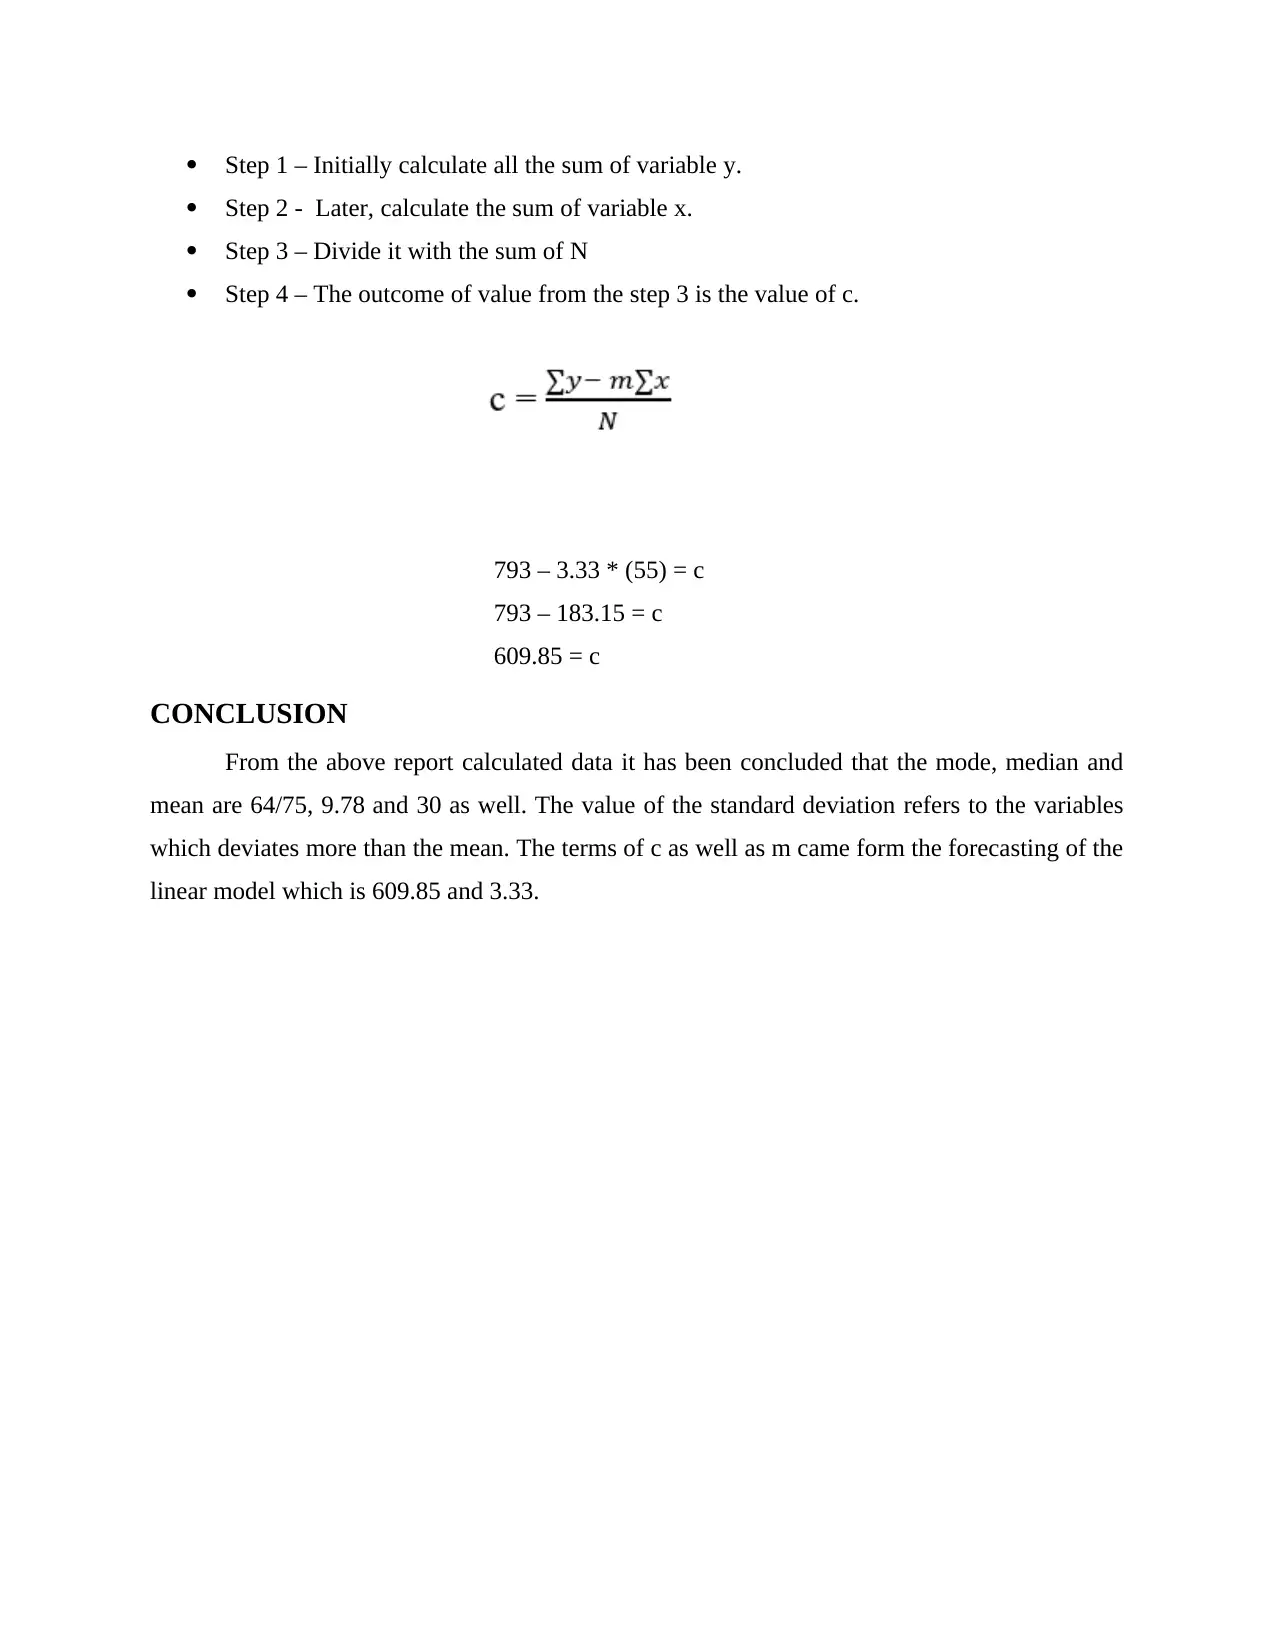
This report provides a detailed analysis of numeracy and data analysis concepts, including step-by-step calculations for mean, median, mode, range, and standard deviation. It defines each statistical measure and illustrates its calculation with a given dataset. The report also explores the linear forecasting model, framing the regression equation and calculating the values of 'm' and 'c'. The conclusion summarizes the calculated data, highlighting the values obtained for mode, median, mean, and standard deviation, as well as the 'c' and 'm' terms derived from the linear forecasting model. The report concludes that the standard deviation indicates the variables' deviation from the mean, and the linear model provides forecast values for 'c' and 'm'.
Document Page
Numeracy and Data
Analysis
tabler-icon-diamond-filled.svg

Paraphrase This Document

Need a fresh take? Get an instant paraphrase of this document with our AI Paraphraser
Document Page
Table of Contents
TASK...............................................................................................................................................3
Discuss the following by framing the step – wise calculations. ................................................3
4. using the linear forecasting model frame the regression equation and calculate the value of
m and c........................................................................................................................................5
CONCLUSION ...............................................................................................................................6
REFERENCES................................................................................................................................7
Document Page
TASK
Discuss the following by framing the step – wise calculations.
Mean – Mean refers to the average of all the numbers or observations. It is one of the
three averages of the central tendency (Alallawi, and et.al., 2021). For instance, if person playing
a cricket match scores runs in its previous 5 innings which are 25, 30, 35, 40, 45 than the
average mean of that person is 35.
In order to calculate the mean its steps are mentioned below:
1st Step – Examine all the numbers or observations given.
2nd Step – Add all the above values that are given.
3rd Step – Tally the entire number of the observation.
4th Step – Division of the sum of the observation to all the number of the values.
Sum of observation/ Total number of observation = Mean.
793 / 10 = Mean.
Mean = 79.3
Median – It refers to the value that is derived after arrangement of the given data in
descending or ascending way. After that the middle value of the series is refers to the median of
the series (Karakolidis, and et.al., 2021).
In order to calculate the median its steps are mentioned below:
1st Step – Initially, numbers need to be arranged in the ascending order which means
smallest number to the largest.
2nd Step – After that it is required to calculate the number of the observation either if it is
even or odd.
3rd Step – If the number is Even, then the formula which is being utilised is (N/2 )
4th Step – If the numerical is in odd then the formula will be ( (N+1)/2 )
5th Step - The following outcome is the place of the median.
Median = ( N+1)/ 2 = if ' N' is odd number
(N/2 ) = If ' N' is even number
Document Page
In the following situation all the given data are in form of percentage:
80, 75, 64, 64, 89, 75, 94, 77, 87, 88
64, 64, 75, 75, 77, 80, 87, 88, 89, 94
(N/2) = Median
= 10/2
= 5
Mode – It is the numerical value that has obtain several number of times.
In order to calculate the Mode its steps are mentioned below:
1st Step – Gather and organise the given data.
2nd Step – Identify all the distinct terms.
3rd Step – Analyse and count the frequency of occurrence of the data.
4th Step – So the number which is occurred most of the time is Mode.
64, 64, 75, 75, 77, 80, 87, 88, 89, 94
In accordance to the above given data it is understood that 64 and 75 is the most
occurring terms and this kind of the mode is called Bimodal.
Range :
In order to calculate the range its steps are mentioned below:
1st Step – Arrangement of all the available data.
2nd Step –After that, determining the highest as well as lowest term.
3rd Step – Minus the lowest term from the hight one.
4th Step – Range is the result of the above calculation.
Maximum Number – Minimum Number = Range
94 – 64 = Range
30 = Range
Standard Deviation :
In order to calculate the Standard Deviation its steps are mentioned below:
1st Step – Initially we required to identify the mean of the provided data.
2nd Step – We need to find out difference between value and the mode of the data from
each of the observation.
3rd Step – Addition of all the values which are included in step 2.
4th Step – Divide by number if terms ( n)
tabler-icon-diamond-filled.svg

Paraphrase This Document

Need a fresh take? Get an instant paraphrase of this document with our AI Paraphraser
Document Page
5th Step – At at last square root the result of Step 4.
(xi – μ) 2 / N= Standard Deviation
= √ (956.1) / 10
= √ 95.61
= 9.78
4. using the linear forecasting model frame the regression equation and calculate the value of m
and c.
Linear Forecasting Model – It anticipates the future values which are based on the past
values in the linear (Nurfatanah, and et.al., 2021).
Y= mx + c
in which dependent variable is the 'y'
'mx' is the autonomous variable
in it 'c' is the constant
In order to calculate the m its steps are mentioned below:
step 1 - Multiplication of both the variables X and Y that are named as humidity and
days.
Step 2 – Do the addition of the above calculation.
Step 3 – Multiplication of both the factors.
Step 4 – Calculation of (x) 2 at the end in order to put the values in the formula.
Step 5 – The outcome value will be of m.
m= 10 (4636) – (55) * (793) / 10 * (385) – (55) 2
m= 46360 – 43615 / 3850 - 3025
m= 2745 / 825
m= 3.33
Steps of calculation of the c.
Document Page
Step 1 – Initially calculate all the sum of variable y.
Step 2 - Later, calculate the sum of variable x.
Step 3 – Divide it with the sum of N
Step 4 – The outcome of value from the step 3 is the value of c.
793 – 3.33 * (55) = c
793 – 183.15 = c
609.85 = c
CONCLUSION
From the above report calculated data it has been concluded that the mode, median and
mean are 64/75, 9.78 and 30 as well. The value of the standard deviation refers to the variables
which deviates more than the mean. The terms of c as well as m came form the forecasting of the
linear model which is 609.85 and 3.33.
Document Page
REFERENCES
Books and Journals
Alallawi, B., and et.al., 2021. Special educators’ experiences of a numeracy intervention for
autistic students. European Journal of Special Needs Education, pp.1-14.
Karakolidis, A., and et.al., 2021. Educational inequality in primary schools in Ireland in the early
years of the National Literacy and Numeracy Strategy: An analysis of National
Assessment data. Irish Journal of Education, 44.
Nurfatanah, N., and et.al., 2021, April. Development of matemathic media games education
based on e-learning in the Planting of Basic Concepts in Numeracy. In Journal of
Physics: Conference Series (Vol. 1869, No. 1, p. 012127). IOP Publishing.
chevron_up_icon
1 out of 7
circle_padding
hide_on_mobile
zoom_out_icon
[object Object]