Report on Numeracy and Data Analysis: Durham Humidity Data Study
VerifiedAdded on 2023/06/14
|10
|1615
|134
Report
AI Summary
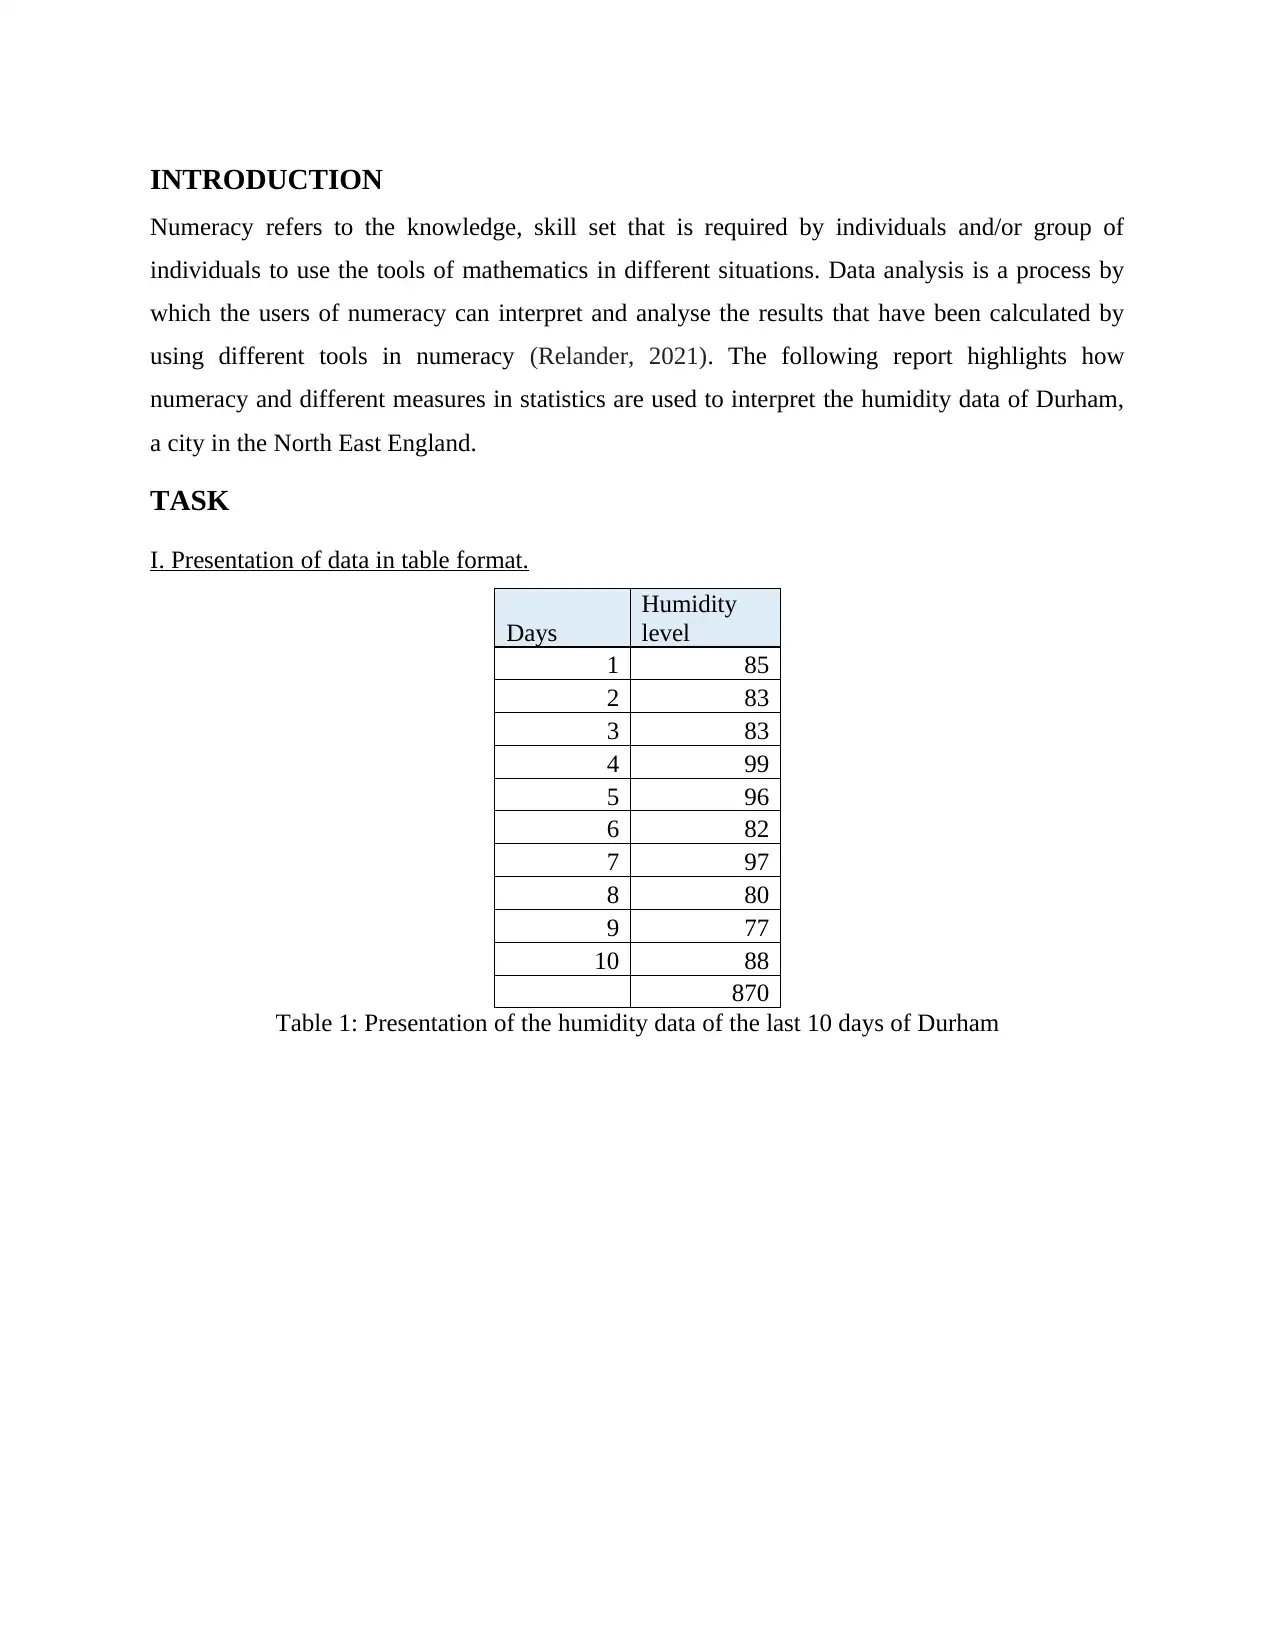
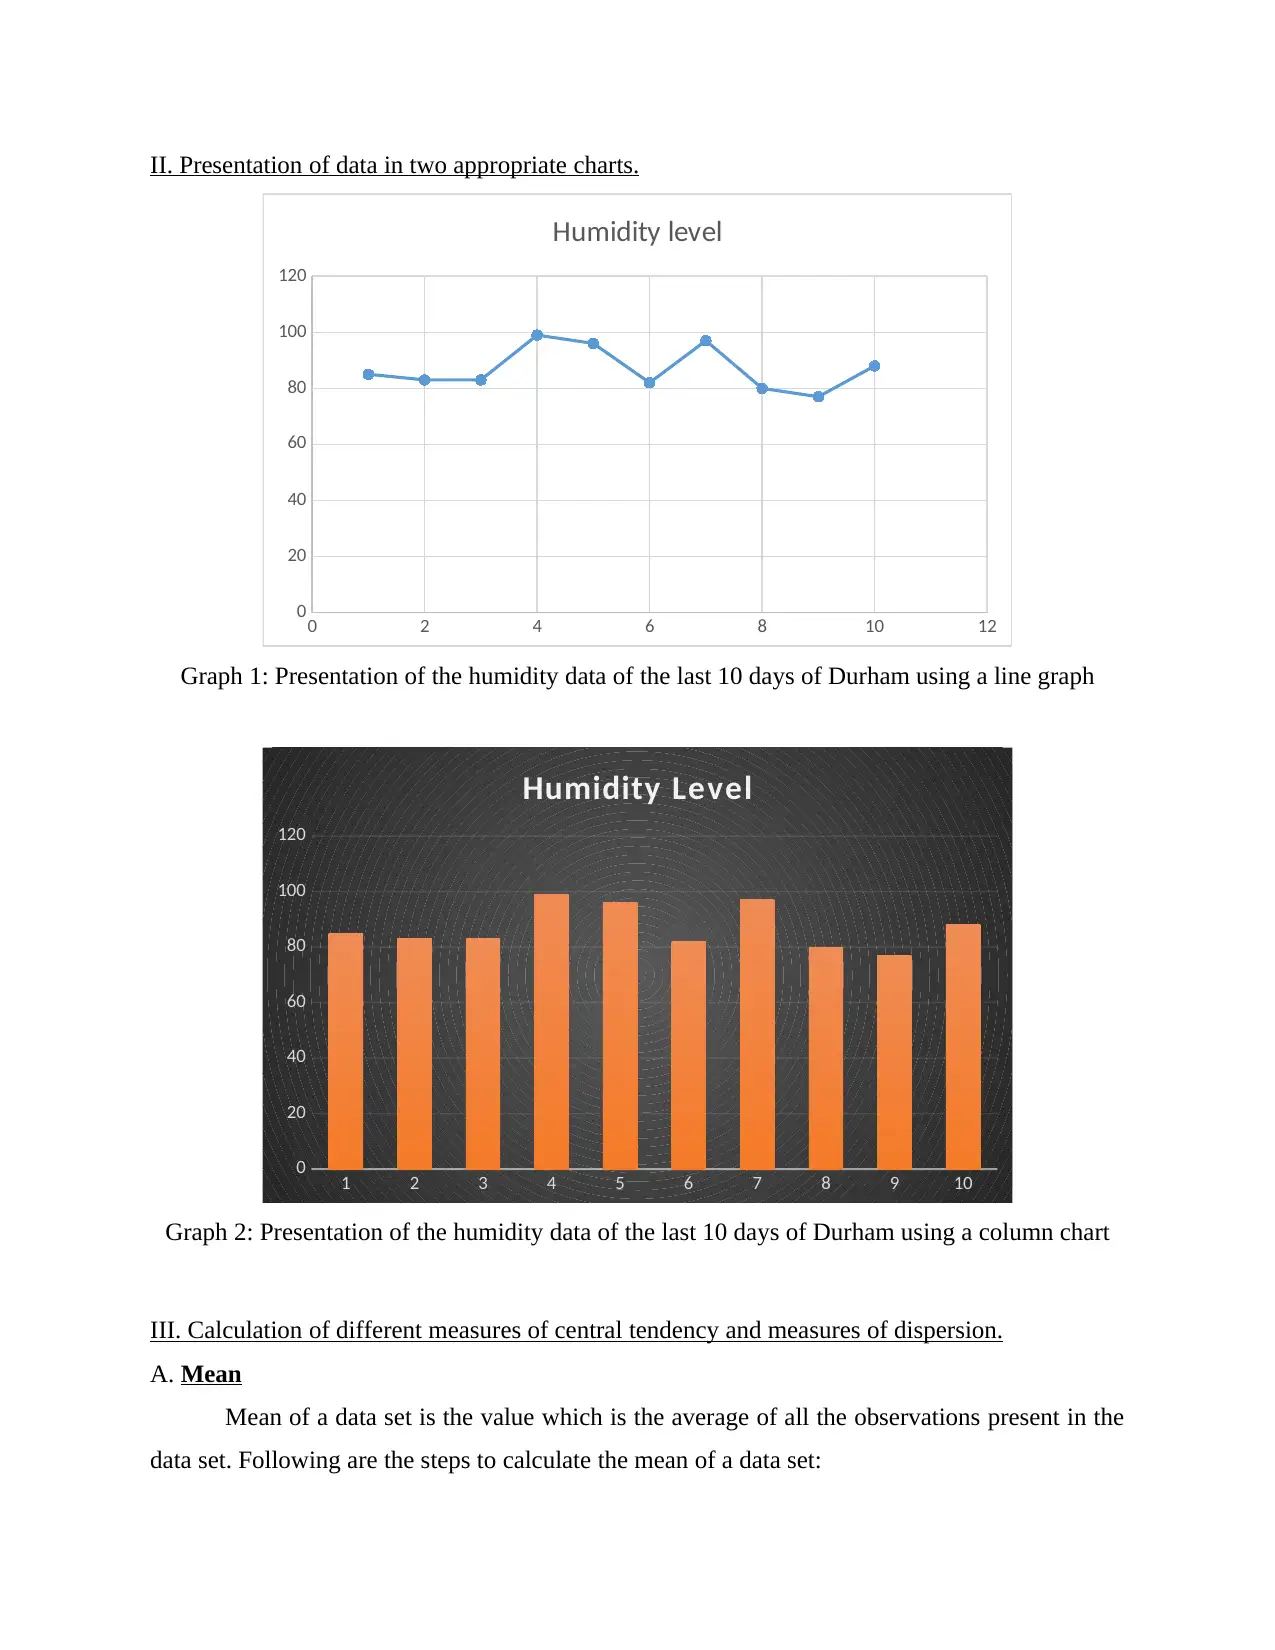
This report demonstrates the application of numeracy and data analysis techniques to interpret humidity data collected in Durham, North East England. It includes the presentation of data in tabular format and through line and column charts. The report further calculates and interprets various measures of central tendency, including mean, median, and mode, as well as measures of dispersion such as range and standard deviation. Finally, it constructs a linear forecasting model to predict future humidity levels based on the provided dataset, illustrating the practical use of statistical tools in environmental data analysis. Desklib offers a wide range of resources for students, including solved assignments and past papers.
1 out of 10
Related Documents


Your All-in-One AI-Powered Toolkit for Academic Success.
+13062052269
info@desklib.com
Available 24*7 on WhatsApp / Email
![[object Object]](/_next/static/media/star-bottom.7253800d.svg)
Copyright © 2020–2026 A2Z Services. All Rights Reserved. Developed and managed by ZUCOL.