Report on Numeracy and Data Analysis of Humidity Levels in Wales
VerifiedAdded on 2023/06/15
|10
|1702
|462
Report
AI Summary
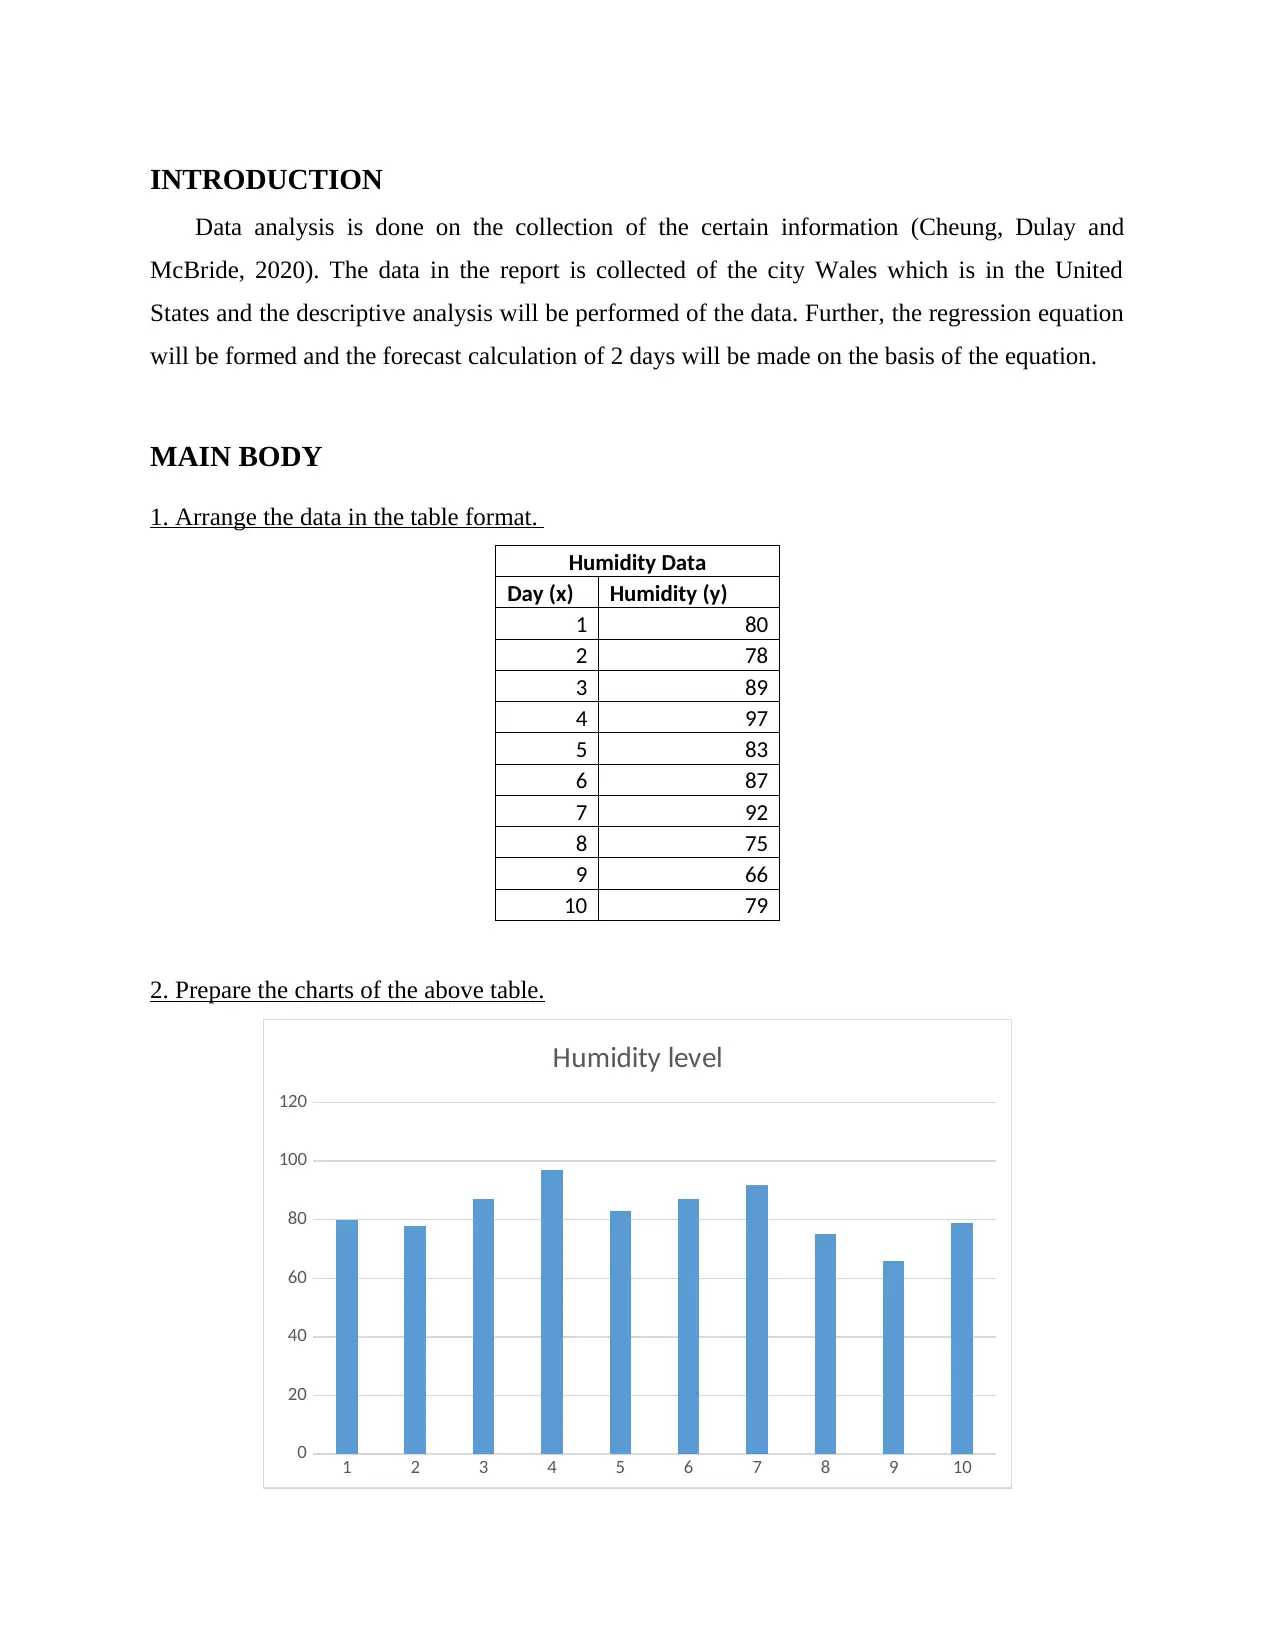
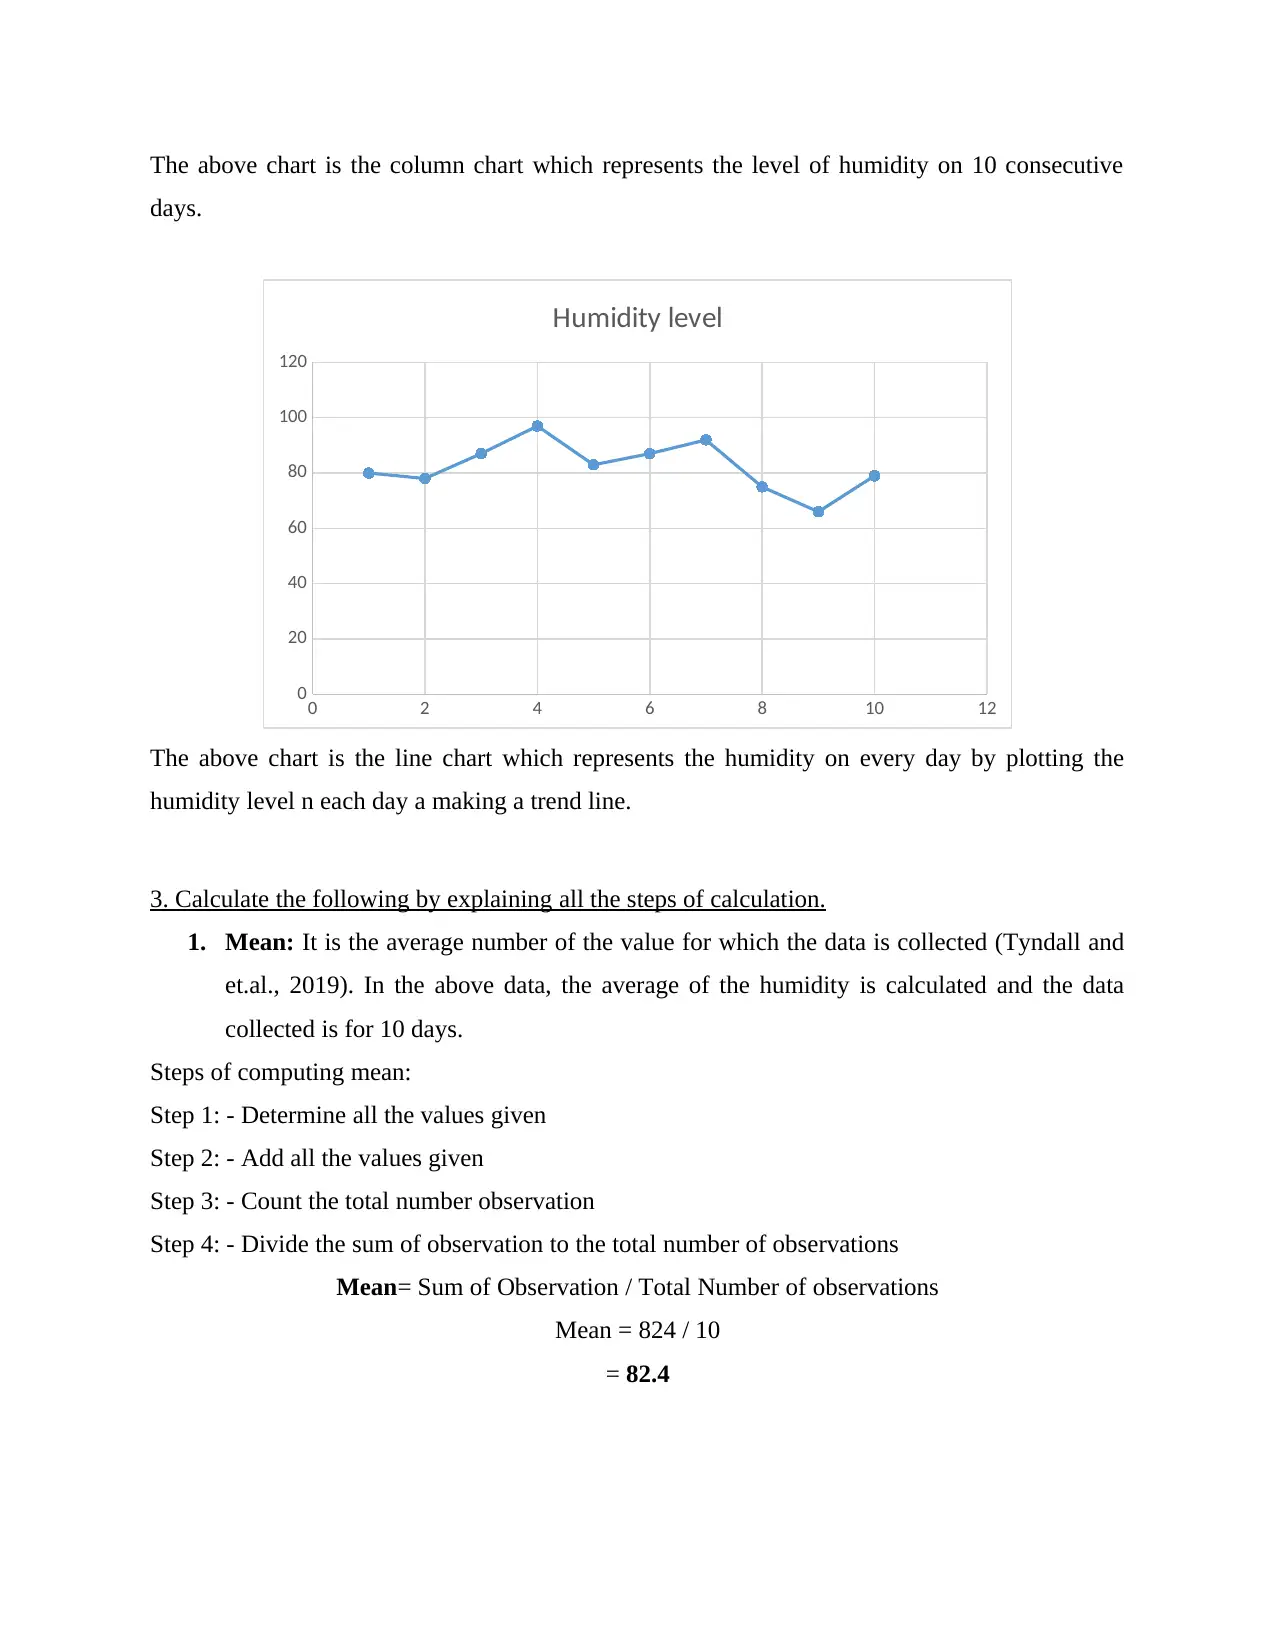
This report presents a data analysis of humidity levels in Wales, utilizing various statistical methods and a linear forecasting model. The analysis includes arranging humidity data collected over ten days into a table and generating column and line charts to visualize the data. Key statistical measures such as mean, median, mode, range, and standard deviation are calculated with detailed step-by-step explanations. Furthermore, a linear forecasting model is applied to frame a regression equation, calculating the values of 'm' (slope) and 'c' (vertical intercept). Based on this model, the humidity levels for day 11 and day 13 are forecasted. The report concludes by summarizing the findings of the data evaluation and the application of the linear forecasting model.
1 out of 10
Related Documents


Your All-in-One AI-Powered Toolkit for Academic Success.
+13062052269
info@desklib.com
Available 24*7 on WhatsApp / Email
![[object Object]](/_next/static/media/star-bottom.7253800d.svg)
Copyright © 2020–2026 A2Z Services. All Rights Reserved. Developed and managed by ZUCOL.