Numeracy and Data Analysis: Forecasting London Humidity - CCCU Report
VerifiedAdded on 2023/06/14
|7
|1237
|363
Homework Assignment
AI Summary
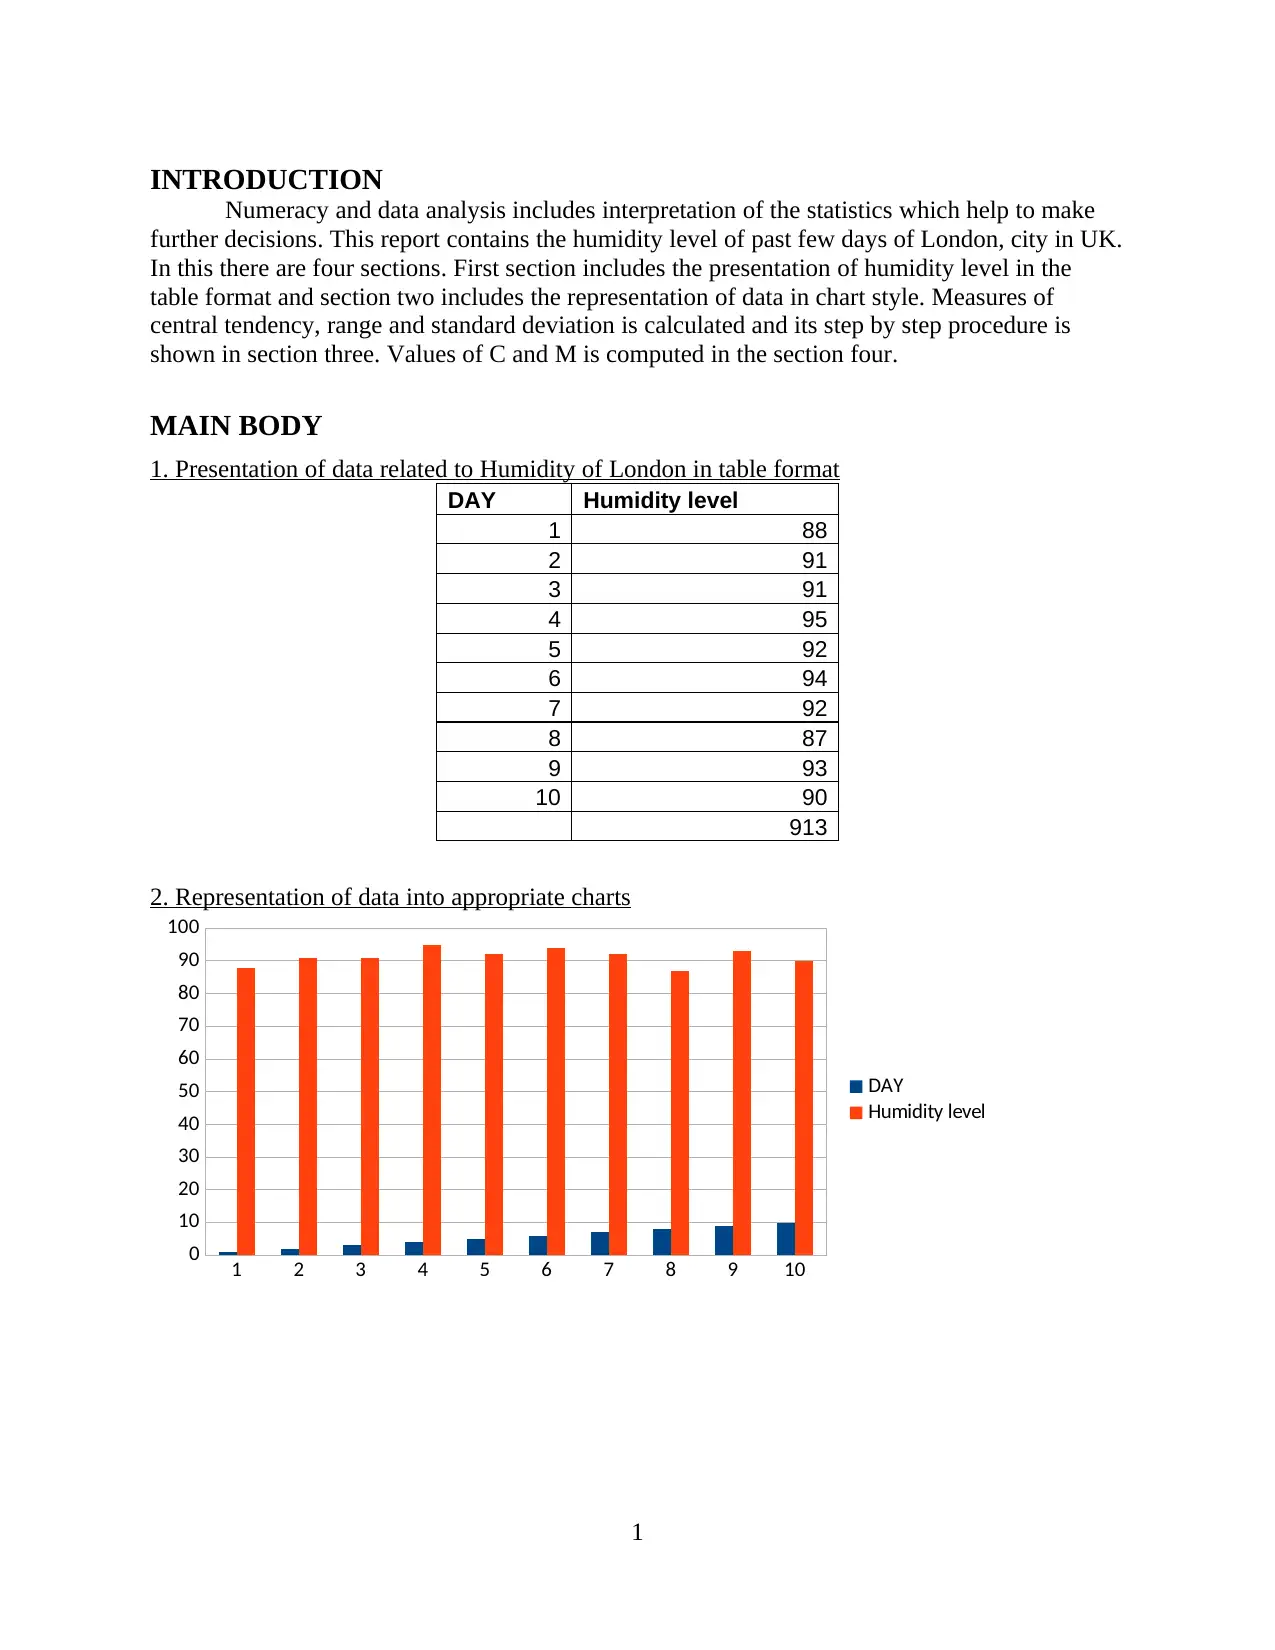
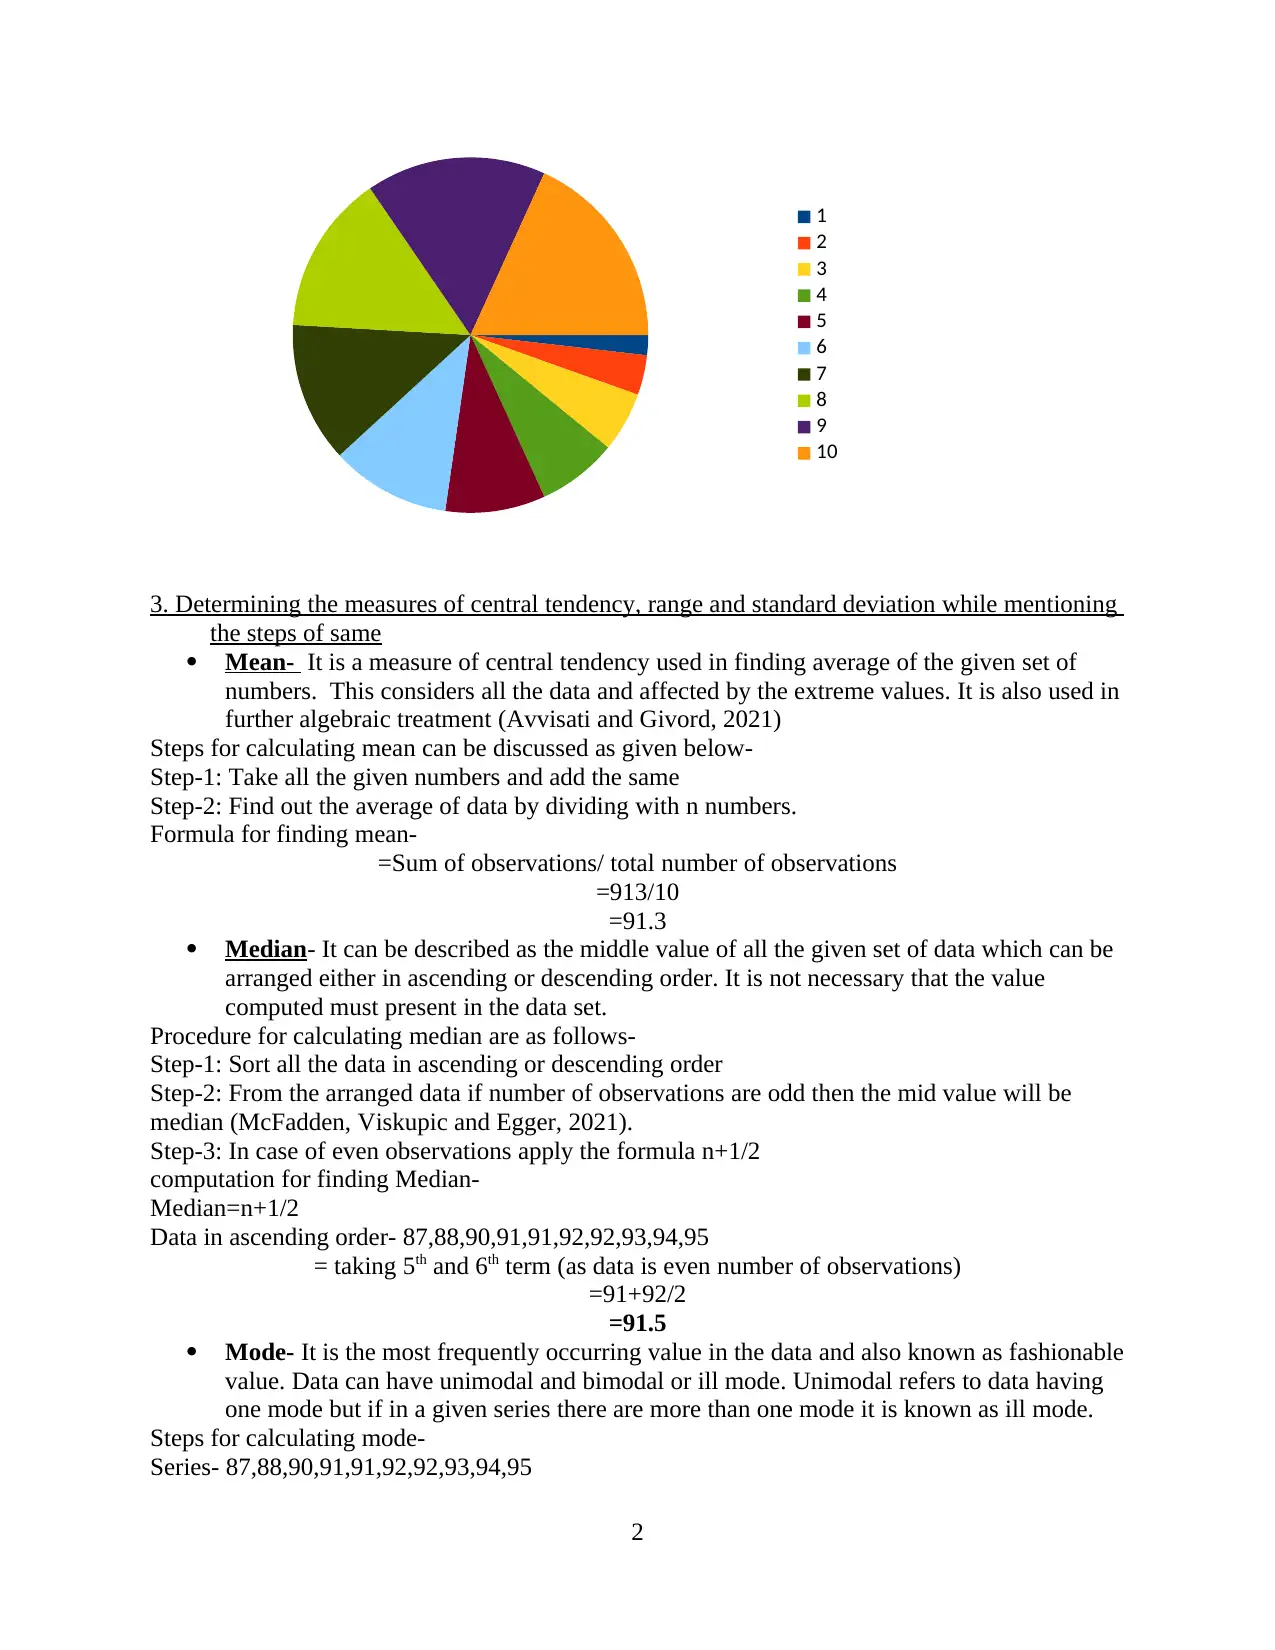
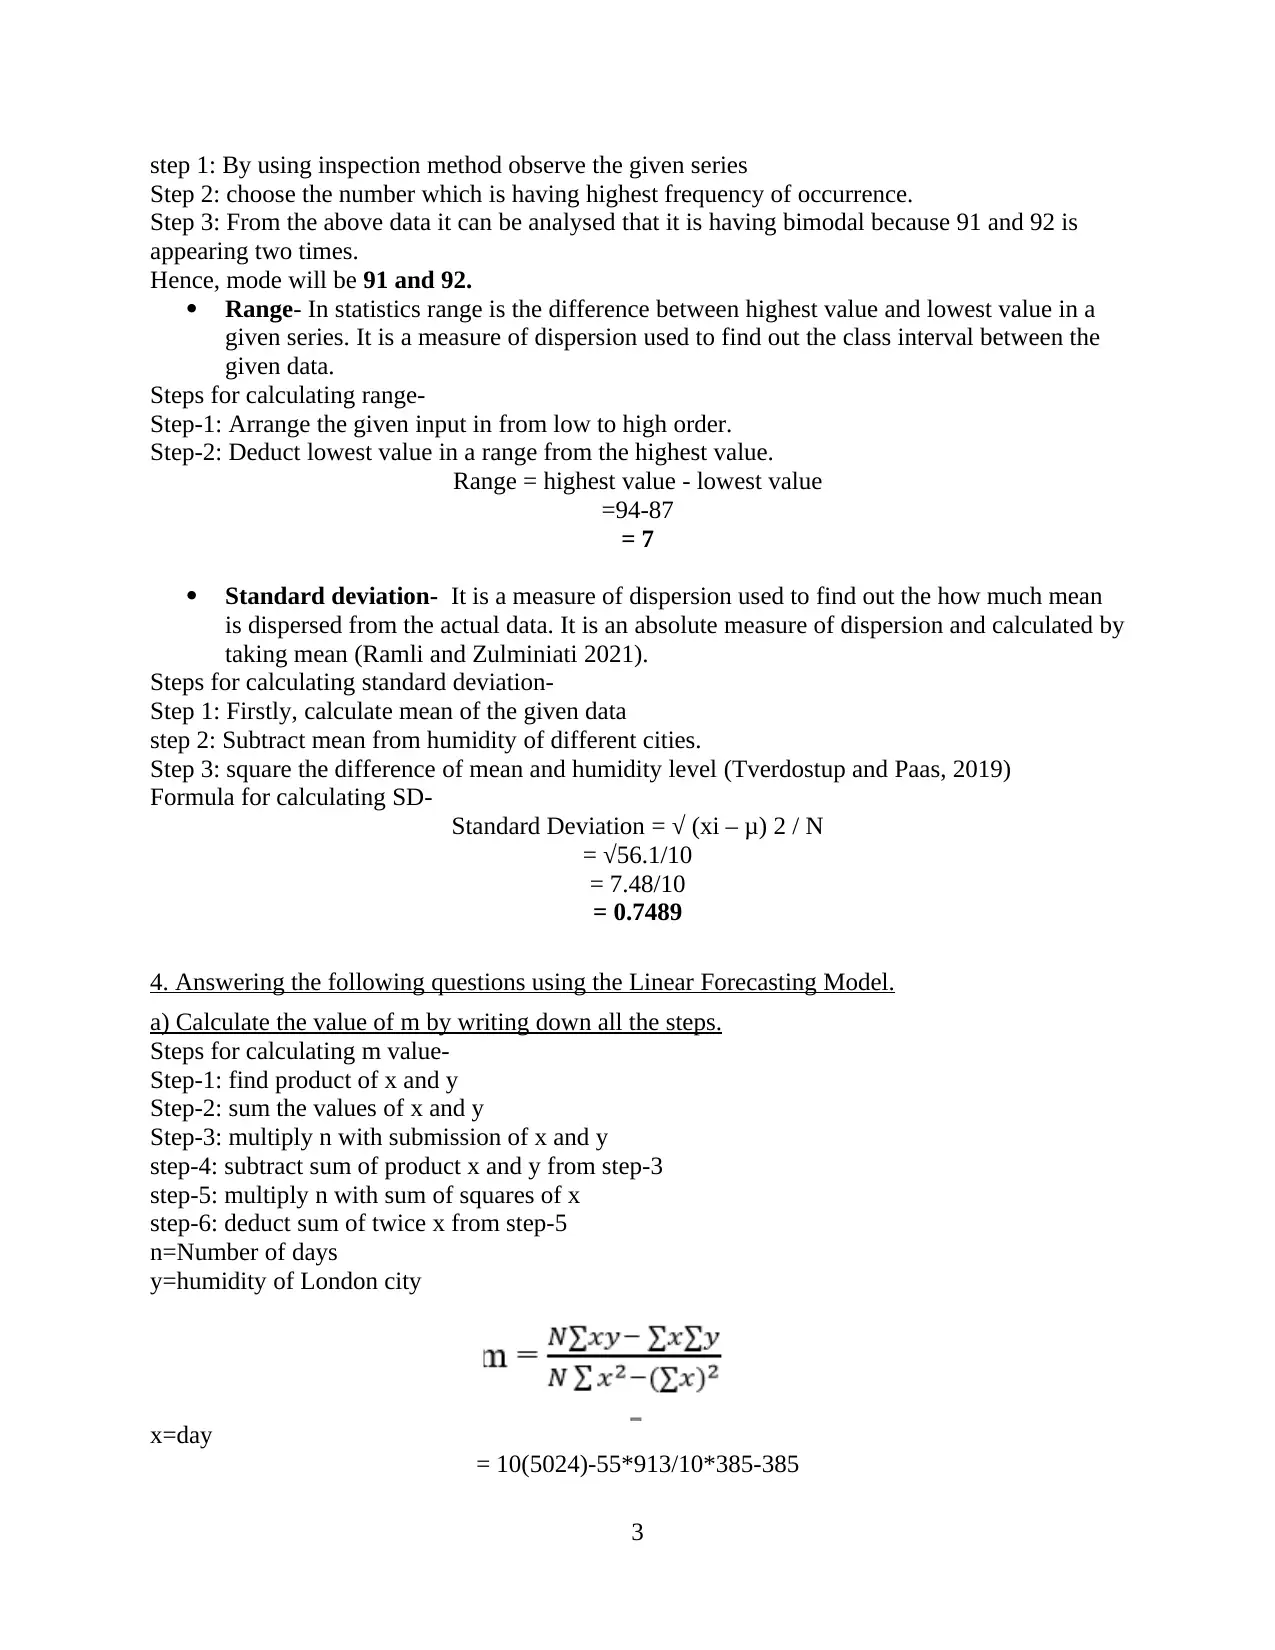
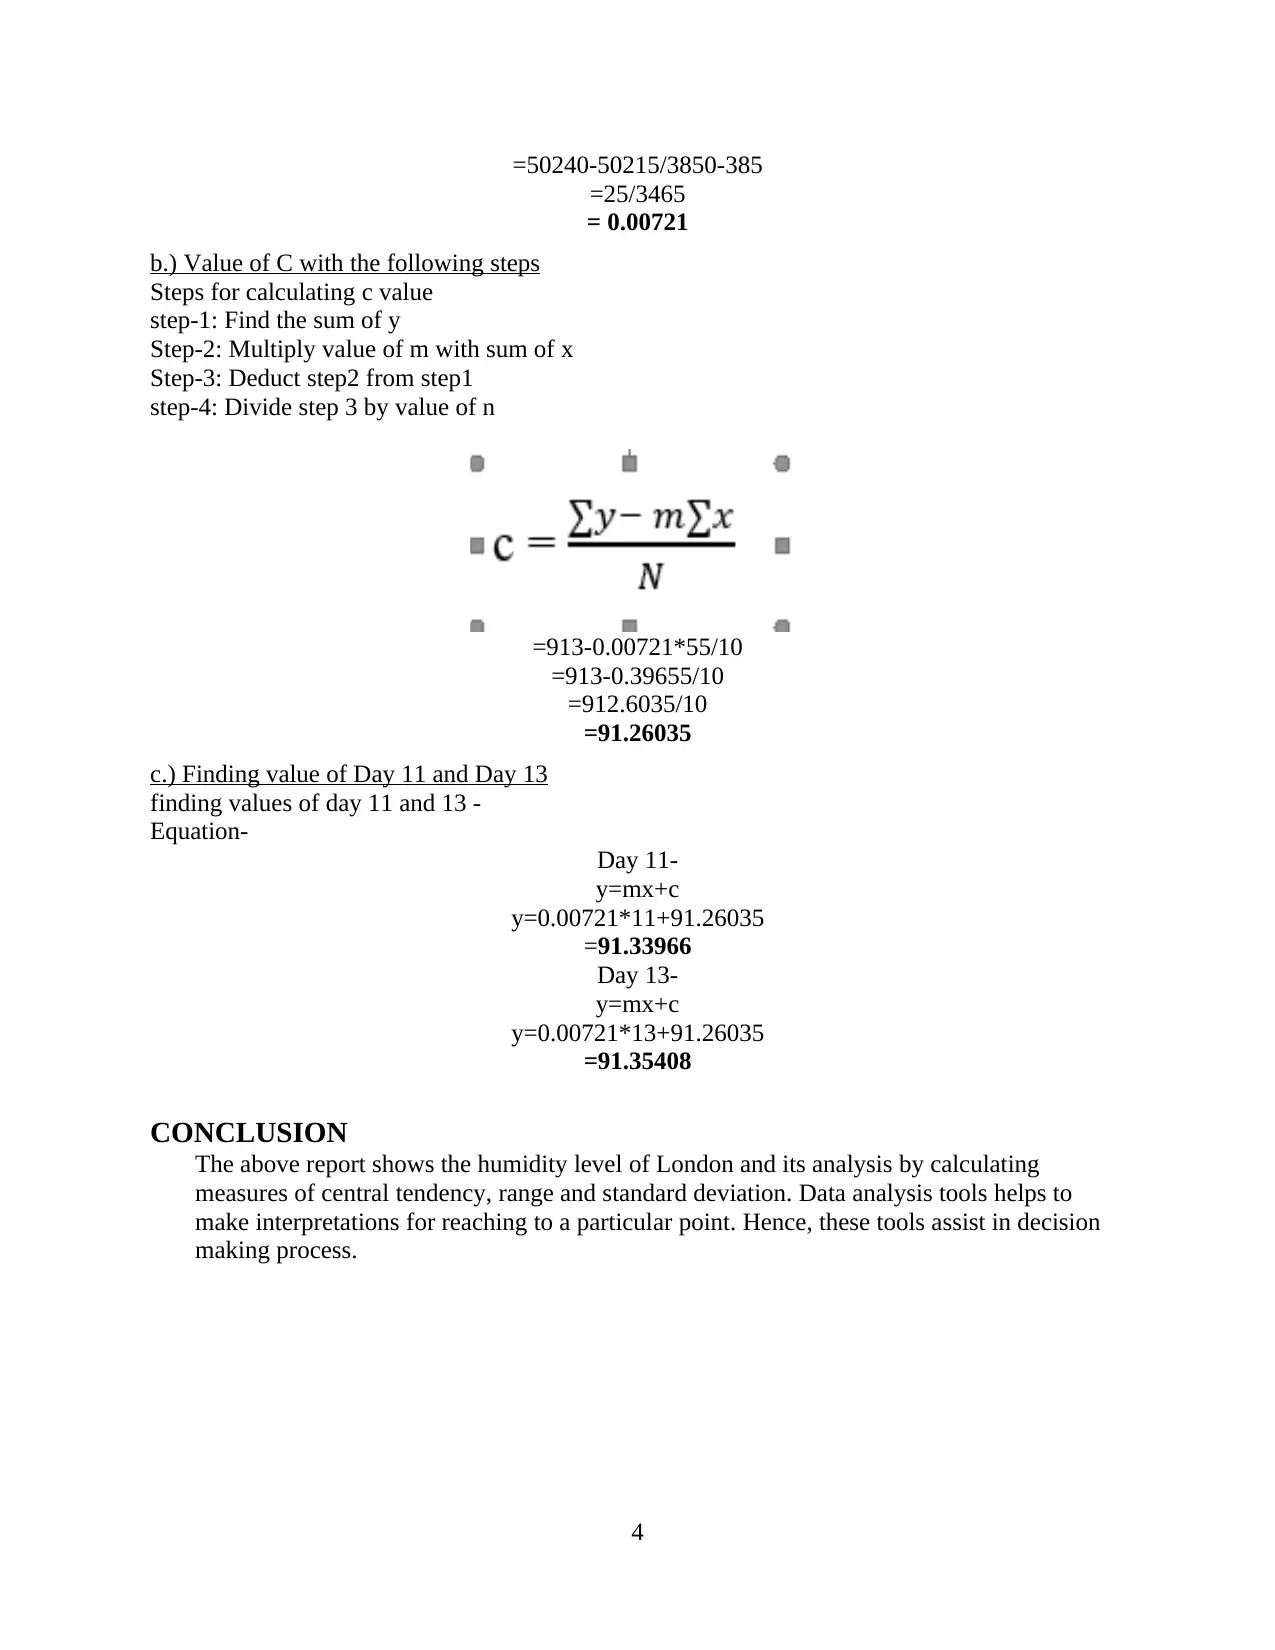
This assignment provides a detailed analysis of London's humidity levels using various statistical methods. It includes the presentation of humidity data in tabular and chart formats, followed by the calculation of measures of central tendency (mean, median, mode), range, and standard deviation, with a step-by-step explanation of each calculation. The assignment further applies a linear forecasting model to predict humidity levels for future days, demonstrating the calculation of 'm' and 'c' values and their use in forecasting. The report concludes by summarizing the findings and emphasizing the role of data analysis tools in decision-making. Desklib offers a wide array of study resources, including similar solved assignments and past papers, to support students in their academic endeavors.
1 out of 7
Related Documents


Your All-in-One AI-Powered Toolkit for Academic Success.
+13062052269
info@desklib.com
Available 24*7 on WhatsApp / Email
![[object Object]](/_next/static/media/star-bottom.7253800d.svg)
Copyright © 2020–2026 A2Z Services. All Rights Reserved. Developed and managed by ZUCOL.