Report on Numeracy and Data Analysis of London City Humidity

Verified

Added on  2023/06/04

|11
|1354
|476
Report
AI Summary
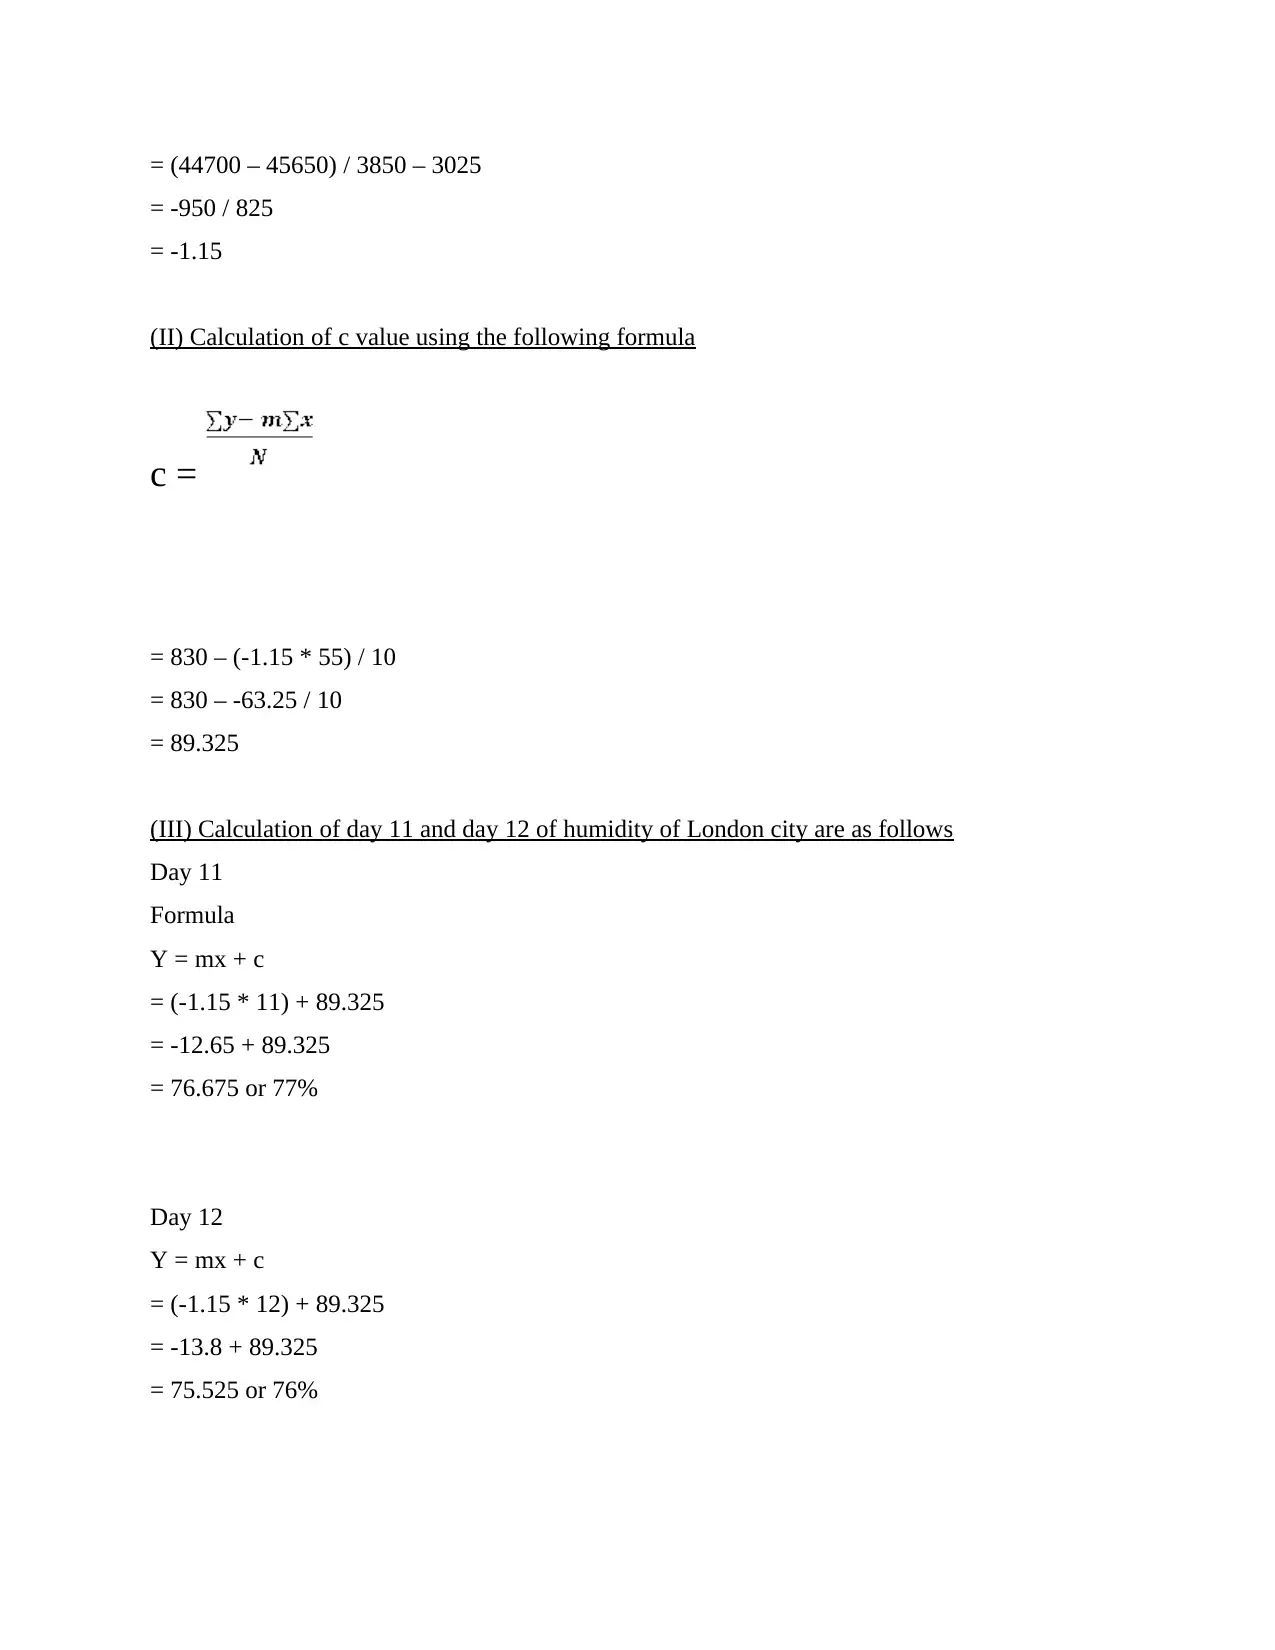
This report provides a comprehensive analysis of London's humidity data over ten consecutive days, employing both descriptive statistics and linear forecasting techniques. The analysis includes the calculation and interpretation of key descriptive measures such as mean, median, mode, range, and standard deviation to understand the central tendency and variability of the humidity levels. Furthermore, a linear forecasting model is applied to predict the humidity for the 11th and 12th days, using calculated 'm' and 'c' values derived from the dataset. The report concludes that data analysis, facilitated by appropriate tools, enables quick and effective insights, offering predictions for future humidity levels based on historical data.
Document Page
Numeracy and Data Analysis
tabler-icon-diamond-filled.svg

Paraphrase This Document

Need a fresh take? Get an instant paraphrase of this document with our AI Paraphraser
Document Page
Table of Contents
INTRODUCTION...........................................................................................................................3
MAIN BODY..................................................................................................................................3
CONCLUSION................................................................................................................................3
REFERENCES................................................................................................................................1
Document Page
INTRODUCTION
Data analysis is the process of inspecting, cleansing, transforming and modelling the data
with the aim to convert the raw data into useful information (Best and et.al., 2022). The present
report will be based on data analysis regarding London city humidity. Further, the report will
compute and discuss the descriptive statistics and linear forecasting of the dataset. Lastly, the
report will also forecast the humidity of day 11 and 12 using the linear forecasting formula.
1. Arranging the humidity of London city for ten consecutive days
Serial No. Date Humidity (%)
1 11th September 2022 94
2 12th September 2022 88
3 13th September 2022 83
4 14th September 2022 94
5 15th September 2022 82
6 16th September 2022 67
7 17th September 2022 76
8 18th September 2022 76
9 19th September 2022 77
10 20th September 2022 93
2. Presenting the data using different charts
Column chart
Document Page
Line chart
tabler-icon-diamond-filled.svg

Paraphrase This Document

Need a fresh take? Get an instant paraphrase of this document with our AI Paraphraser
Document Page
3. Calculate and discussion on the following descriptive statistics
(I) Mean: It means the average value of the dataset.
Formula = μ =
= (94 + 88 + 83 + 94 + 82 + 67 + 76 + 76 + 77 + 93) / 10
= 830 / 10
= 83
Interpretation: On the basis of the above result, it is interpreted that average humidity
percentage of London city over the past 10 consecutive days is 83%.
(II) Median: The mid value of dataset used to identify central tendency.
Formula = Sum of midterm / number if two term
= (82 + 67) / 2
= 74.5
Interpretation: Median is also a type of descriptive statistics which specify the middle value of
the dataset. After analysing the result, it is interpreted that the middle value of the humidity
dataset of London city is 74.5%.
(III) Mode: This state the value which occur frequent in the given dataset.
Formula = data which frequently appear
= 94 and 76
Interpretation: On the basis of the above result, it is analysed that 94% and 76% is a humidity of
London city which repeated more often (Megawati and Sutarto, 2021).
(IV) Range: It means the difference between maximum and minimum value of the dataset.
Formula = Maximum – Minimum
Document Page
= 94 – 67
= 27
Interpretation: The difference between the maximum and minimum value of the data set is
range. After analysing the result, it is interpreting ate that the highest humidity is 94% and lowest
humidity is 67% and range is 27%. It defines the central tendency of the data set (Anam and
et.al., 2020).
(V) Standard deviation: It specify the value by which a specific value deviate from its mean
value.
Formula = σ =
Serial
No. Date Humidity
(%) X
x-
mean
x-
mean^2
1
11th
September
2022
94 11 121
2
12th
September
2022
88 5 25
3
13th
September
2022
83 0 0
4
14th
September
2022
94 11 121
5
15th
September
2022
82 -1 1
Document Page
6
16th
September
2022
67 -16 256
7
17th
September
2022
76 -7 49
8
18th
September
2022
76 -7 49
9
19th
September
2022
77 -6 36
10
20th
September
2022
93 10 100
Mean 83 758
σ = √758 / 10
8.70
Interpretation: On the basis of the above result, it is interpreted that the standard deviation is
8.70. This indicate the low standard deviation which means that the values in the dataset are
generally positioned close to the mean. It means the humidity of London city of each day is close
to its mean value such as 83 (Li, 2022).
4. Calculation and discussion of the followings linear forecasting model
Serial
No. y Date Humidity
(%) x xy x^2
1
11th
September
2022
94 94 1
2
12th
September
2022
88 176 4
tabler-icon-diamond-filled.svg

Paraphrase This Document

Need a fresh take? Get an instant paraphrase of this document with our AI Paraphraser
Document Page
3
13th
September
2022
83 249 9
4
14th
September
2022
94 376 16
5
15th
September
2022
82 410 25
6
16th
September
2022
67 402 36
7
17th
September
2022
76 532 49
8
18th
September
2022
76 608 64
9
19th
September
2022
77 693 81
10
20th
September
2022
93 930 100
55 830 4470 385
Linear forecasting formula
Y = mx + c
(I) Calculation of m using the following formula
= m =
= (10 * 4470) – (55 * 830) / (10 * 385) – (55)2
Document Page
= (44700 – 45650) / 3850 – 3025
= -950 / 825
= -1.15
(II) Calculation of c value using the following formula
c =
= 830 – (-1.15 * 55) / 10
= 830 – -63.25 / 10
= 89.325
(III) Calculation of day 11 and day 12 of humidity of London city are as follows
Day 11
Formula
Y = mx + c
= (-1.15 * 11) + 89.325
= -12.65 + 89.325
= 76.675 or 77%
Day 12
Y = mx + c
= (-1.15 * 12) + 89.325
= -13.8 + 89.325
= 75.525 or 76%
Document Page
Interpretation: On the basis of the calculation of m and c value, the forecasting of day 11 and 12
is easily possible. Using the linear forecasting formula, it is forecasted that the humidity of 11th
day of London city that is 21st September 2022 is 77%. While on the same side, it is also
identified that the humidity of London city on 22nd September 2022 is 76% (Yalcin, 2019). The
linear forecasting is one of the best way to predict the future value of the dataset.
CONCLUSION
After summing up the above information, it has been concluded that the analysis of data
became easy and quick with the use of appropriate tools. The present report has analysed the data
regarding humidity of London city of 10 consecutive days using the descriptive statistics tool and
regression model. Further, the report has also computed the mean, median, mode, range and
standard deviation. Moreover, the report has also computed the c and m value in order to inset
into the linear forecasting formula. With the help of linear forecasting model, the report has also
concluded the humidity of 11th and 12th day of London city that is 21st and 22nd September 2022.
tabler-icon-diamond-filled.svg

Paraphrase This Document

Need a fresh take? Get an instant paraphrase of this document with our AI Paraphraser
Document Page
REFERENCES
Books and journals
Best, R. and et.al., 2022. Age declines in numeracy: An analysis of longitudinal data. Psychology
and Aging. 37(3). p.298.
Megawati, L. A. and Sutarto, H., 2021. Analysis numeracy literacy skills in terms of
standardized math problem on a minimum competency assessment. Unnes Journal of
Mathematics Education. 10(2).
Anam, F. and et.al., 2020, July. Improving the Numeracy Mathematics Ability: The Role of
Abacus Learning Model. In Journal of Physics: Conference Series (Vol. 1594, No. 1, p.
012041). IOP Publishing.
Li, T., 2022. Students’ Numeracy and Literacy Aptitude Analysis and Prediction Using Machine
Learning. Journal of Computer and Communications. 10(8). pp.90-103.
Yalcin, S., 2019. Competence Differences in Literacy, Numeracy, and Problem Solving
According to Sex. Adult Education Quarterly. 69(2). pp.101-119.
1
chevron_up_icon
1 out of 11
circle_padding
hide_on_mobile
zoom_out_icon