Analysis of London Temperature Data and Forecasting (Numeracy & Data)
VerifiedAdded on 2023/06/09
|11
|1454
|288
Homework Assignment
AI Summary
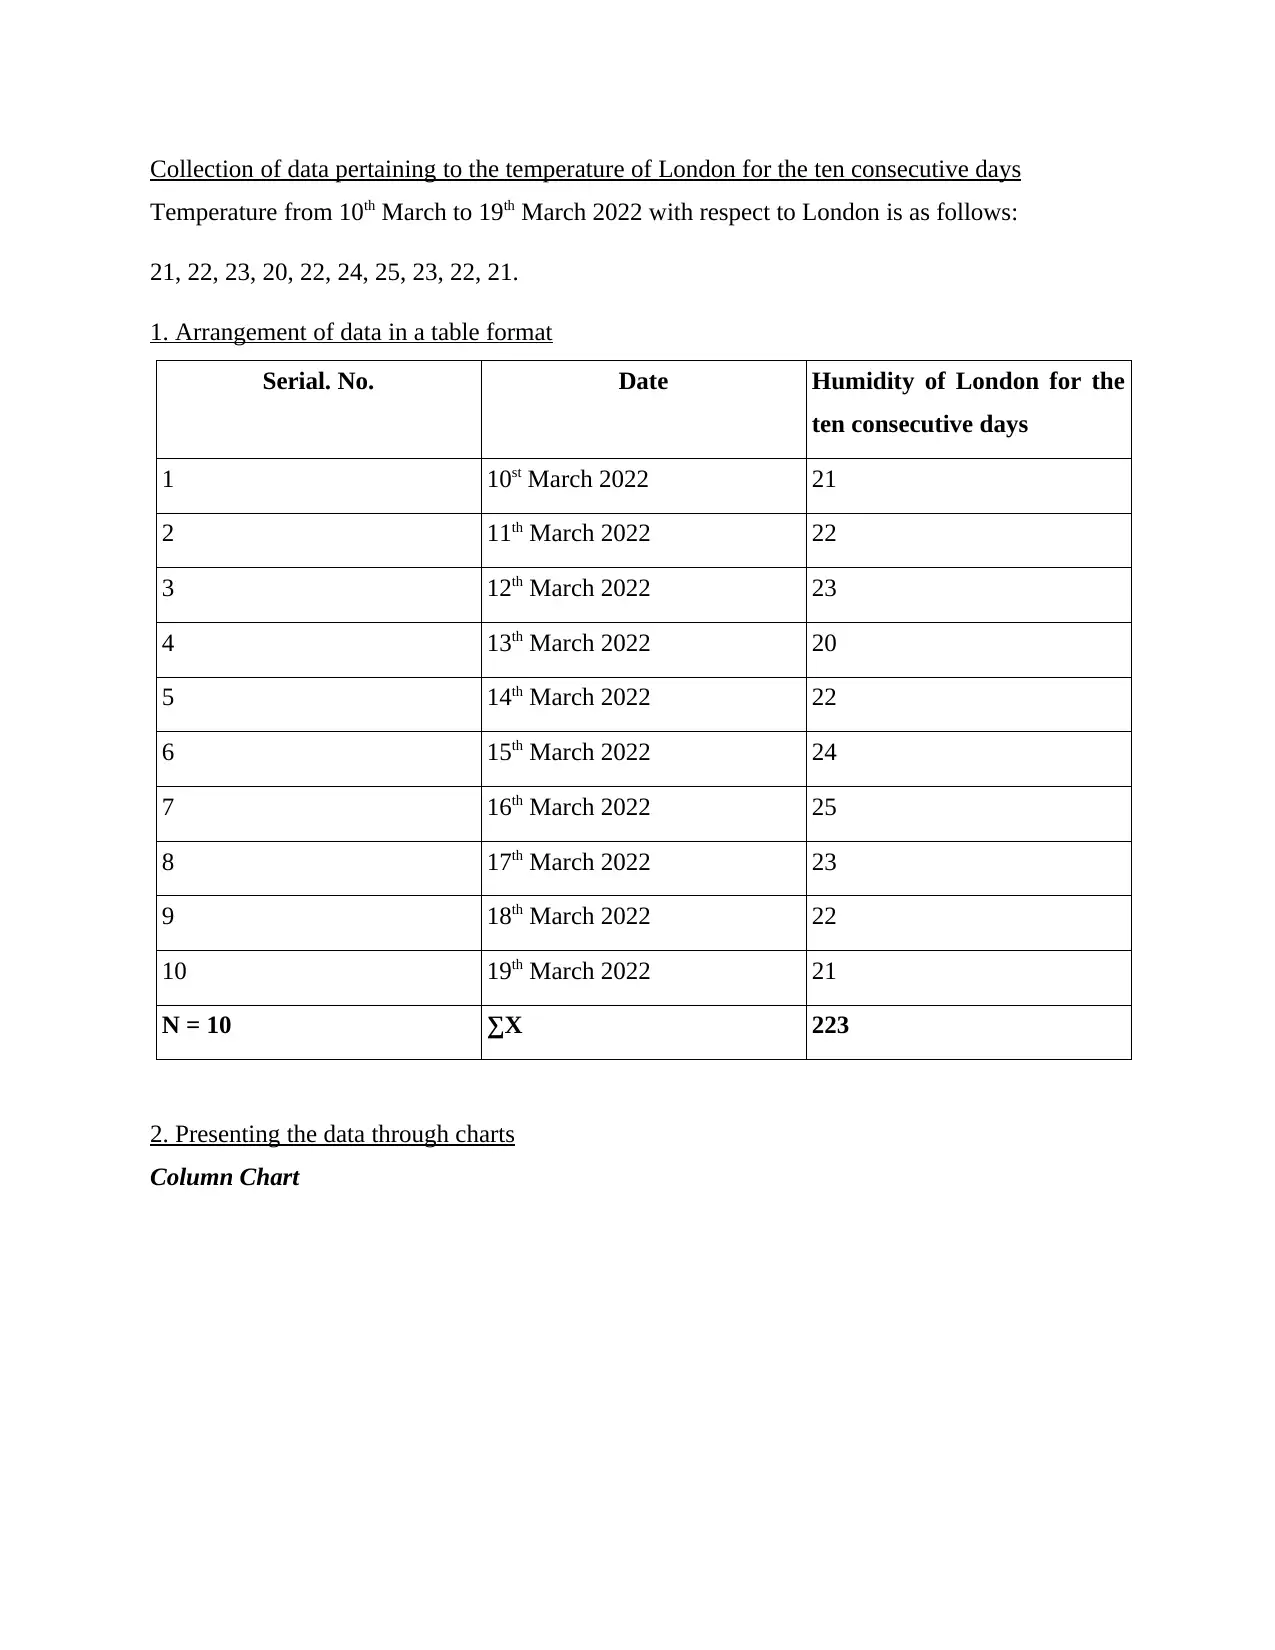
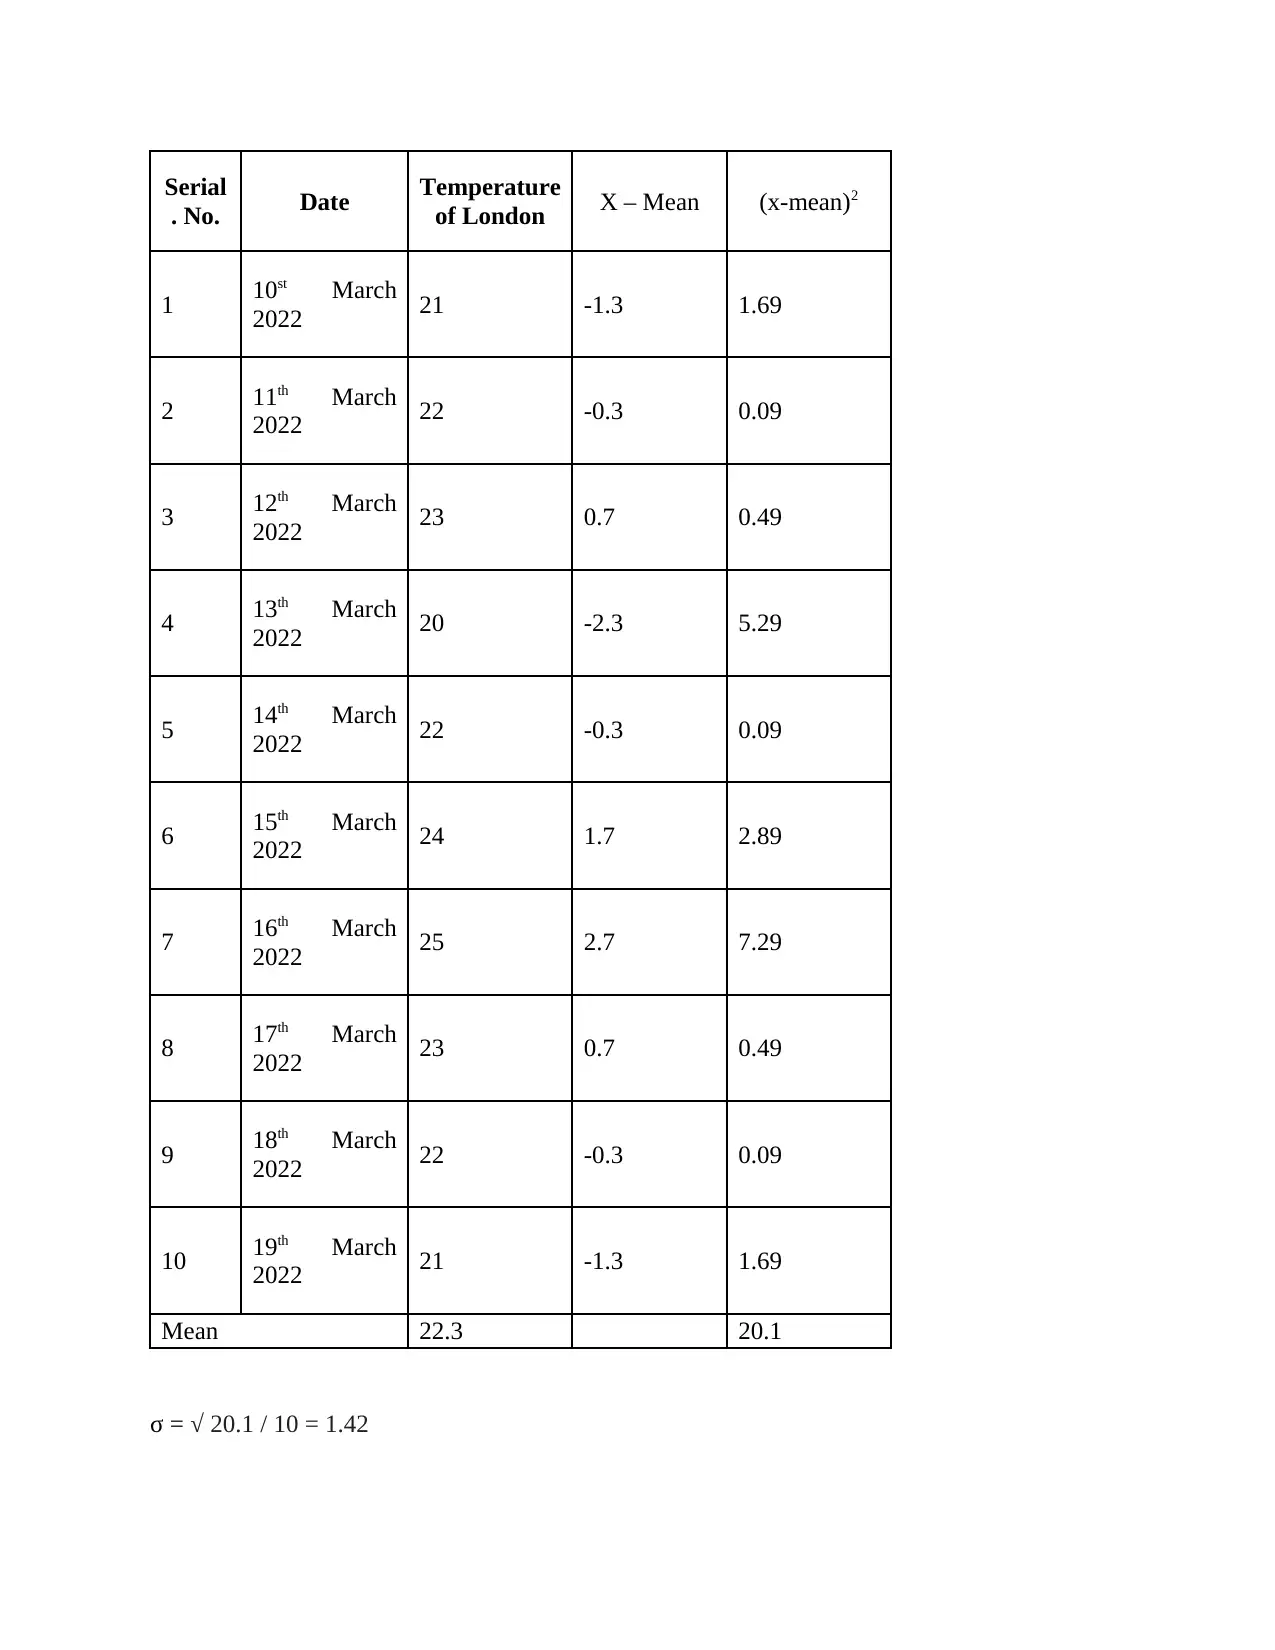
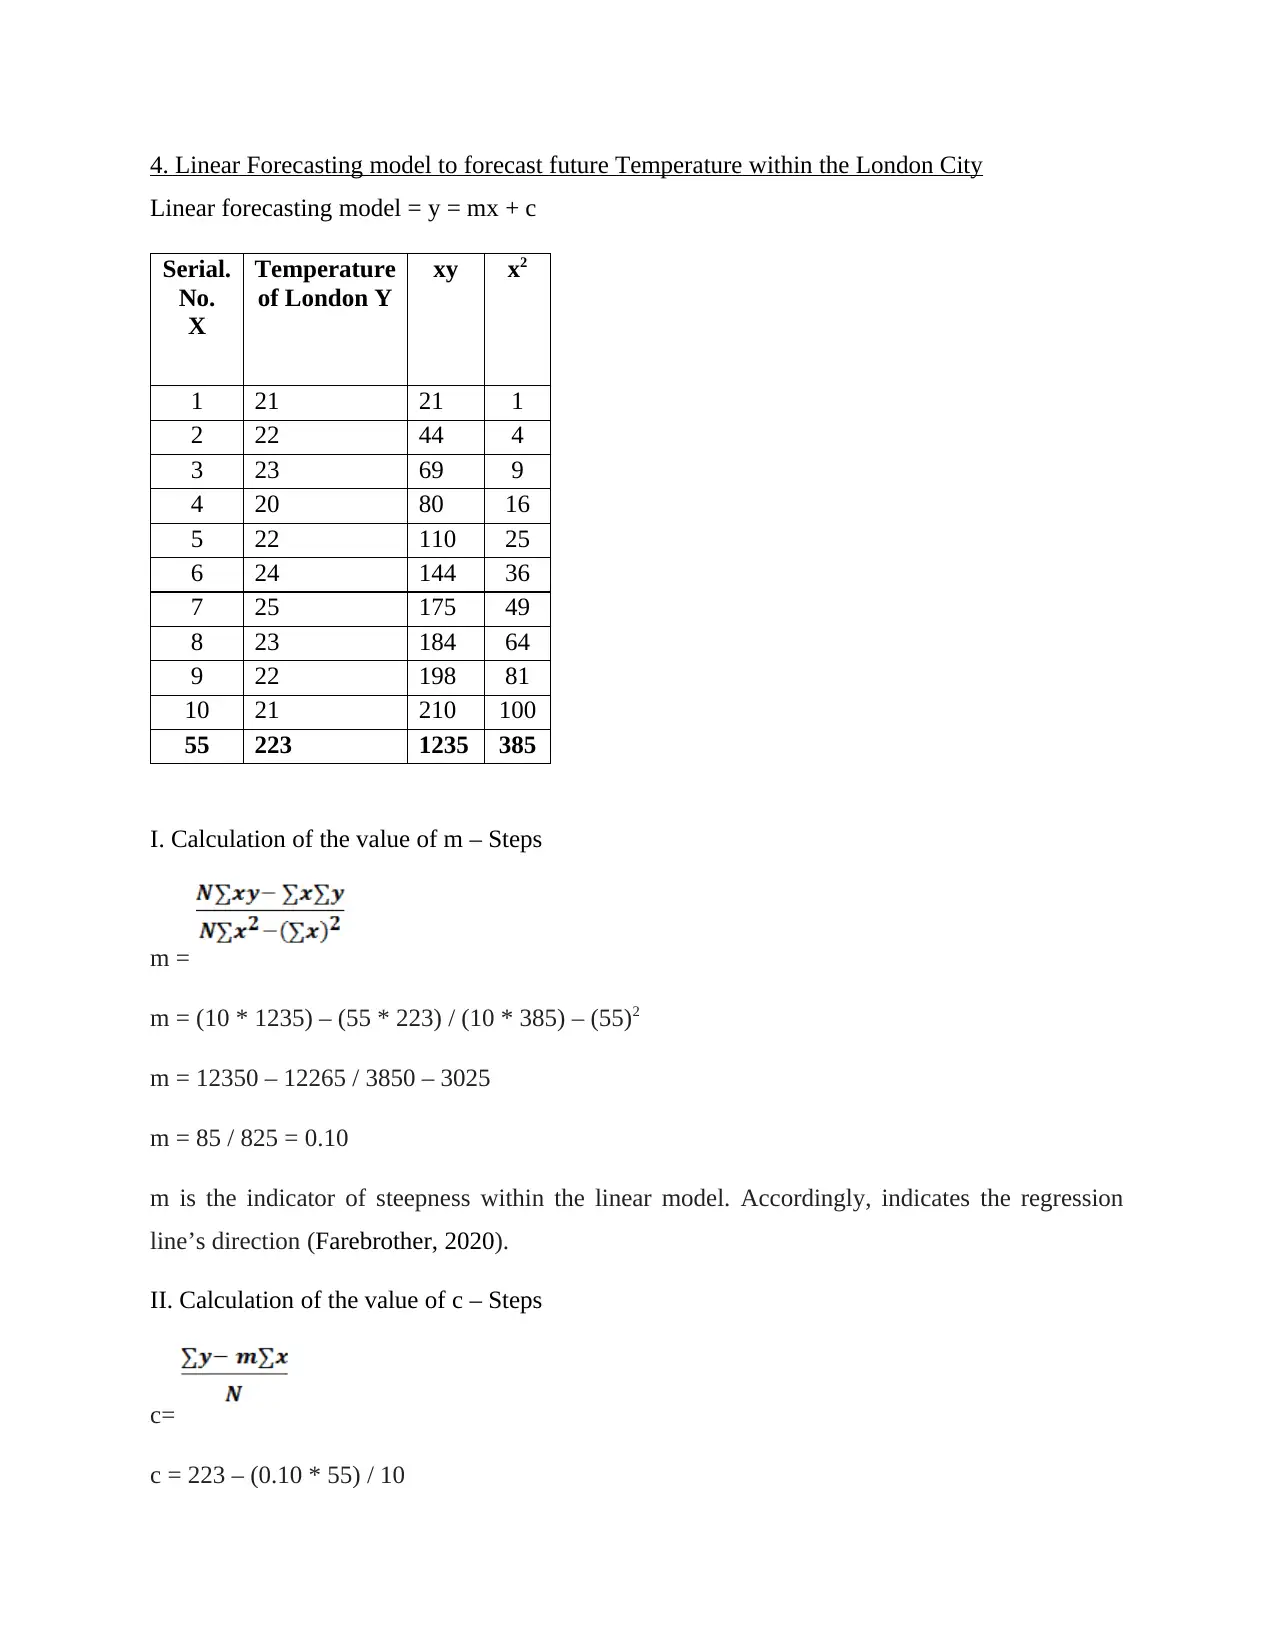
This assignment analyzes temperature data collected in London from March 10th to March 19th, 2022. The solution begins by organizing the temperature readings into a table format, followed by visual representations using column and line charts. The core of the assignment involves the application of statistical tools and techniques to analyze the data, including calculating the mean, median, mode, range, and standard deviation. A linear forecasting model is then employed to predict future temperatures, specifically forecasting the temperatures for the 11th and 14th days. The solution concludes with a list of references to support the methods and concepts used in the analysis.


1 out of 11
Related Documents


Your All-in-One AI-Powered Toolkit for Academic Success.
+13062052269
info@desklib.com
Available 24*7 on WhatsApp / Email
![[object Object]](/_next/static/media/star-bottom.7253800d.svg)
Copyright © 2020–2026 A2Z Services. All Rights Reserved. Developed and managed by ZUCOL.