Report: Analyzing Manchester City Humidity Data with Statistics
VerifiedAdded on 2023/06/04
|10
|1376
|80
Report
AI Summary
This report presents a data analysis of Manchester city's humidity levels from September 11, 2022, to September 20, 2022. It includes various data representations such as column and line charts, alongside calculations and interpretations of descriptive statistics like mean, median, mode, ran...
NUMERACY AND DATA
ANALYSIS
ANALYSIS
Paraphrase This Document
Need a fresh take? Get an instant paraphrase of this document with our AI Paraphraser

TABLE OF CONTENTS
INTRODUCTION...........................................................................................................................3
MAIN BODY..................................................................................................................................3
1. Arranging the humidity of Manchester city for ten consecutive days.....................................3
2. Presenting the data using different charts................................................................................3
3. Calculate as well as discussion on the following descriptive statistics...................................4
4. Calculation and discussion of following..................................................................................6
CONCLUSION................................................................................................................................8
REFERENCES................................................................................................................................9

INTRODUCTION
The data analysis is process generally for obtaining the raw data as well as converting
into useful information for decision-making by the user. In simple words the data is a practice of
working with different data to glean useful information, that can further used to make the
decision. The report will based on the data set of Manchester city humidity. Along with this the
report also compute the mean, median, mode, range as well as standard deviation. Moreover, the
report also discuss linear forecasting of data set.
MAIN BODY
1. Arranging the humidity of Manchester city for ten consecutive days
Serial No. Date Humidity (%)
1 11/09/22 72
2 12/09/22 92
3 13/09/22 67
4 14/09/22 68
5 15/09/22 53
6 16/09/22 46
7 17/09/22 51
8 18/09/22 76
9 19/09/22 73
10 20/09/22 73
2. Presenting the data using different charts
Column chart:
⊘ This is a preview!⊘
Do you want full access?
Subscribe today to unlock all pages.
Trusted by 1+ million students worldwide
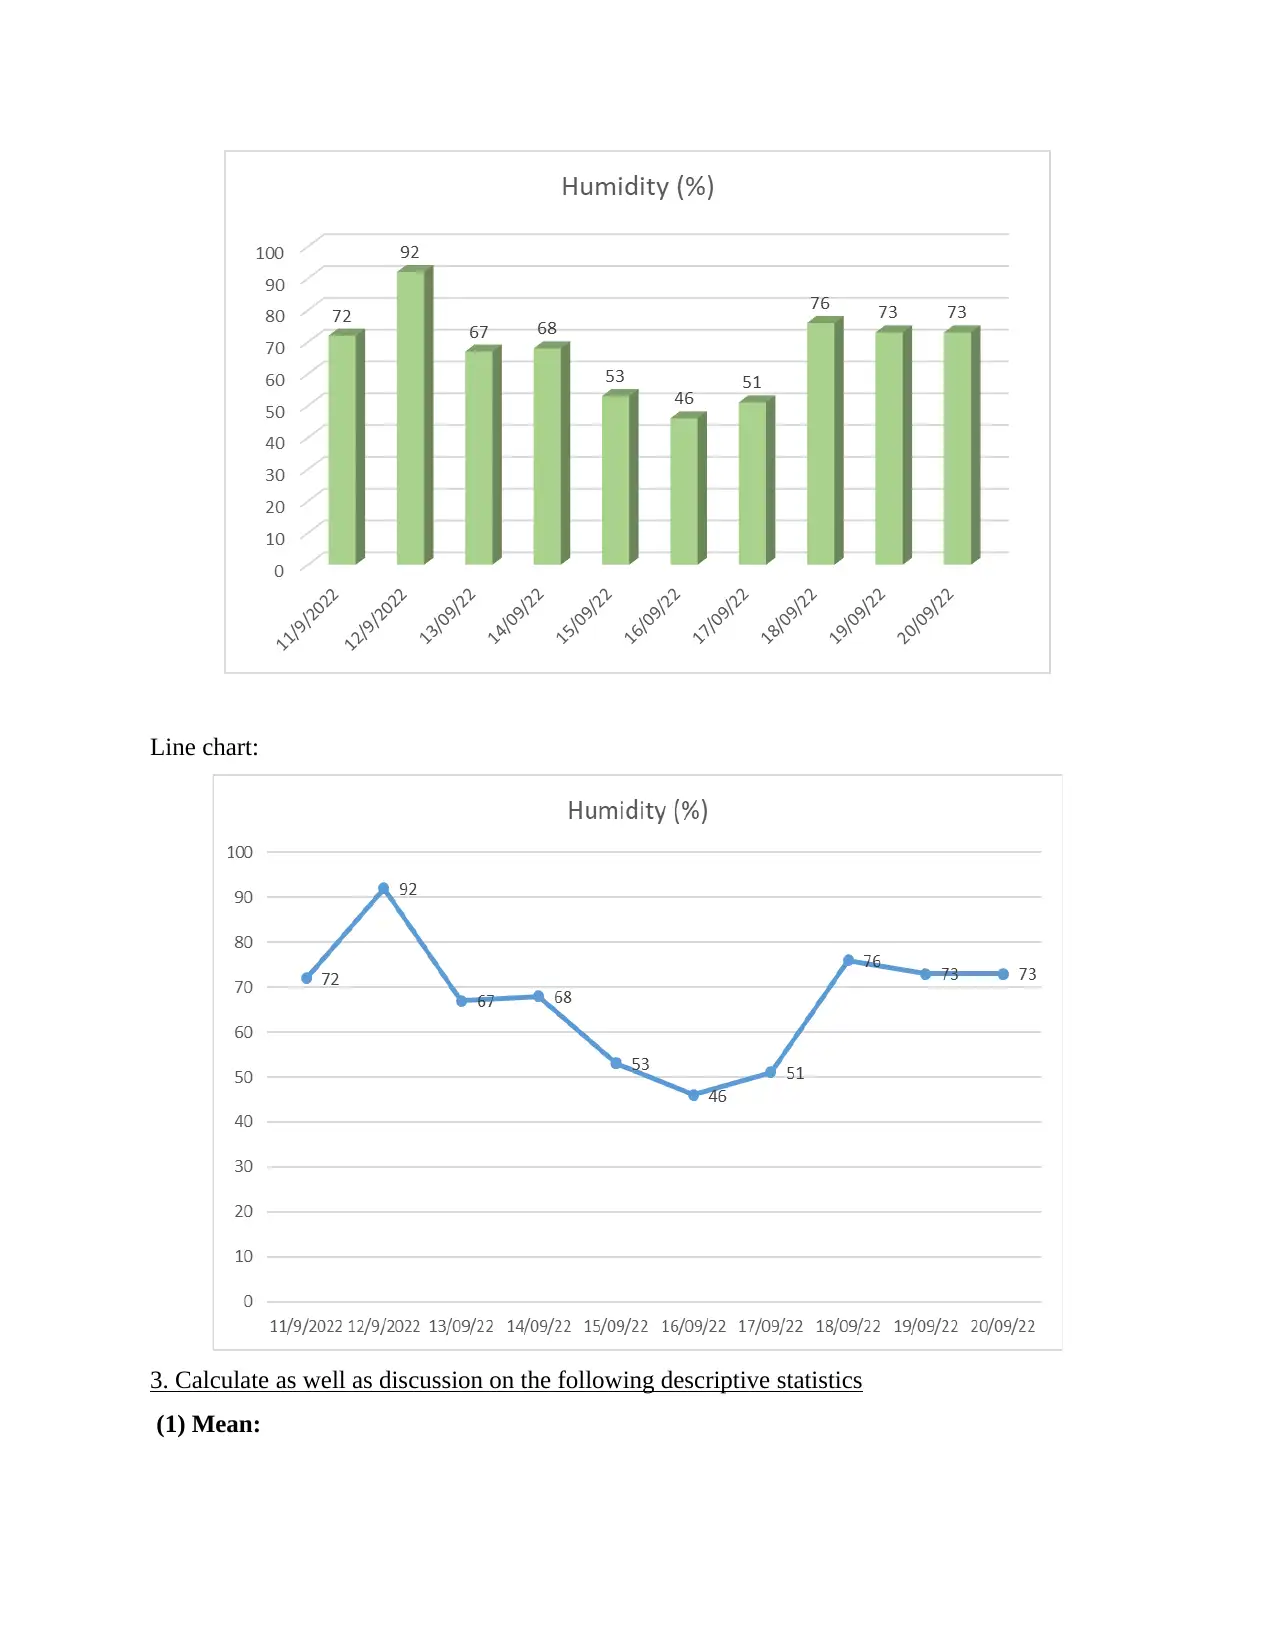
Line chart:
3. Calculate as well as discussion on the following descriptive statistics
(1) Mean:
3. Calculate as well as discussion on the following descriptive statistics
(1) Mean:
Paraphrase This Document
Need a fresh take? Get an instant paraphrase of this document with our AI Paraphraser
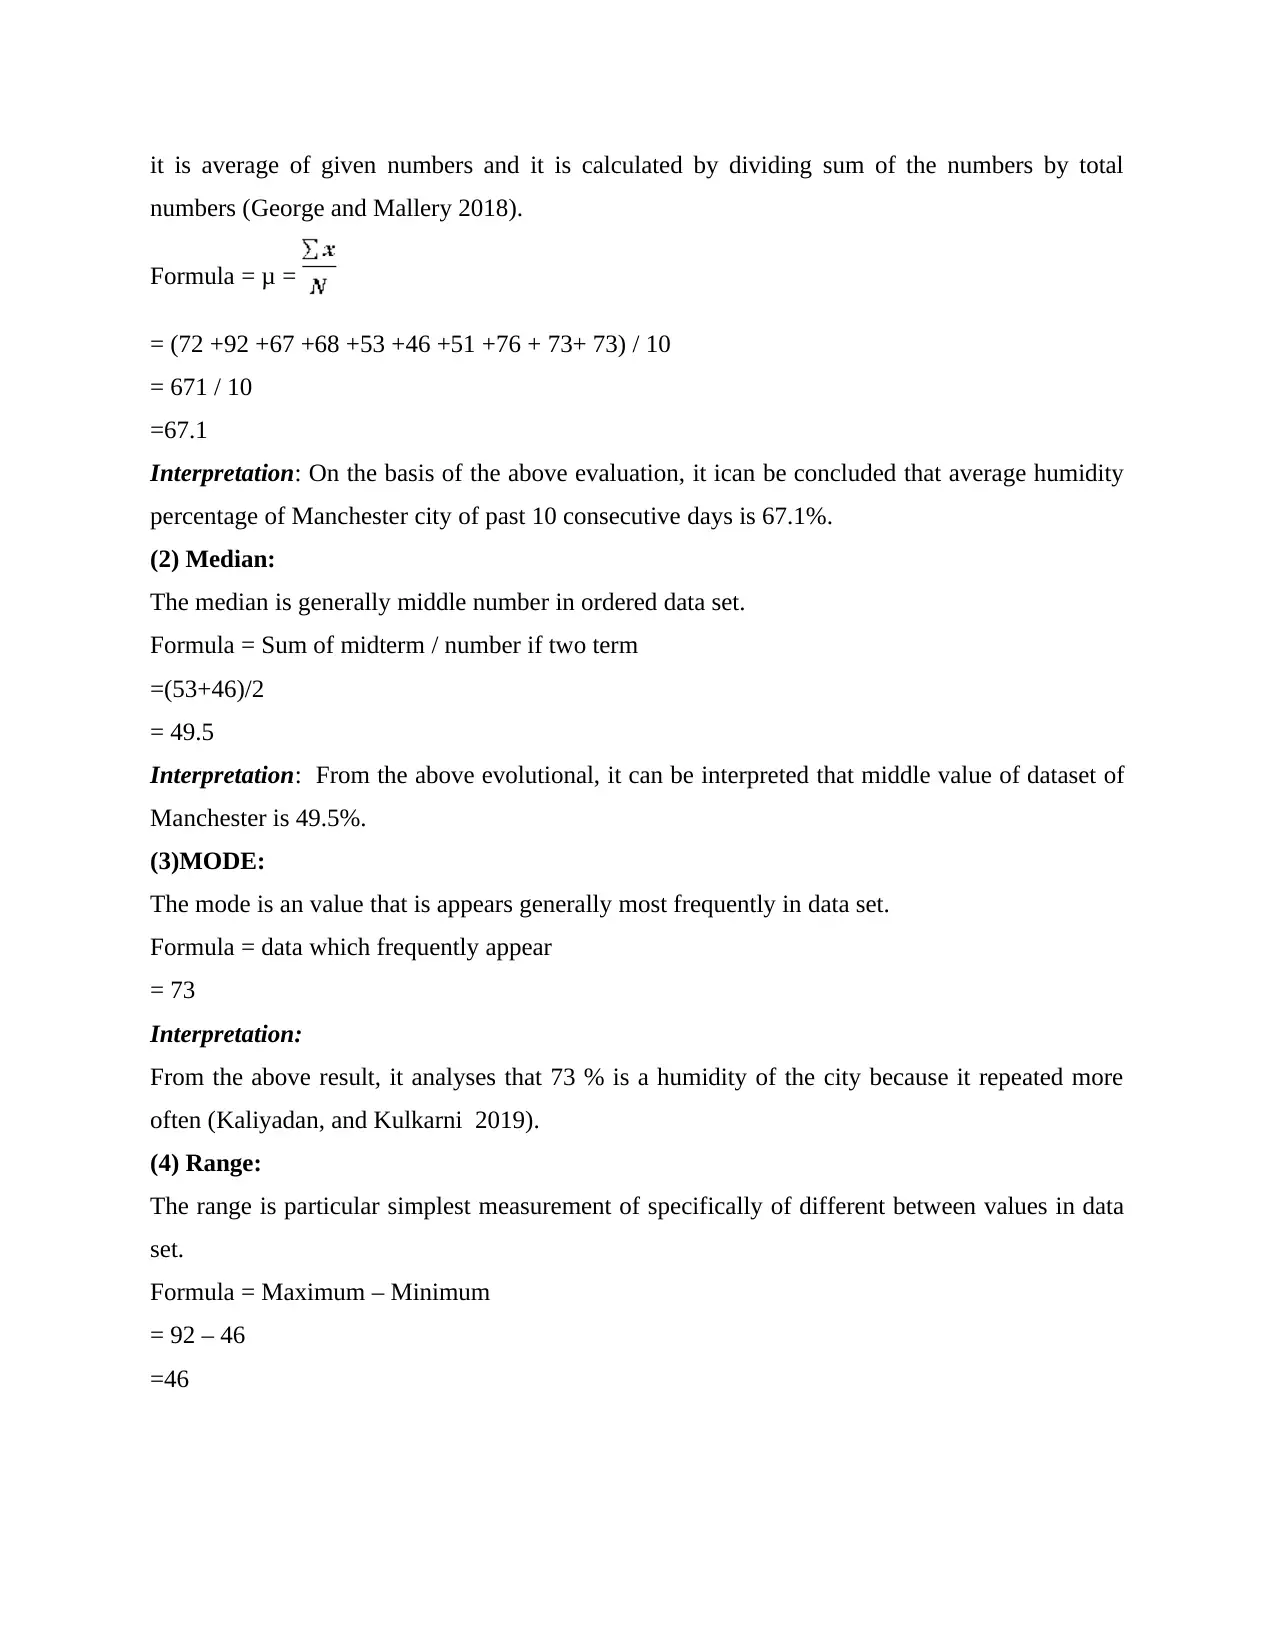
it is average of given numbers and it is calculated by dividing sum of the numbers by total
numbers (George and Mallery 2018).
Formula = μ =
= (72 +92 +67 +68 +53 +46 +51 +76 + 73+ 73) / 10
= 671 / 10
=67.1
Interpretation: On the basis of the above evaluation, it ican be concluded that average humidity
percentage of Manchester city of past 10 consecutive days is 67.1%.
(2) Median:
The median is generally middle number in ordered data set.
Formula = Sum of midterm / number if two term
=(53+46)/2
= 49.5
Interpretation: From the above evolutional, it can be interpreted that middle value of dataset of
Manchester is 49.5%.
(3)MODE:
The mode is an value that is appears generally most frequently in data set.
Formula = data which frequently appear
= 73
Interpretation:
From the above result, it analyses that 73 % is a humidity of the city because it repeated more
often (Kaliyadan, and Kulkarni 2019).
(4) Range:
The range is particular simplest measurement of specifically of different between values in data
set.
Formula = Maximum – Minimum
= 92 – 46
=46
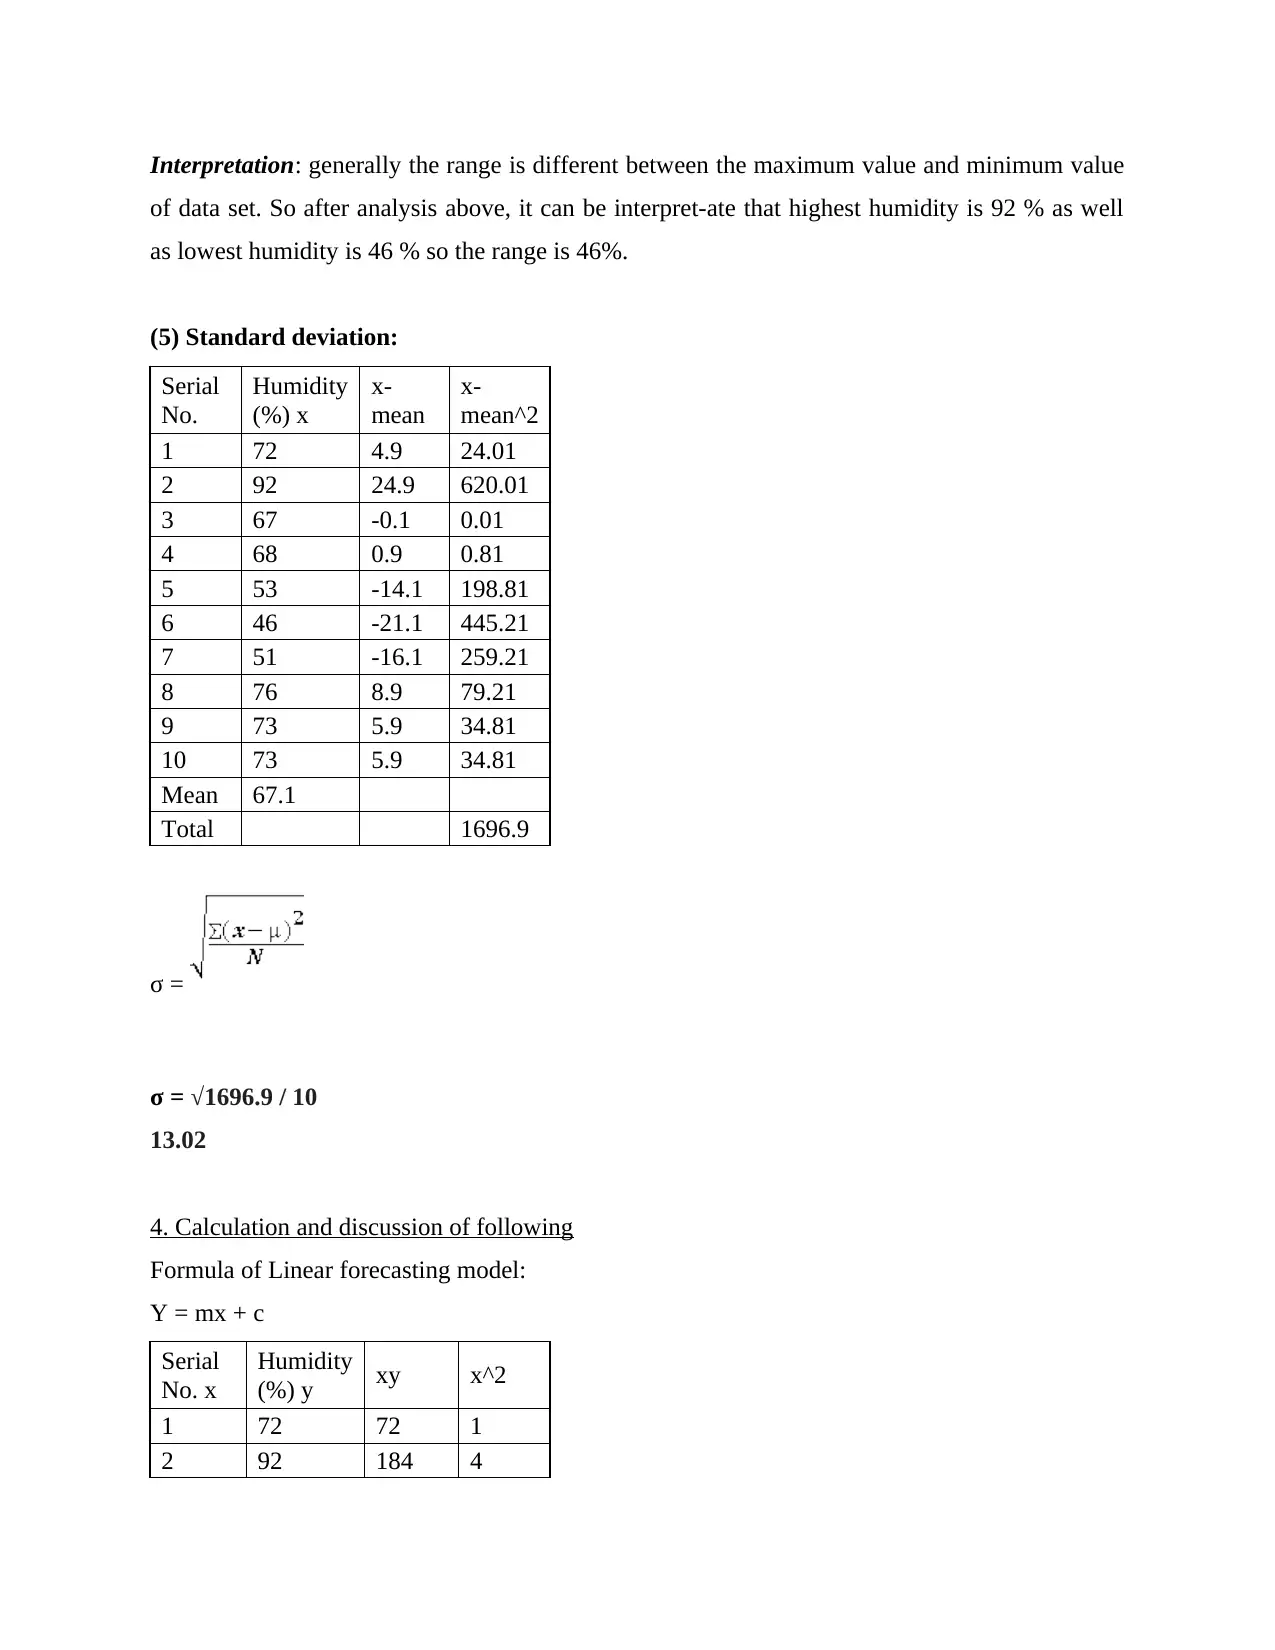
Interpretation: generally the range is different between the maximum value and minimum value
of data set. So after analysis above, it can be interpret-ate that highest humidity is 92 % as well
as lowest humidity is 46 % so the range is 46%.
(5) Standard deviation:
Serial
No.
Humidity
(%) x
x-
mean
x-
mean^2
1 72 4.9 24.01
2 92 24.9 620.01
3 67 -0.1 0.01
4 68 0.9 0.81
5 53 -14.1 198.81
6 46 -21.1 445.21
7 51 -16.1 259.21
8 76 8.9 79.21
9 73 5.9 34.81
10 73 5.9 34.81
Mean 67.1
Total 1696.9
σ =
σ = √1696.9 / 10
13.02
4. Calculation and discussion of following
Formula of Linear forecasting model:
Y = mx + c
Serial
No. x
Humidity
(%) y xy x^2
1 72 72 1
2 92 184 4
⊘ This is a preview!⊘
Do you want full access?
Subscribe today to unlock all pages.
Trusted by 1+ million students worldwide

3 67 201 9
4 68 272 16
5 53 265 25
6 46 276 36
7 51 357 49
8 76 608 64
9 73 657 81
10 73 730 100
55 671 3622 385
(1) Calculation of m value and discussion
Formula of m
=
= (10 * 3622) – (55 * 671) / (10 * 385) – (55)2
= (36220 – 36905) / 3850 – 3025
= -685 / 825
= -0.83
Discussion: In the linear forecasting model, m value is the slope and c is the intercept. On the
basis of the above result, it is identified that the slope value is -0.83 which further specify that
with the change in x value, the y value will be change by -0.83. This is one of the best way to
analyse the future value of the dataset (Vyas and et.al., 2022).
(2) Calculation of c value and discussion
Formula of c
=
= 671 – (-0.83 * 55) / 10
= 671 – -45.65 / 10
= 71.62
Paraphrase This Document
Need a fresh take? Get an instant paraphrase of this document with our AI Paraphraser

Discussion: On the basis of the above result, it is identified that the intercept value that is c value
is 71.62. The intercept is often considering as a constant when the x value is 0. It means to
forecast the future value, the slope value is need to multiple to future x value and then added to
the intercept or constant value (Gregory and et.al., 2019. Regression is one of the best way with
the help of which the users such as company can predict its future customer demand, sales, profit
etc. In this way, forecasting became easy and quick using the linear forecasting model.
(3) Calculation of 11th and 12th day of humidity data
Using the linear forecasting formula, the calculation of 11th and 12th day of Manchester city
humidity are as follows:
Day 11
Y = (-0.83 * 11) + 71.62
= 62.49 or 62%
Day 12
Y = (-0.83 * 12) + 71.62
= 61.66 or 62%
Interpretation: With the help of linear forecasting model, it is identified that the humidity of 11th
day that is 21st September, 2022 is 62%. On the same side, it is also analysed from the above
calculation is that the humidity of 12th day that is 22nd September, 2022 is also 62% (von
Spreckelsen and et.al., 2019).
CONCLUSION
From the above report it also concluded that analysis data become quick and easy with
the effective use of tools. The report generally present data of the Manchester city that is related
to humidity. The above report take the data of city humidity from 11 September 2022 to 20
September 2022. the above report also includes two types of chart for presenting the data.
Moreover, the report also discuss mean, median, range, mode and standard deviation with

interpretation. Lastly the report also discuss the linear forecasting model that is by forecast
humidity for the 11th and 12th day.
humidity for the 11th and 12th day.
⊘ This is a preview!⊘
Do you want full access?
Subscribe today to unlock all pages.
Trusted by 1+ million students worldwide
REFERENCES
Books and Journals
George, D. and Mallery, P., 2018. Descriptive statistics. In IBM SPSS Statistics 25 Step by
Step (pp. 126-134). Routledge.
Gregory, L. and et.al., 2019. The influence of mathematics self‐efficacy on numeracy
performance in first‐year nursing students: A quasi‐experimental study. Journal of
Clinical Nursing, 28(19-20), pp.3651-3659.
Kaliyadan, F. and Kulkarni, V., 2019. Types of variables, descriptive statistics, and sample
von Spreckelsen, M. and et.al., 2019. Let's talk about maths: The role of observed “maths‐talk”
and maths provisions in preschoolers' numeracy. Mind, Brain, and Education, 13(4),
pp.326-340.
Vyas, P. and et.al., 2022. Methodology for Co-designing Learning Patterns in Students with
Intellectual Disability for Learning and Assessment of Numeracy and Communication
Skills. In International Conference on Human-Computer Interaction (pp. 427-441).
Springer, Cham.
size. Indian dermatology online journal. 10(1). p.82.
1 out of 10

Your All-in-One AI-Powered Toolkit for Academic Success.
+13062052269
info@desklib.com
Available 24*7 on WhatsApp / Email
![[object Object]](/_next/static/media/star-bottom.7253800d.svg)
Unlock your academic potential
© 2024 | Zucol Services PVT LTD | All rights reserved.