Data Analysis & Forecasting: A Sleeping Hours Statistical Report
VerifiedAdded on 2023/06/18
|12
|1571
|479
Report
AI Summary
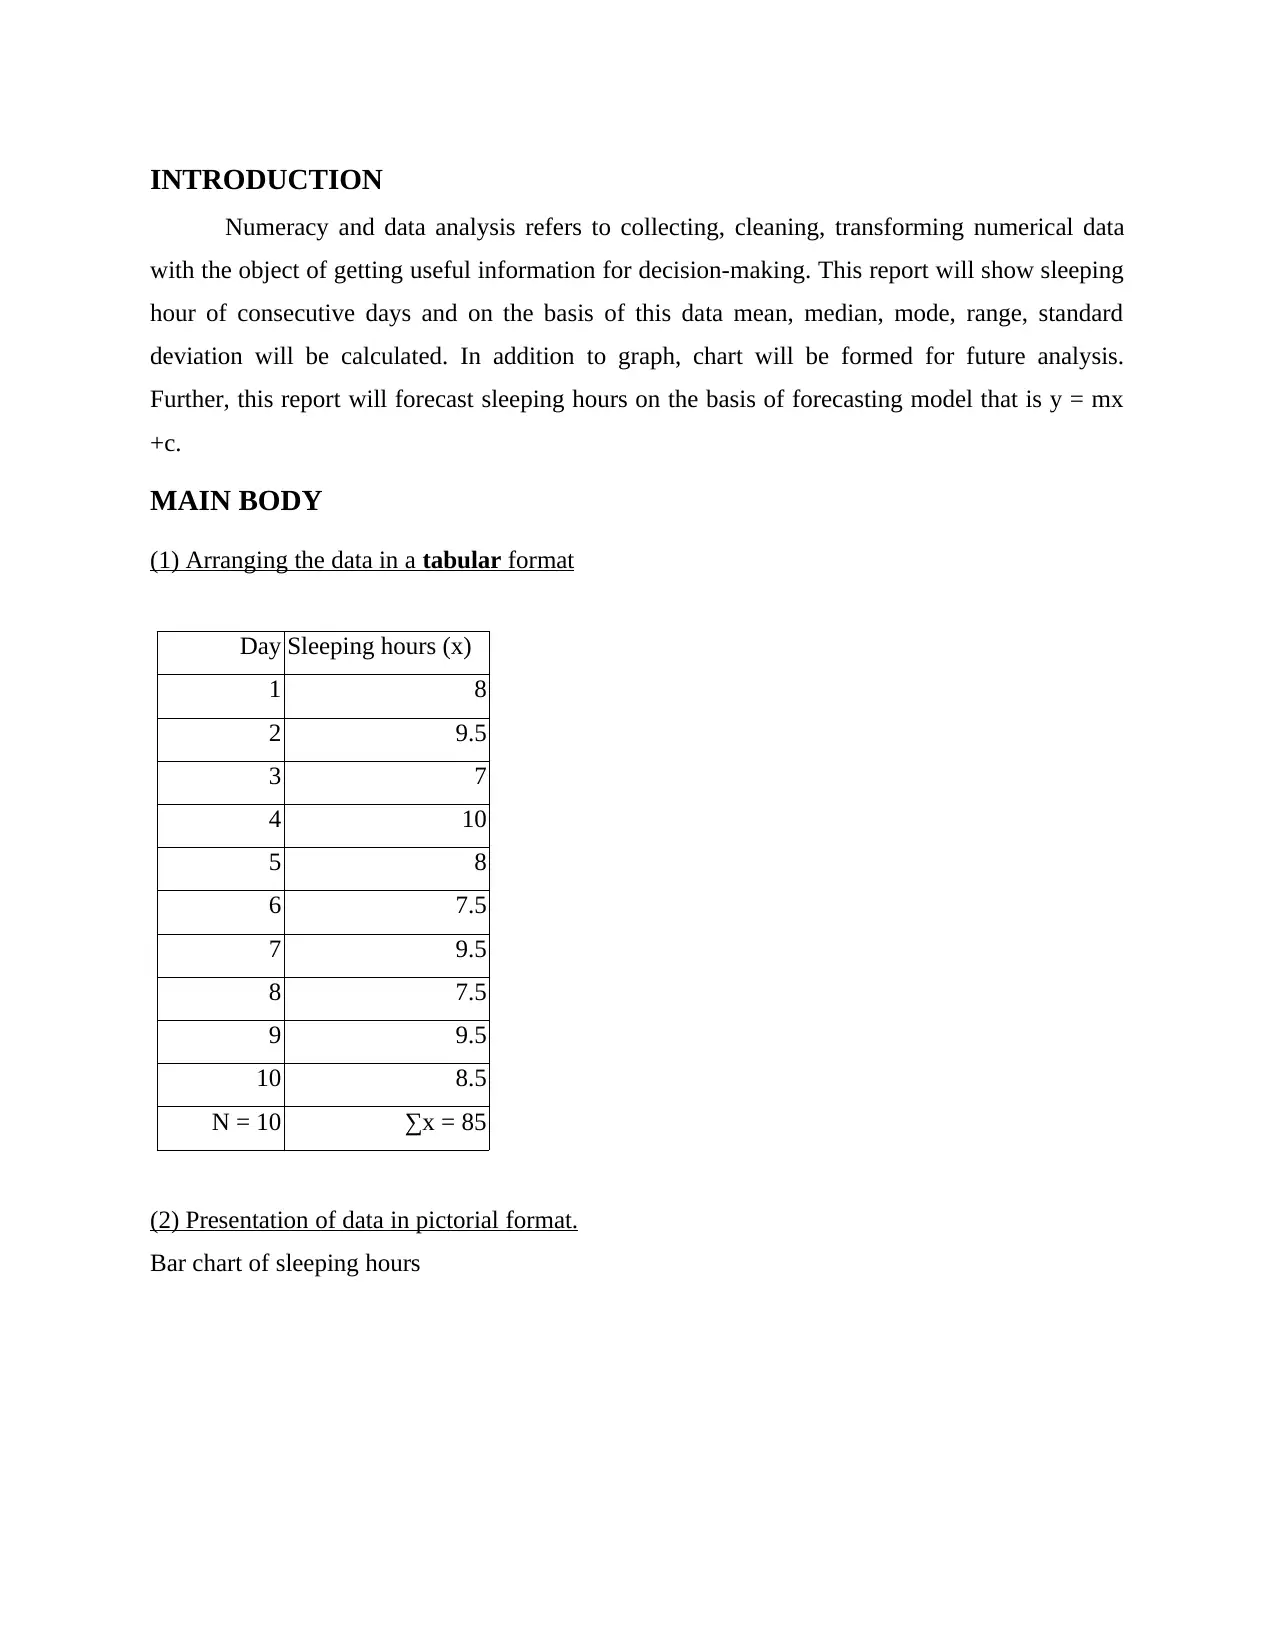
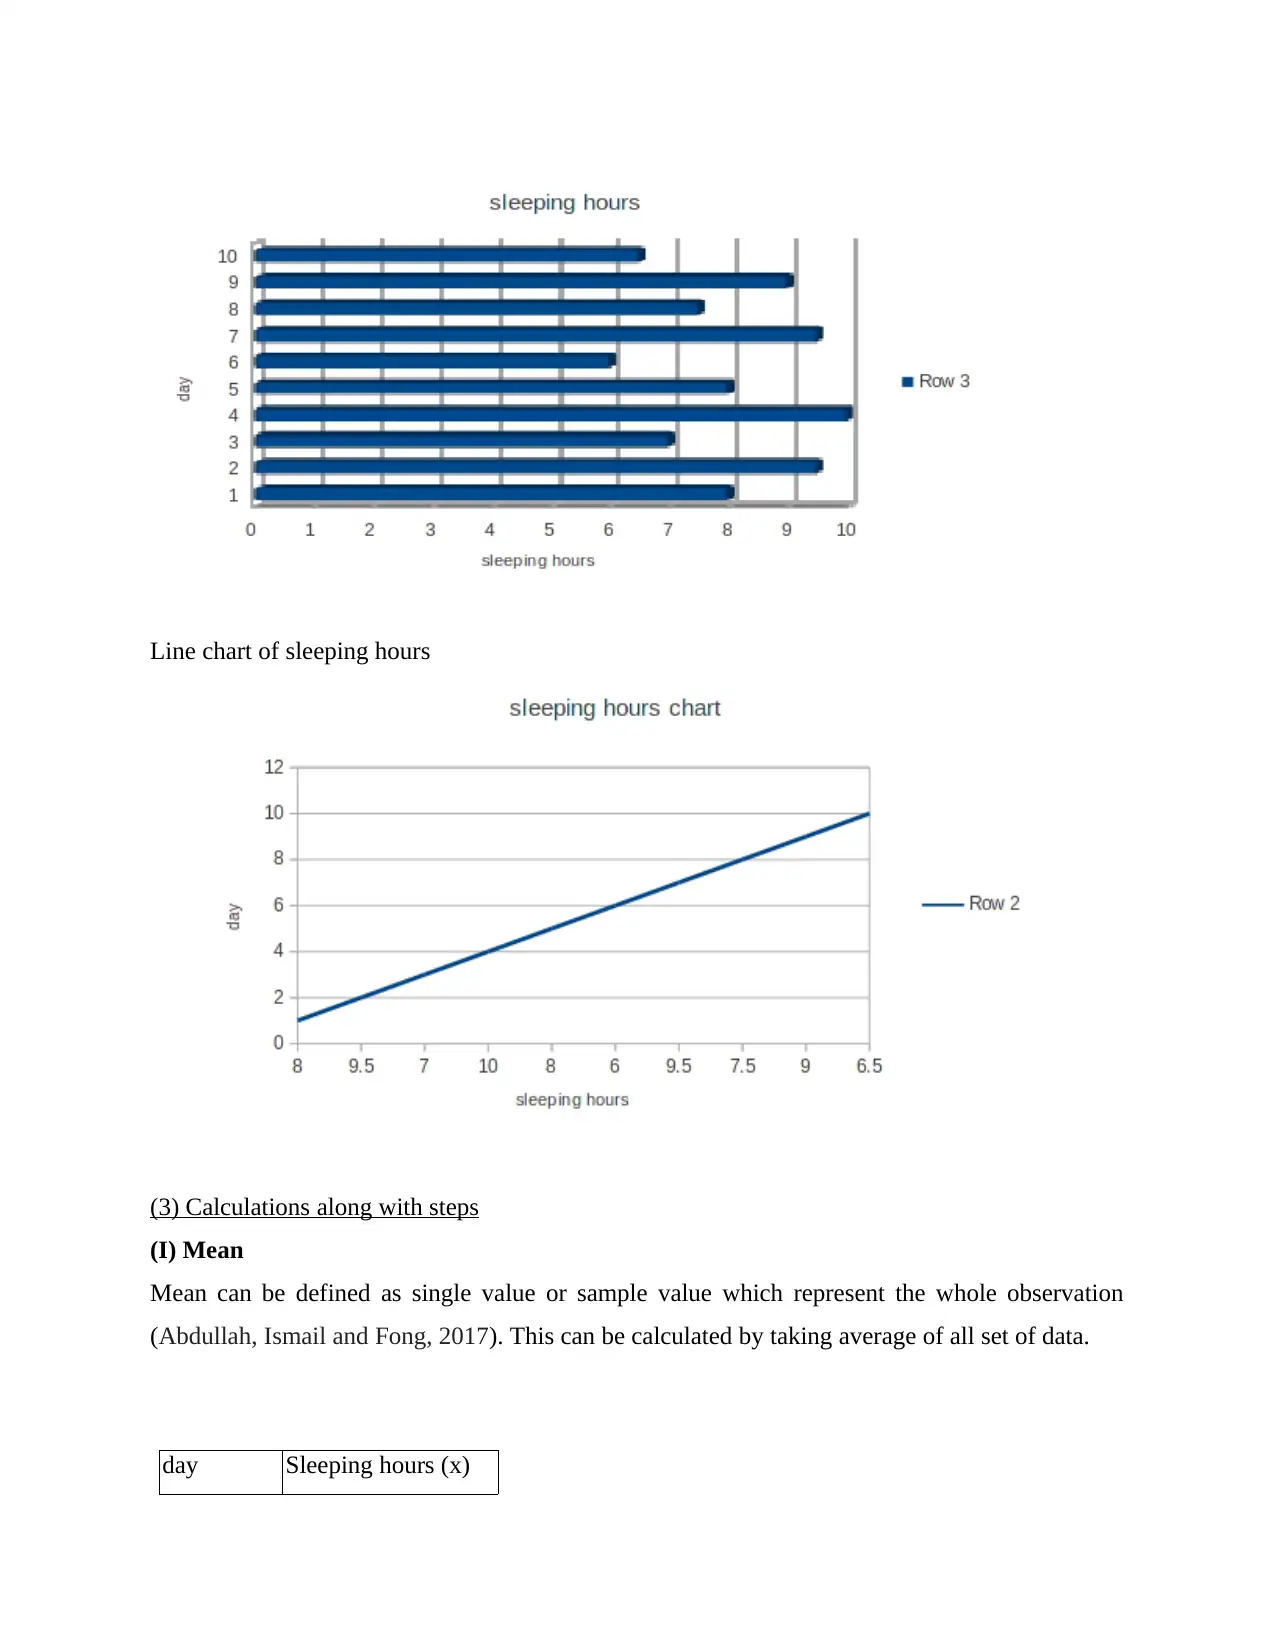
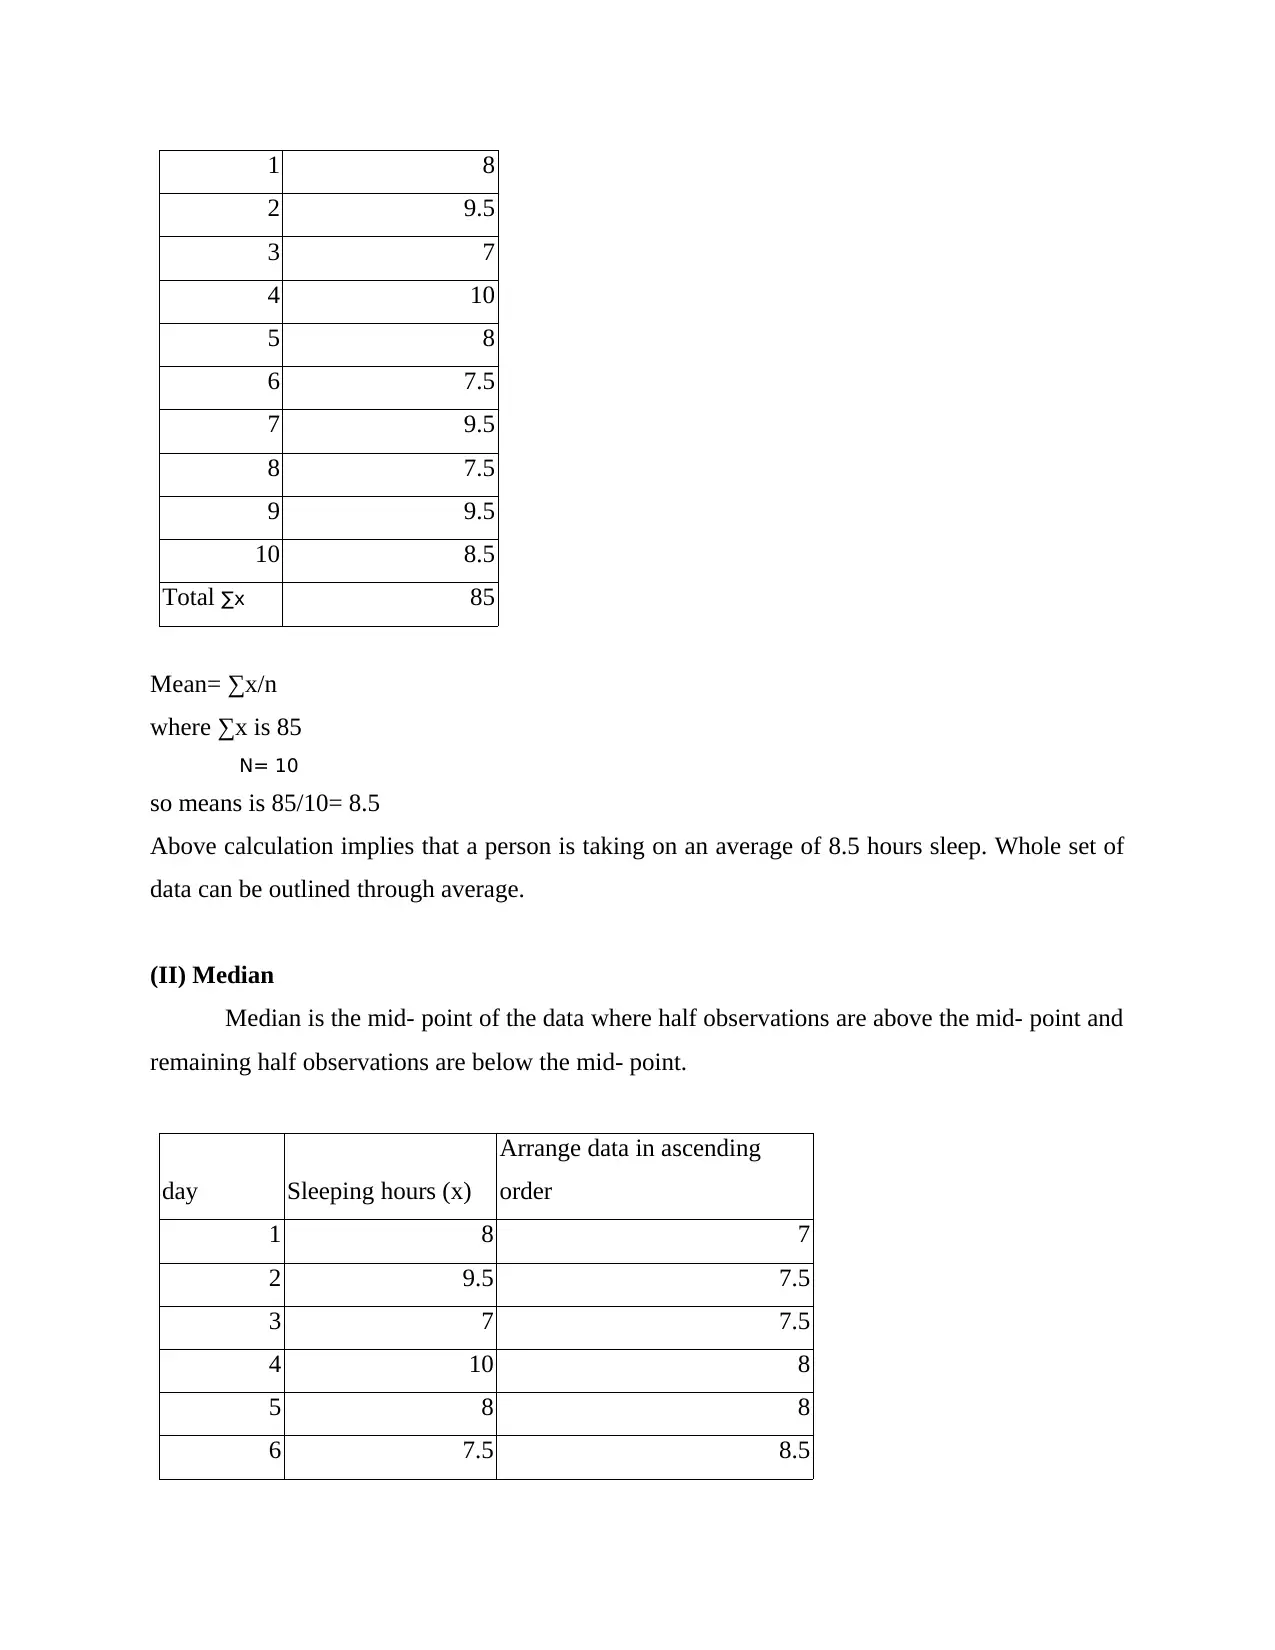
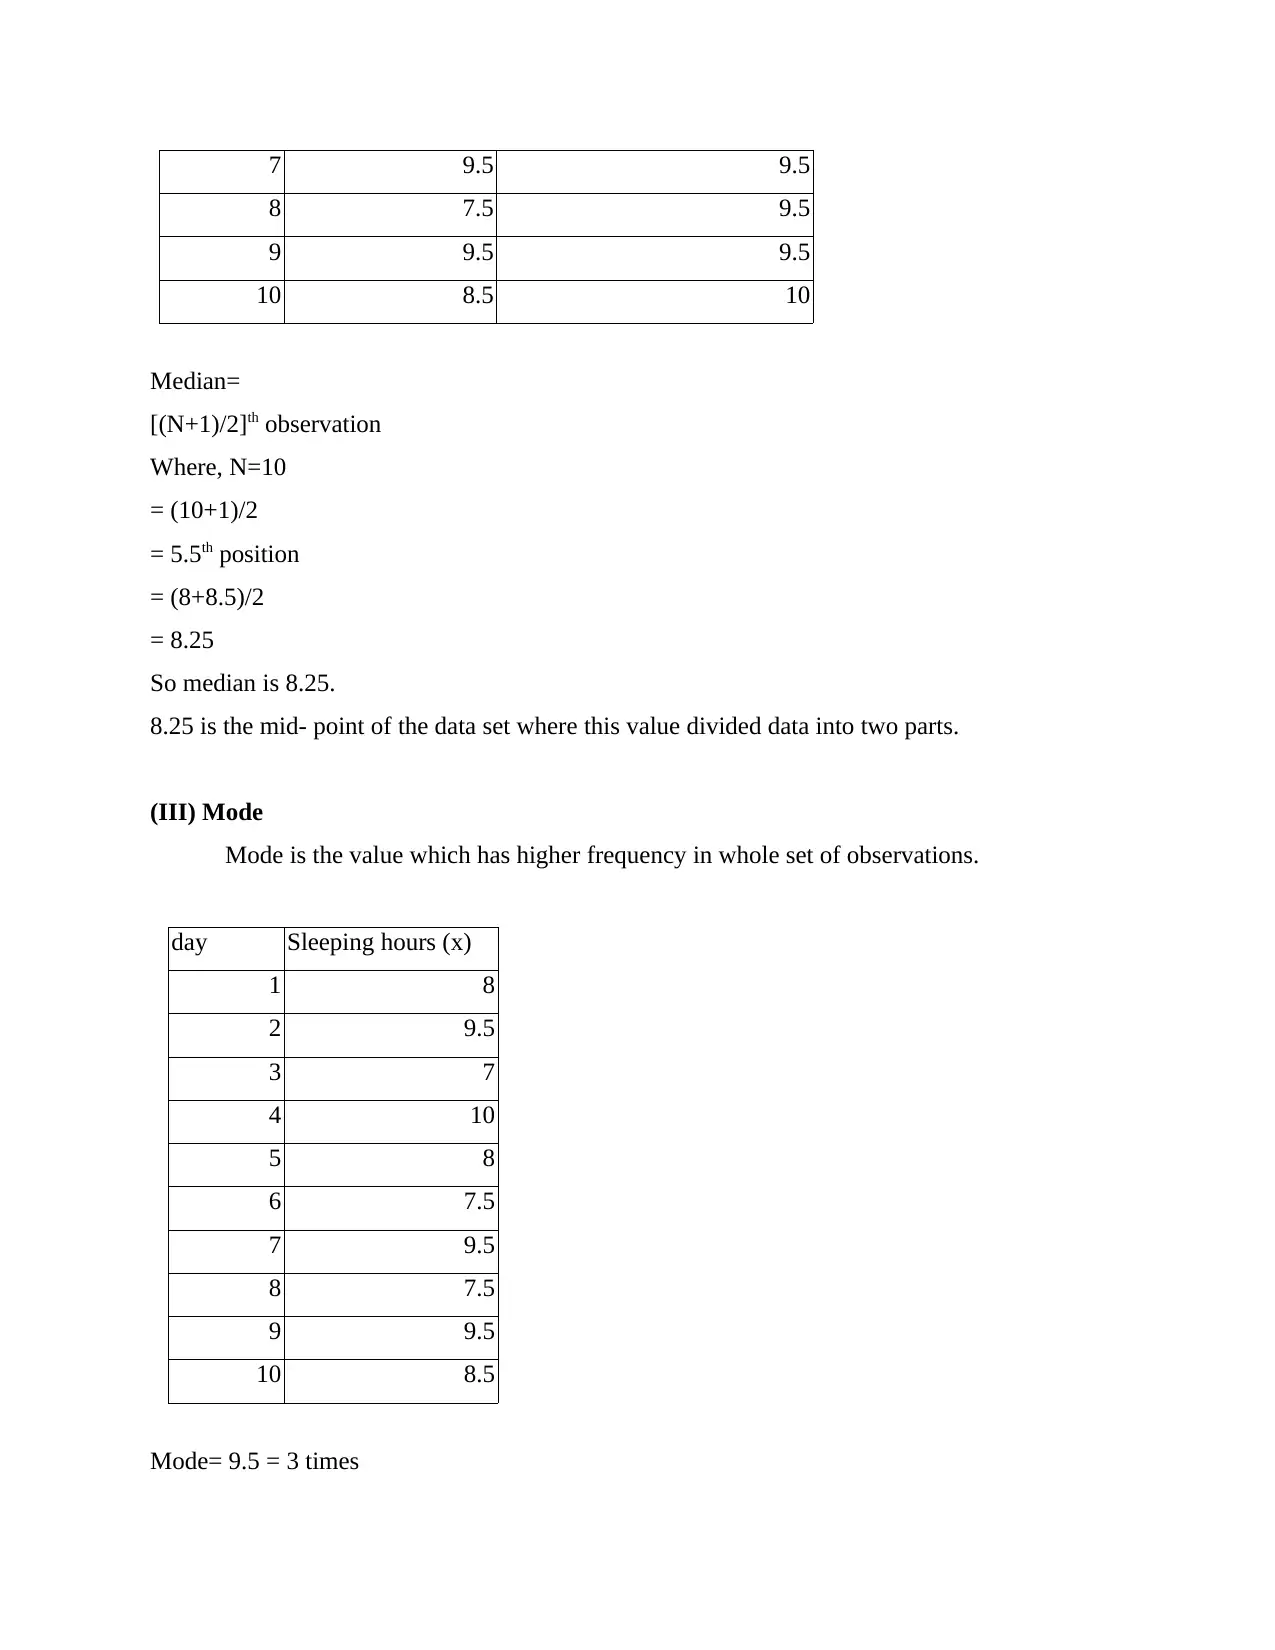
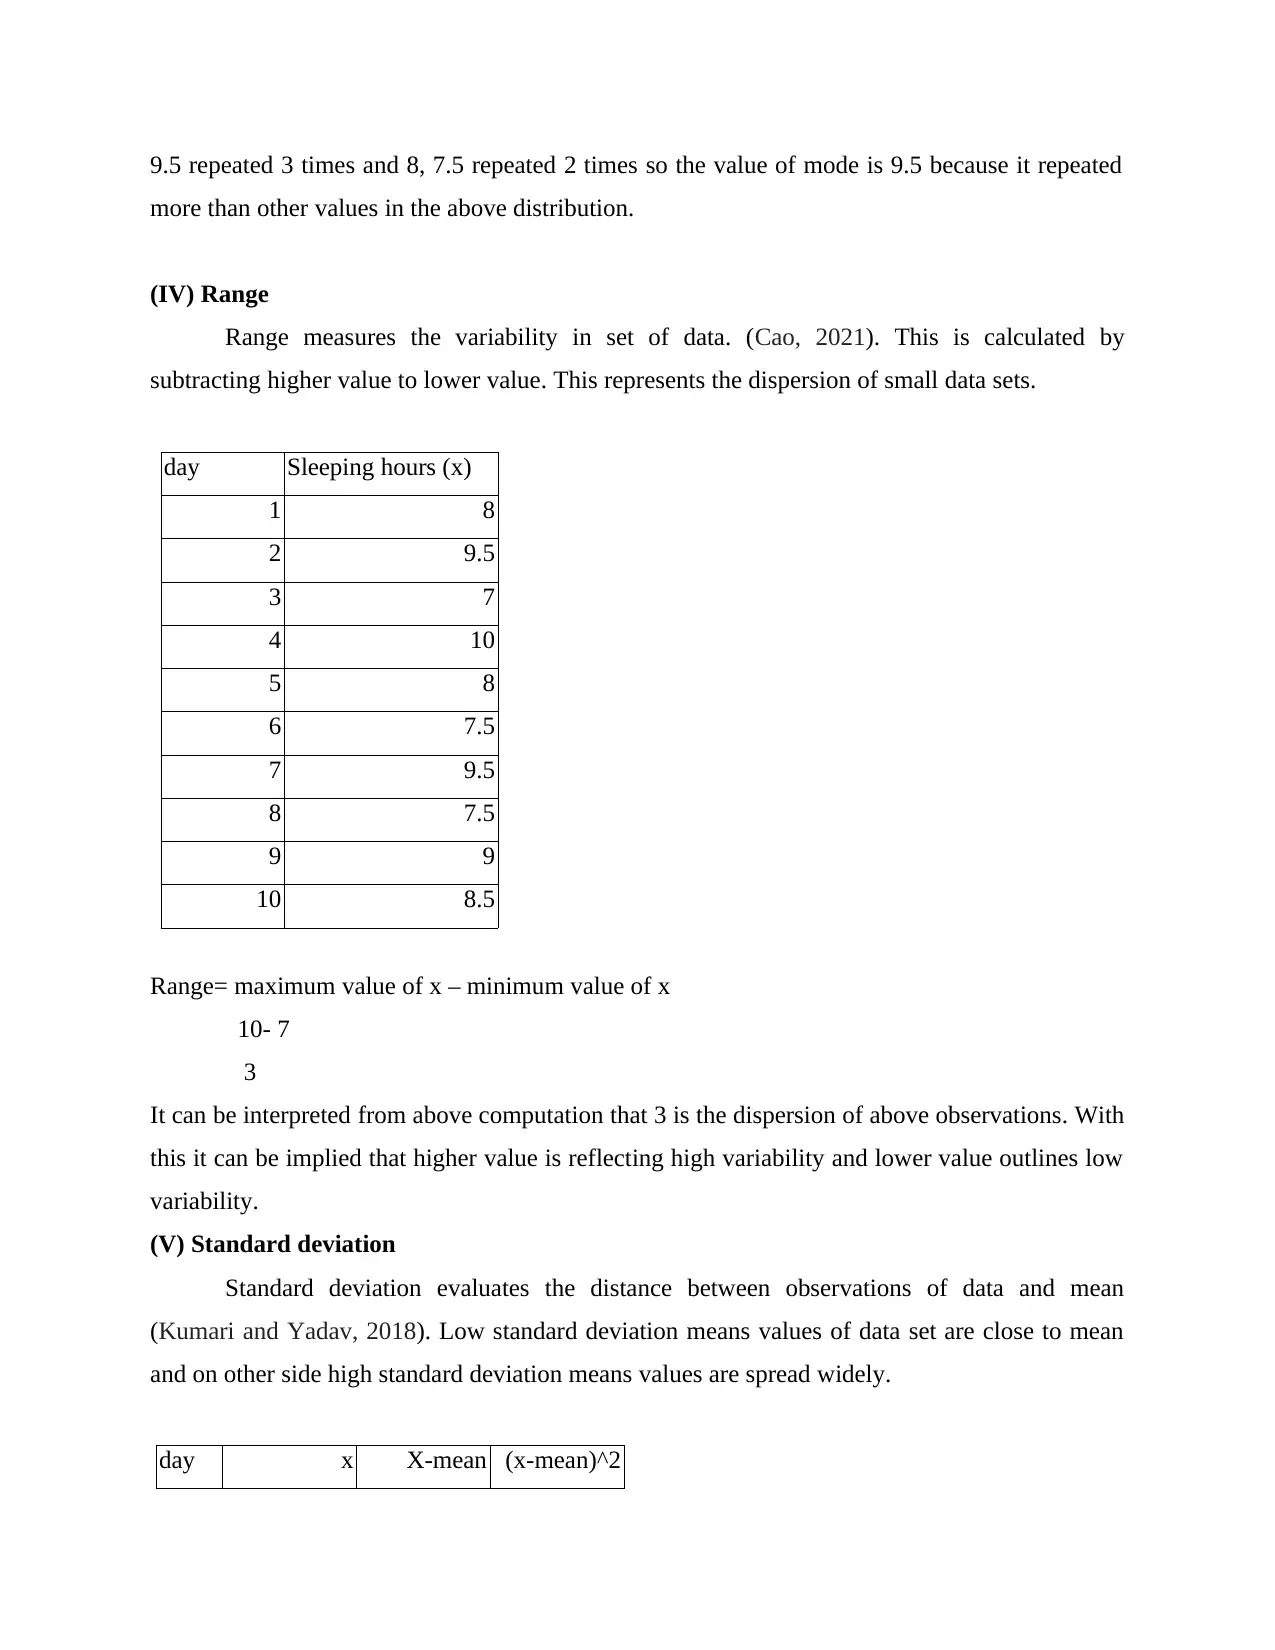
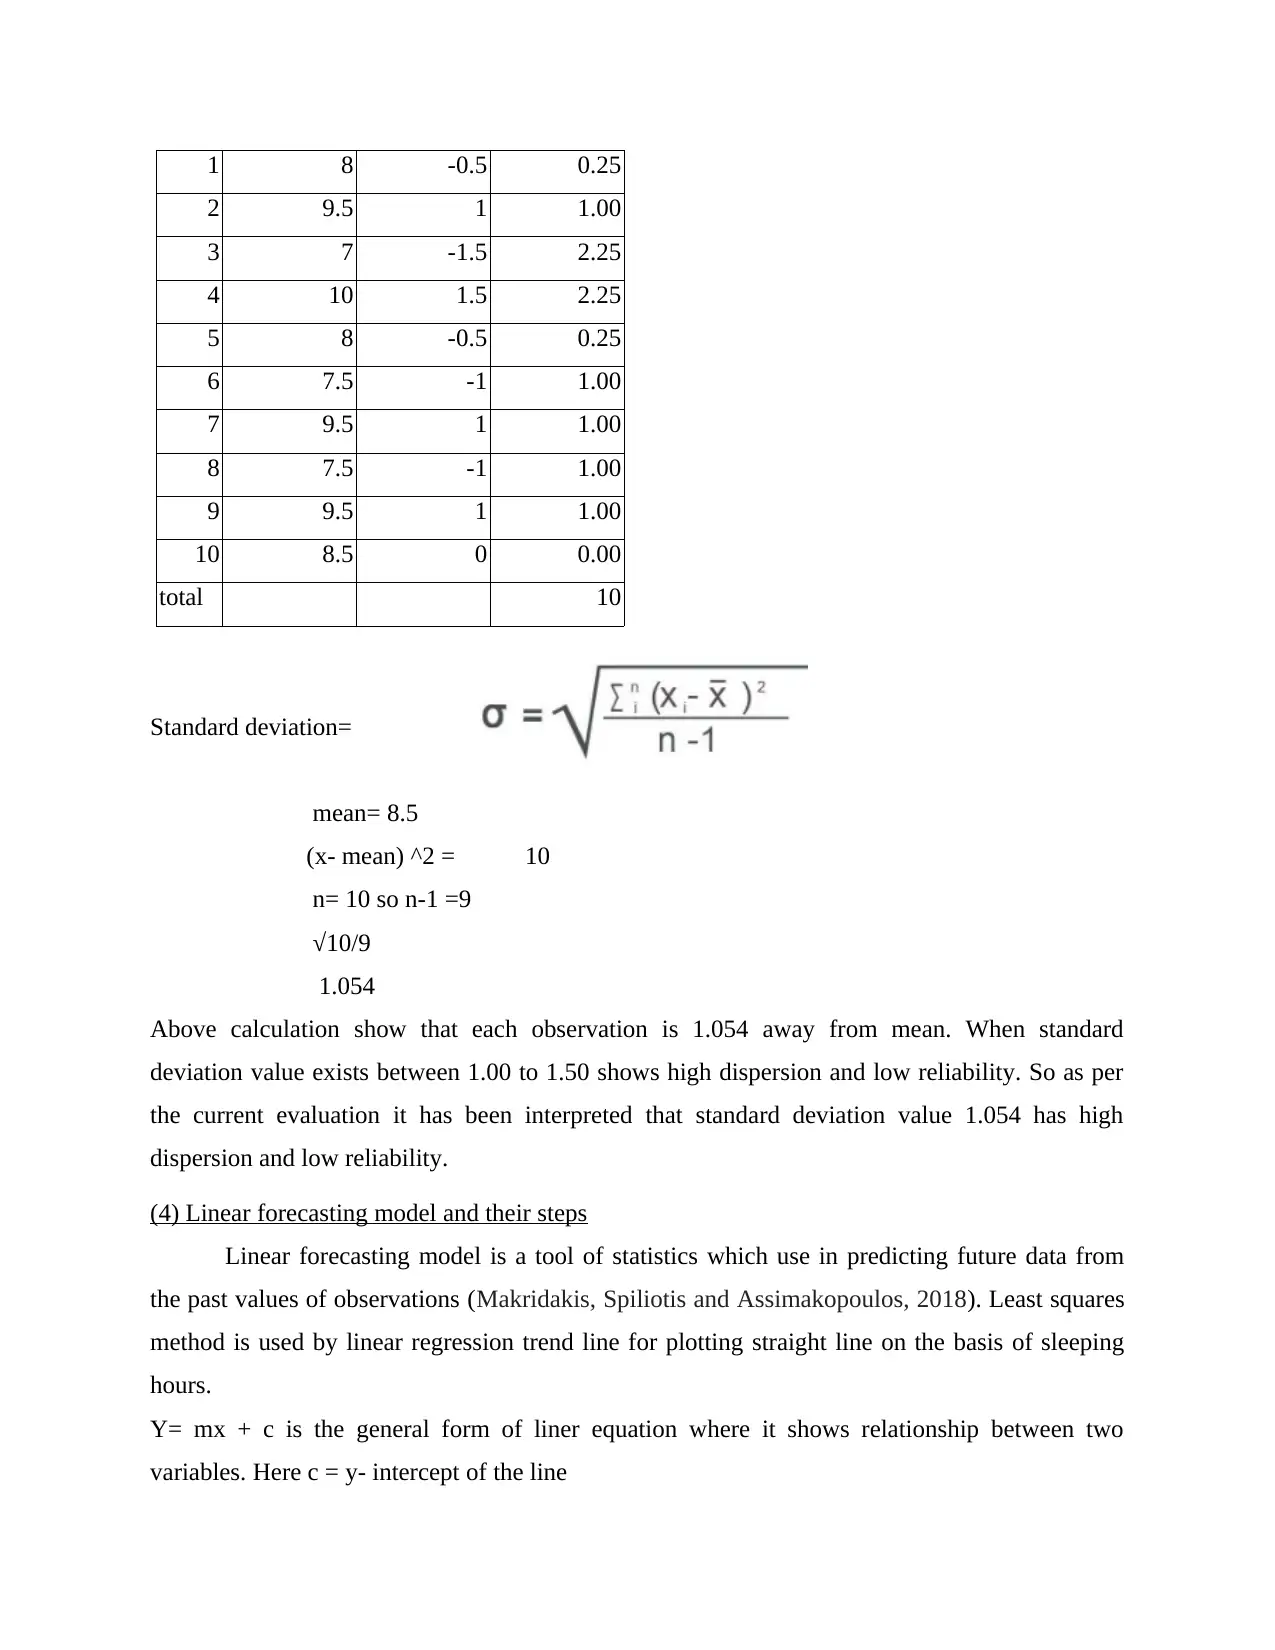
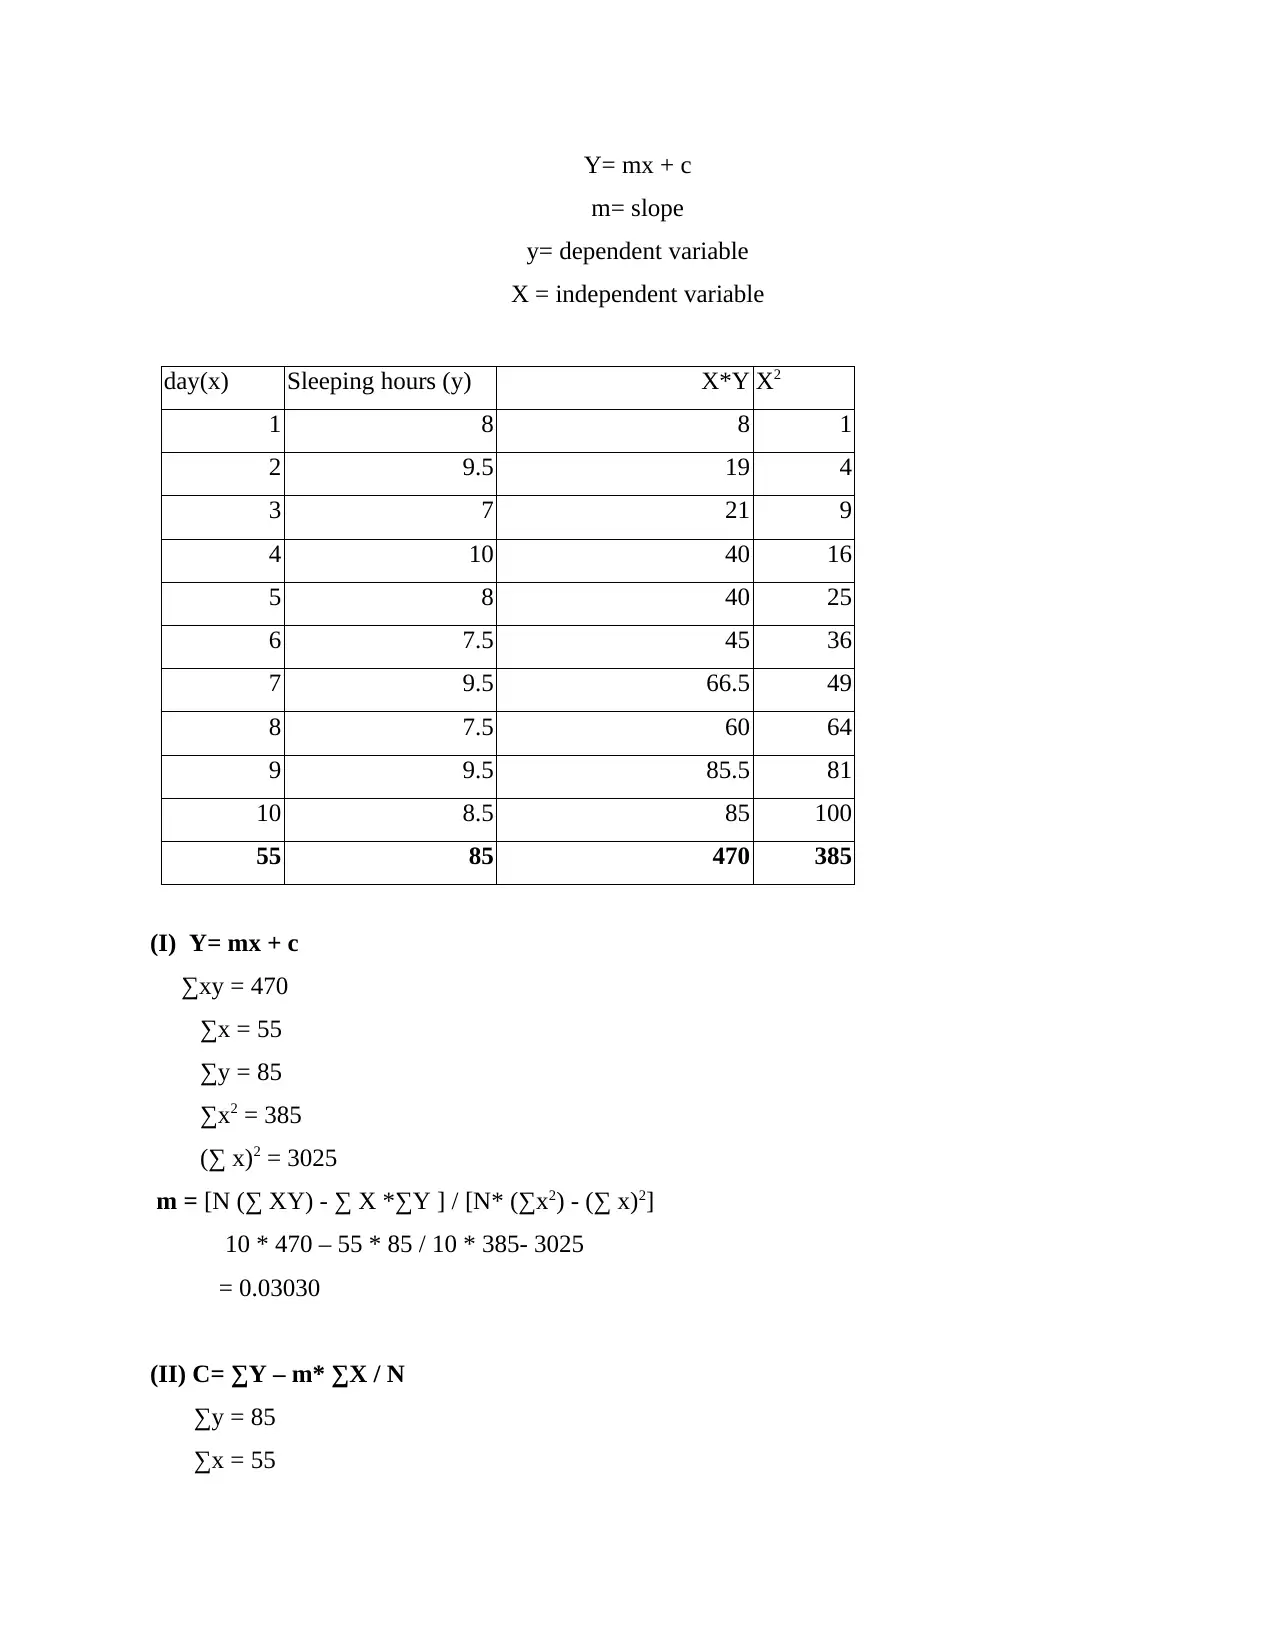
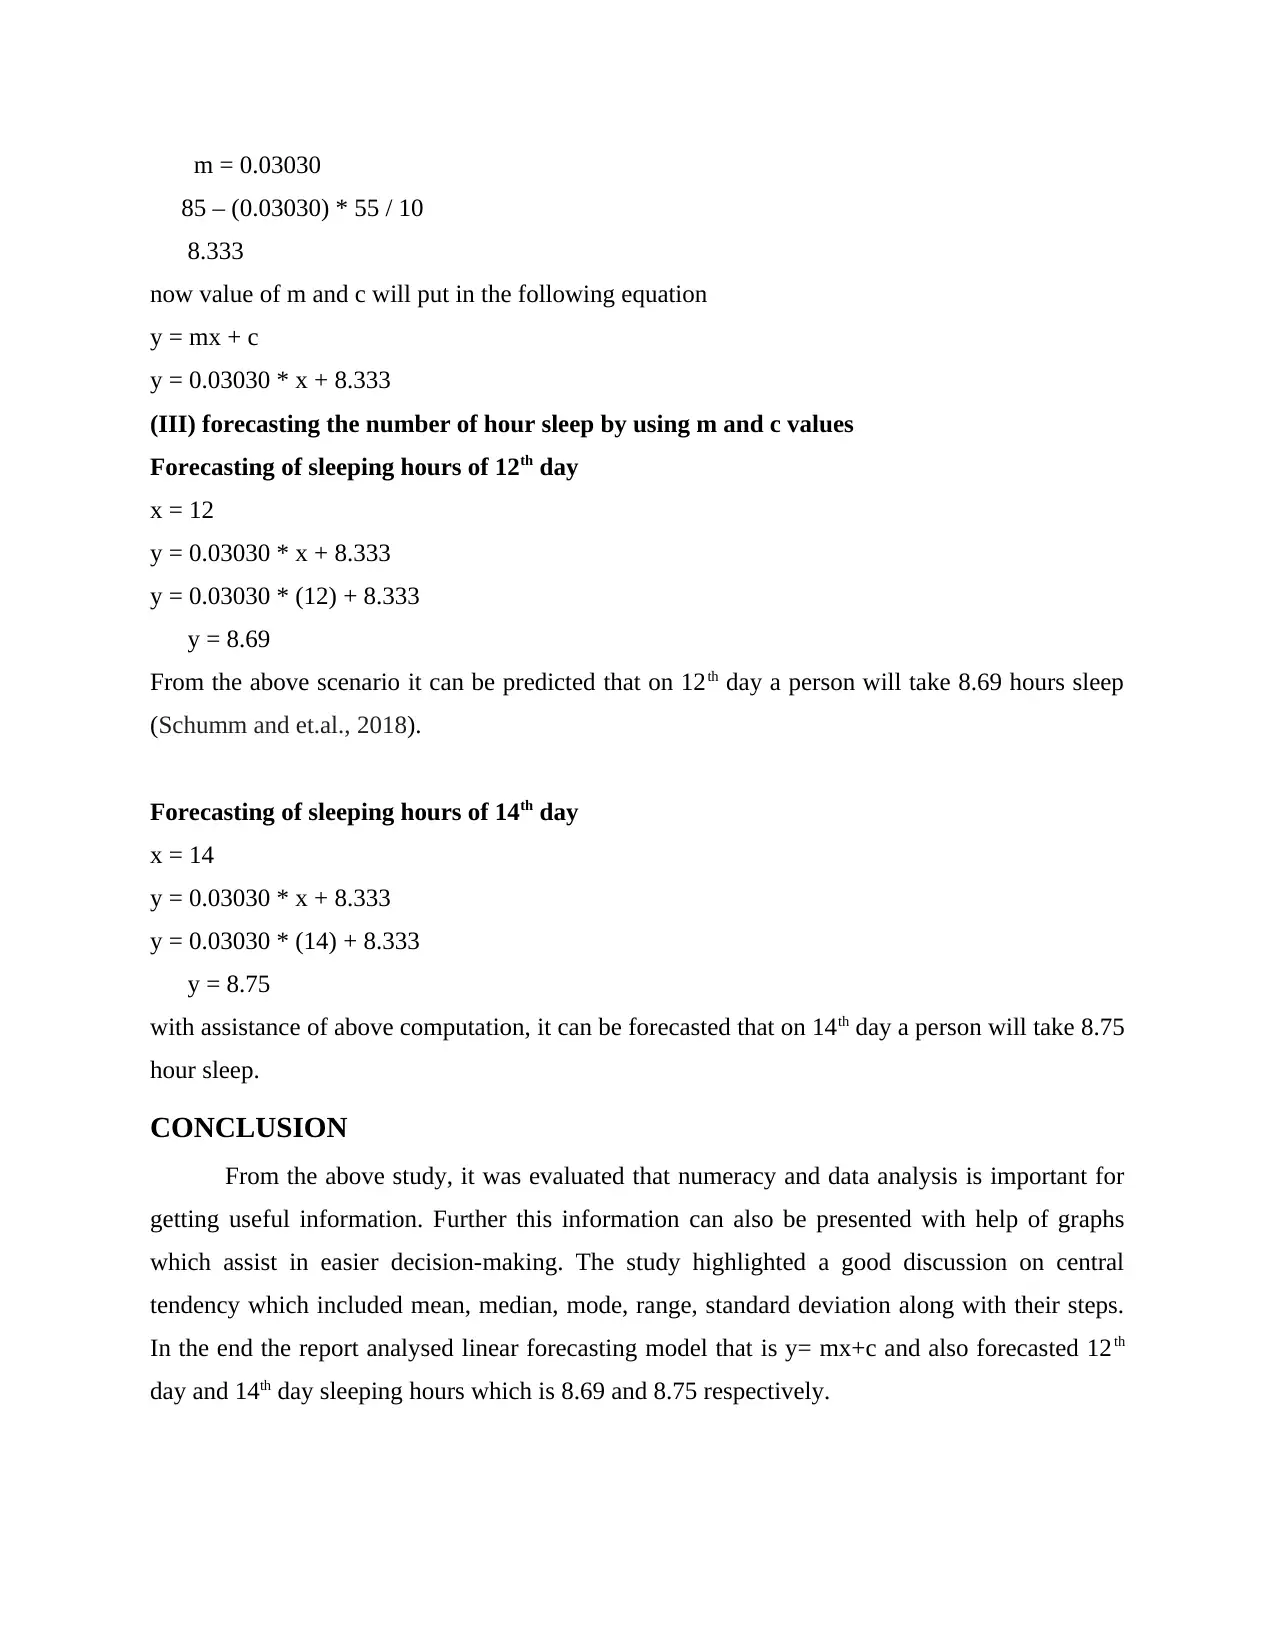
This report provides a comprehensive analysis of sleeping hours using numeracy and data analysis techniques. It includes arranging the data in a tabular format, presenting it in pictorial formats like bar and line charts, and performing calculations to determine the mean (8.5 hours), median (8.25), mode (9.5), range (3), and standard deviation (1.054) of the sleeping hours. The report also employs a linear forecasting model (y = mx + c) to predict future sleeping hours, forecasting 8.69 hours of sleep on the 12th day and 8.75 hours on the 14th day. The analysis highlights the importance of data analysis in gaining useful information for decision-making and presents the information with the help of graphs to assist in easier decision-making.

1 out of 12
Related Documents


Your All-in-One AI-Powered Toolkit for Academic Success.
+13062052269
info@desklib.com
Available 24*7 on WhatsApp / Email
![[object Object]](/_next/static/media/star-bottom.7253800d.svg)
Copyright © 2020–2026 A2Z Services. All Rights Reserved. Developed and managed by ZUCOL.