Numeracy and Data Analysis Report: London Wind Speed
VerifiedAdded on 2021/02/20
|8
|1460
|289
Report
AI Summary
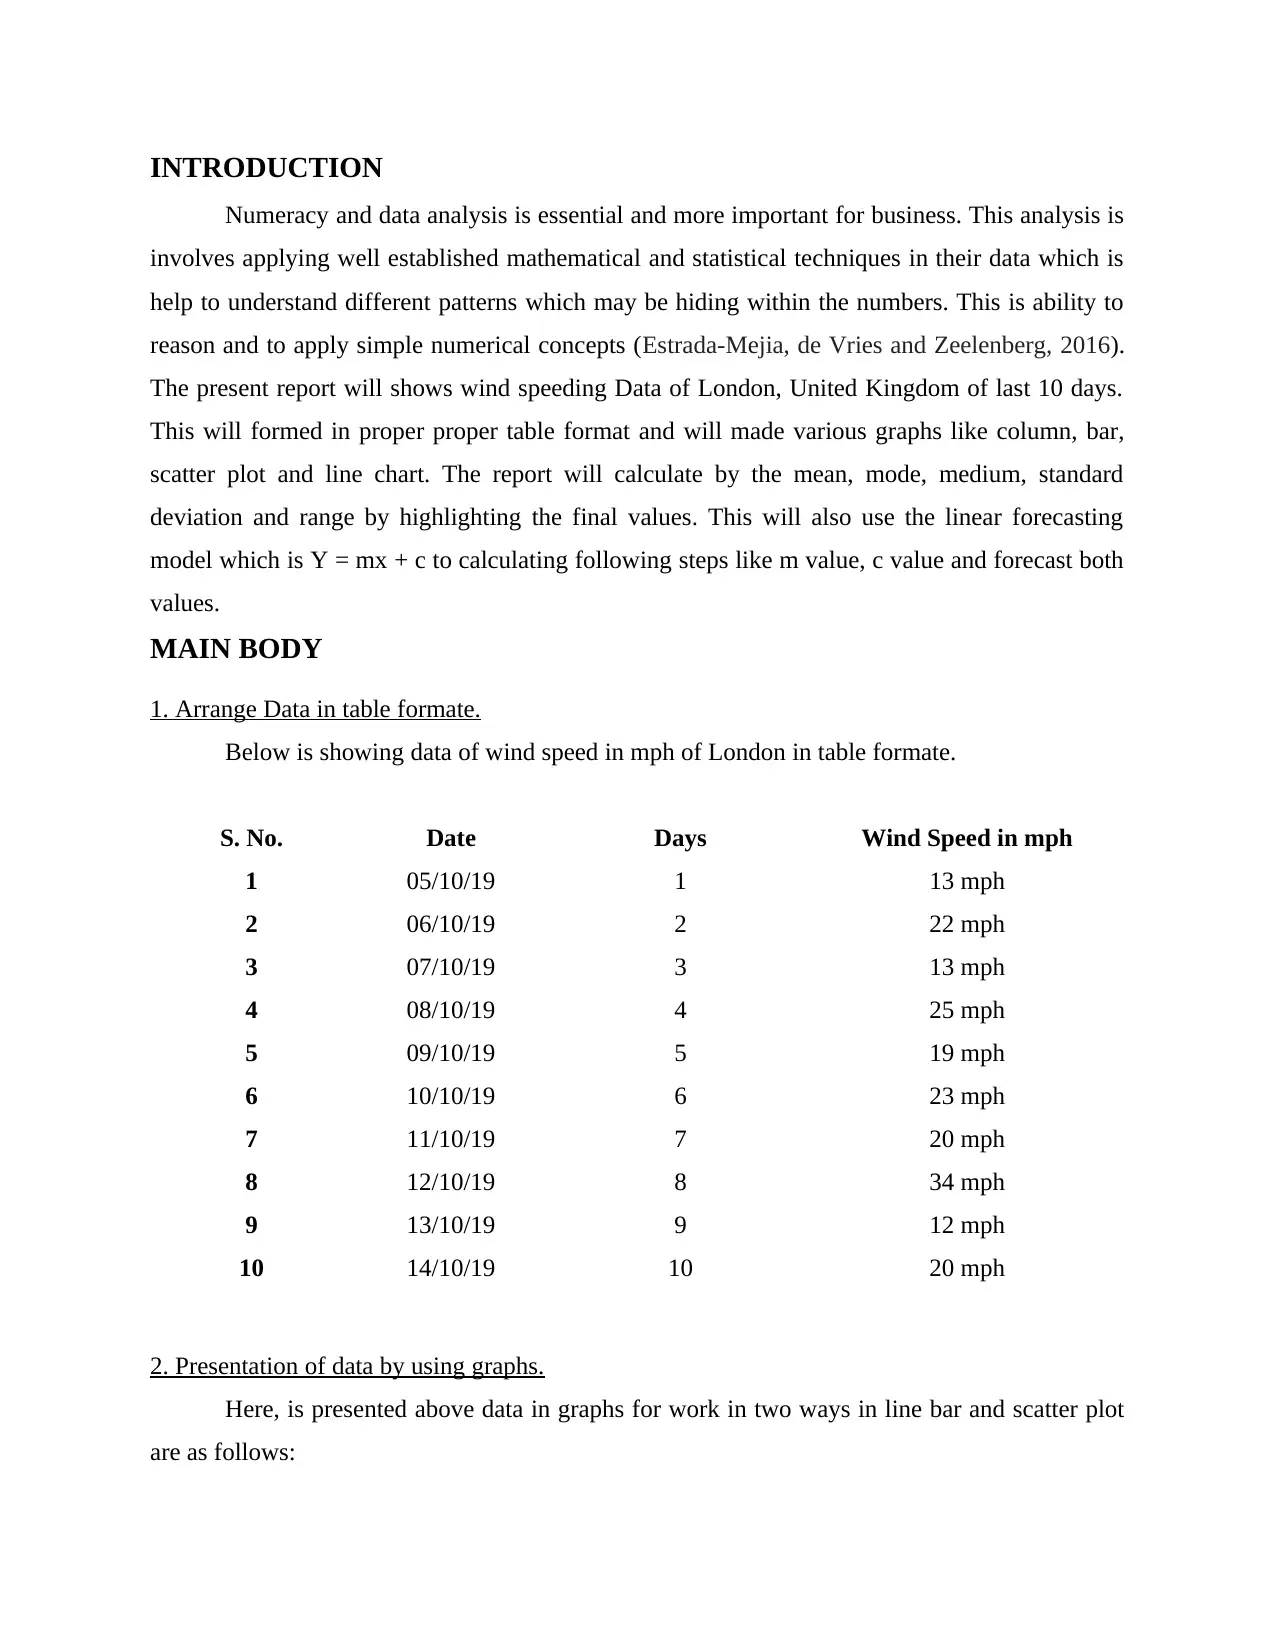
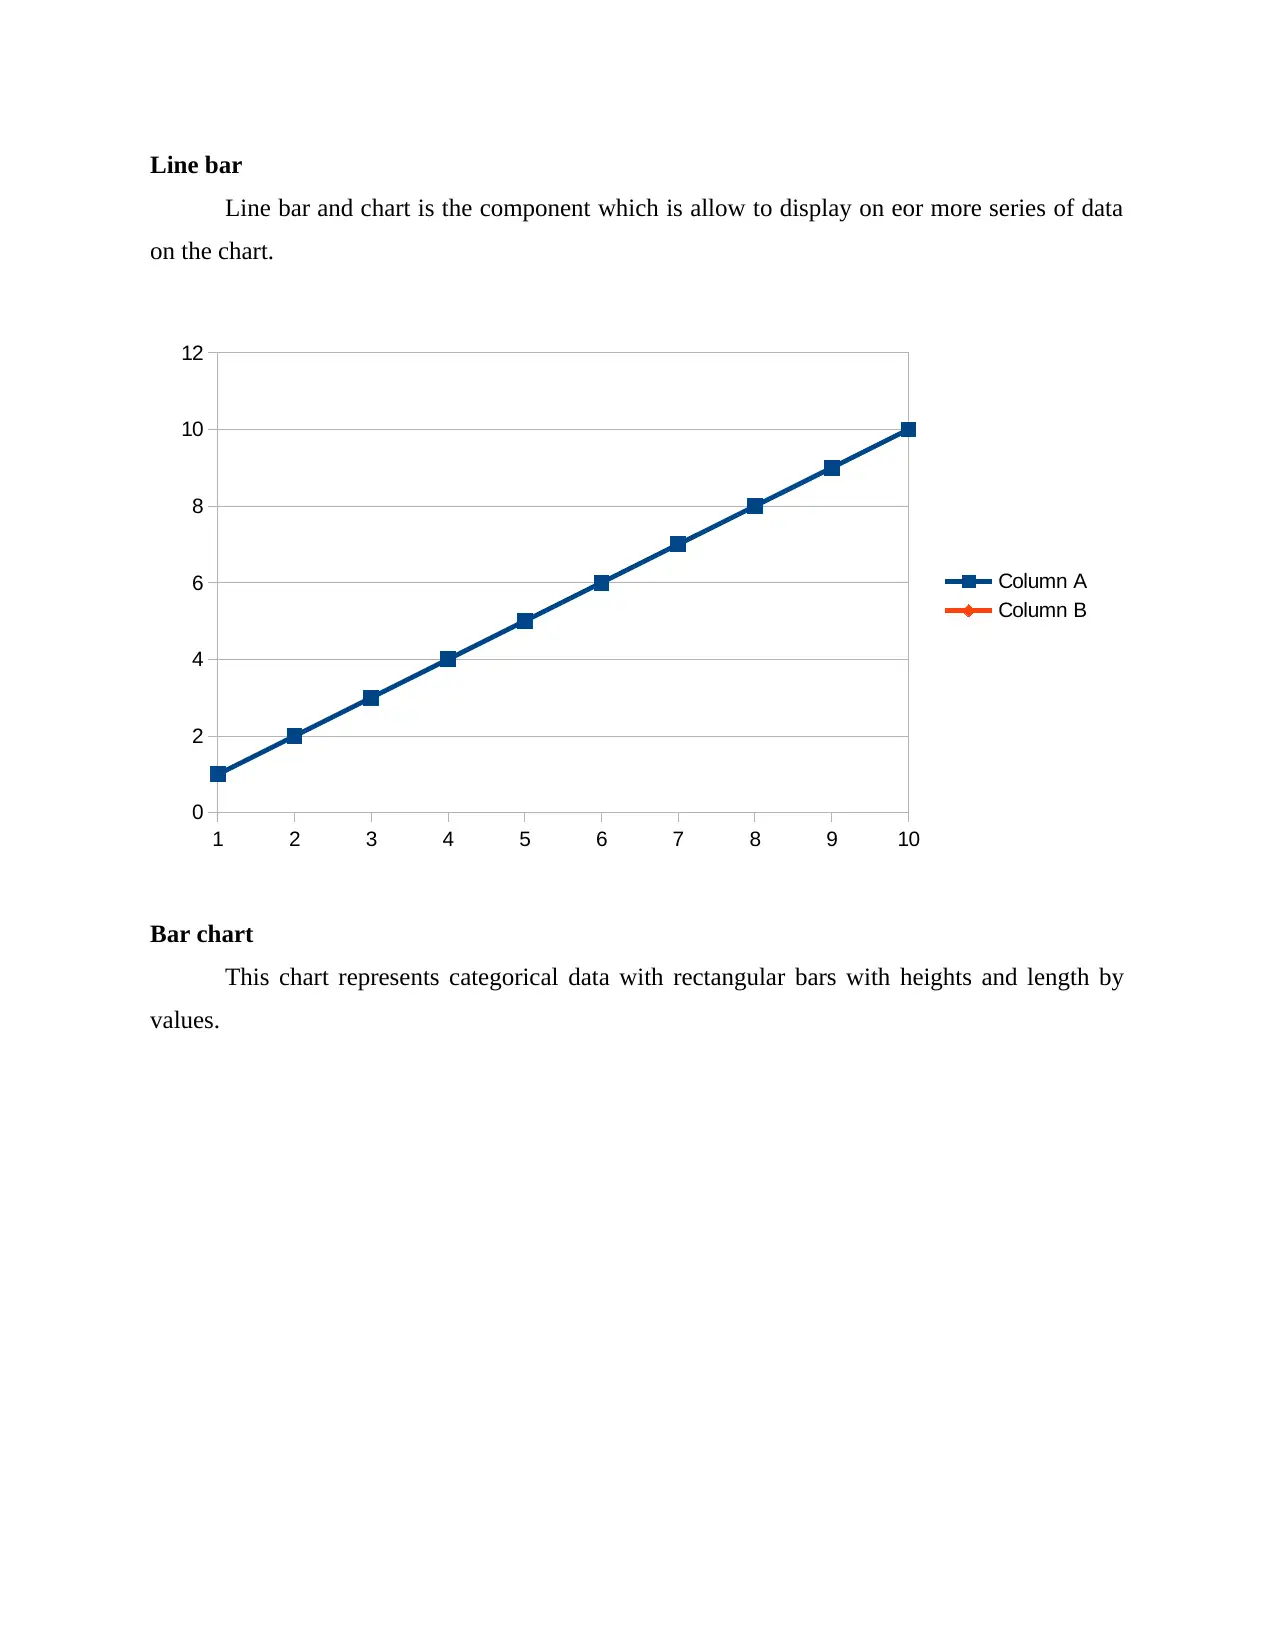
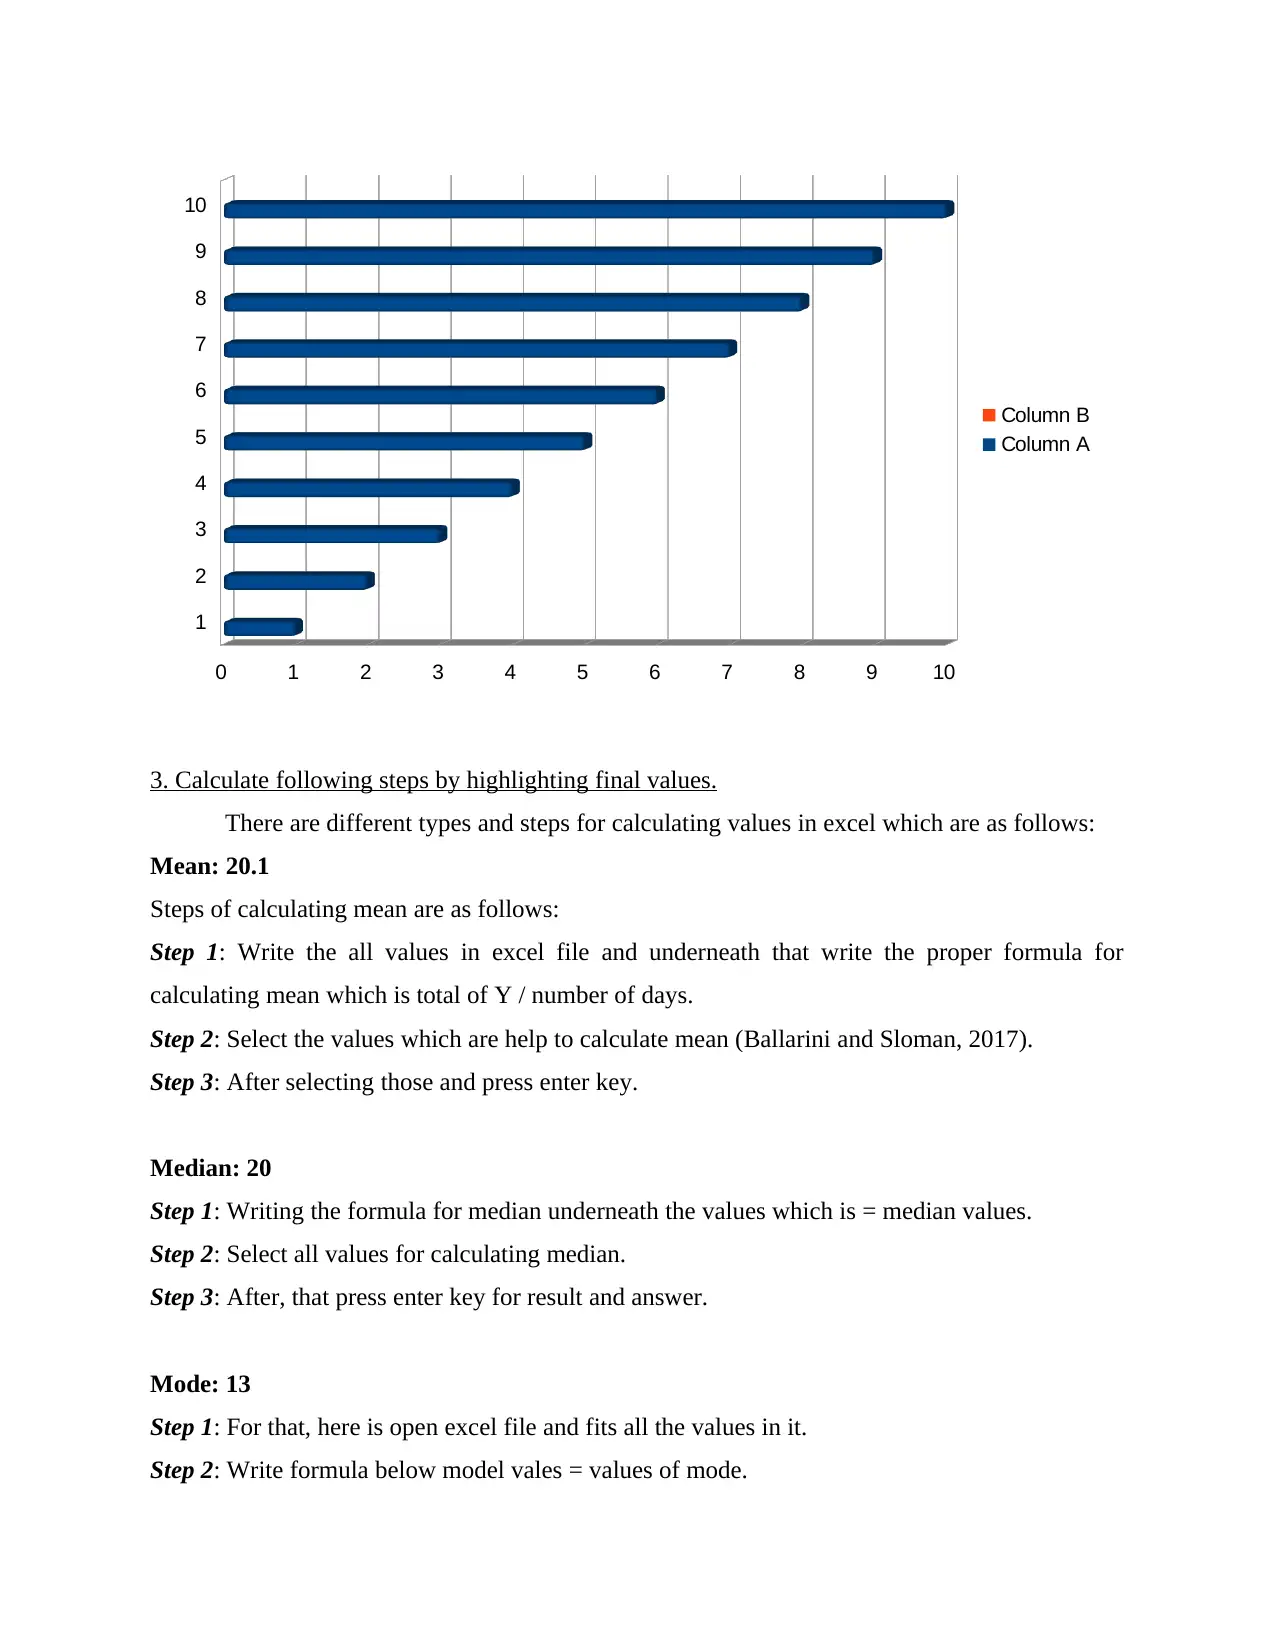
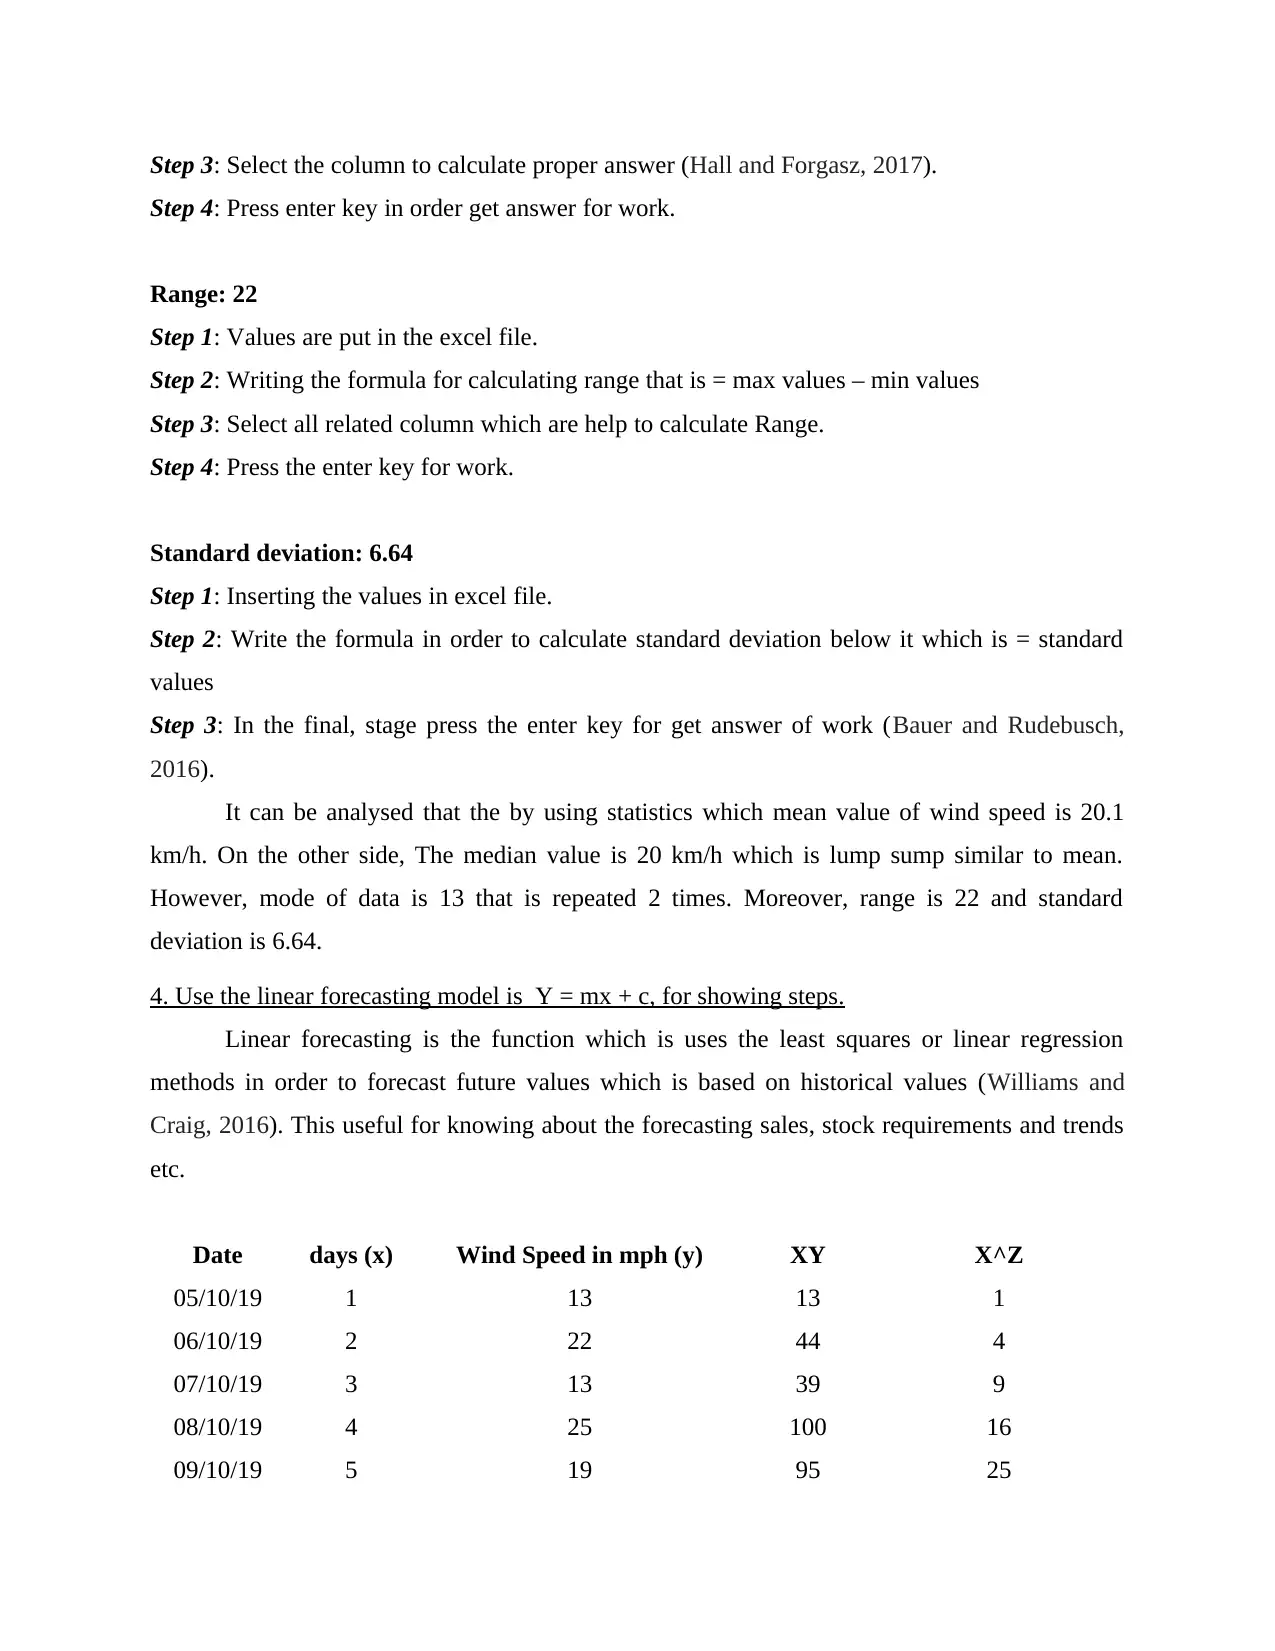
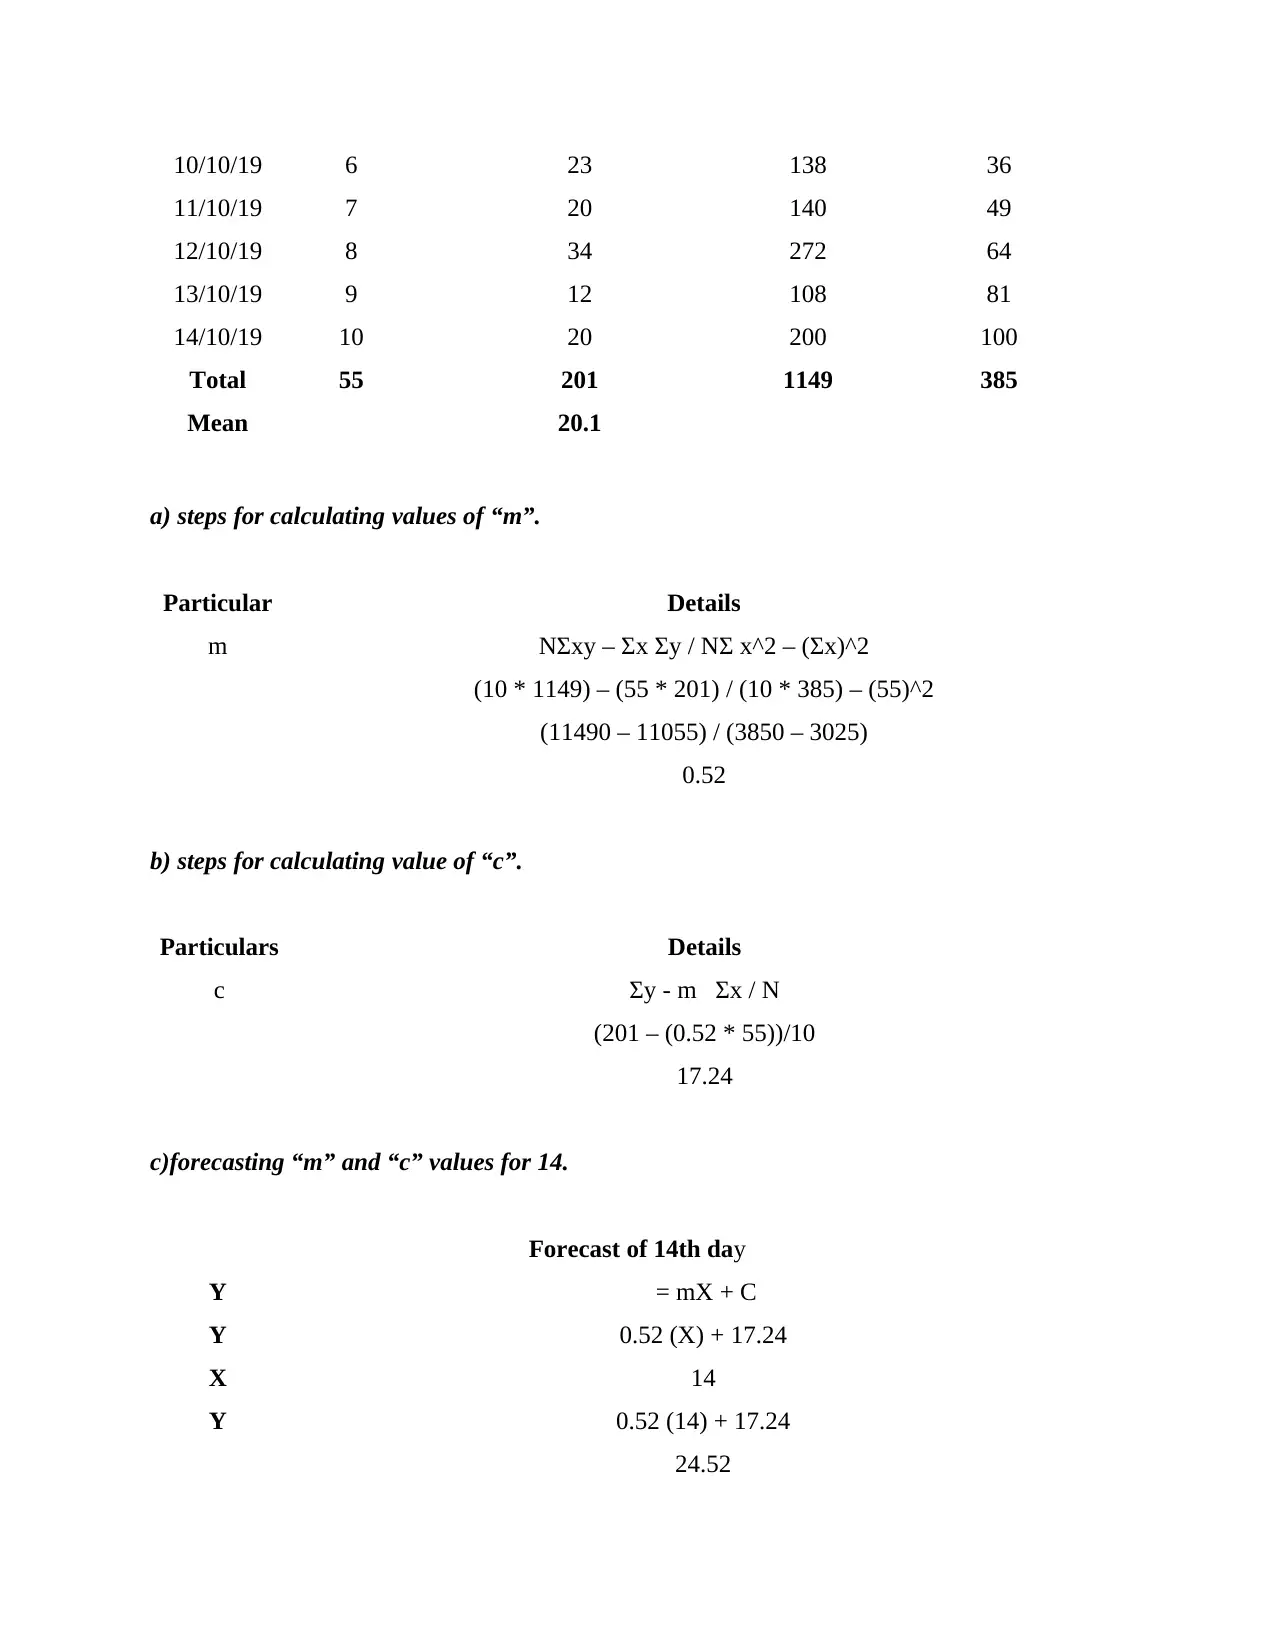
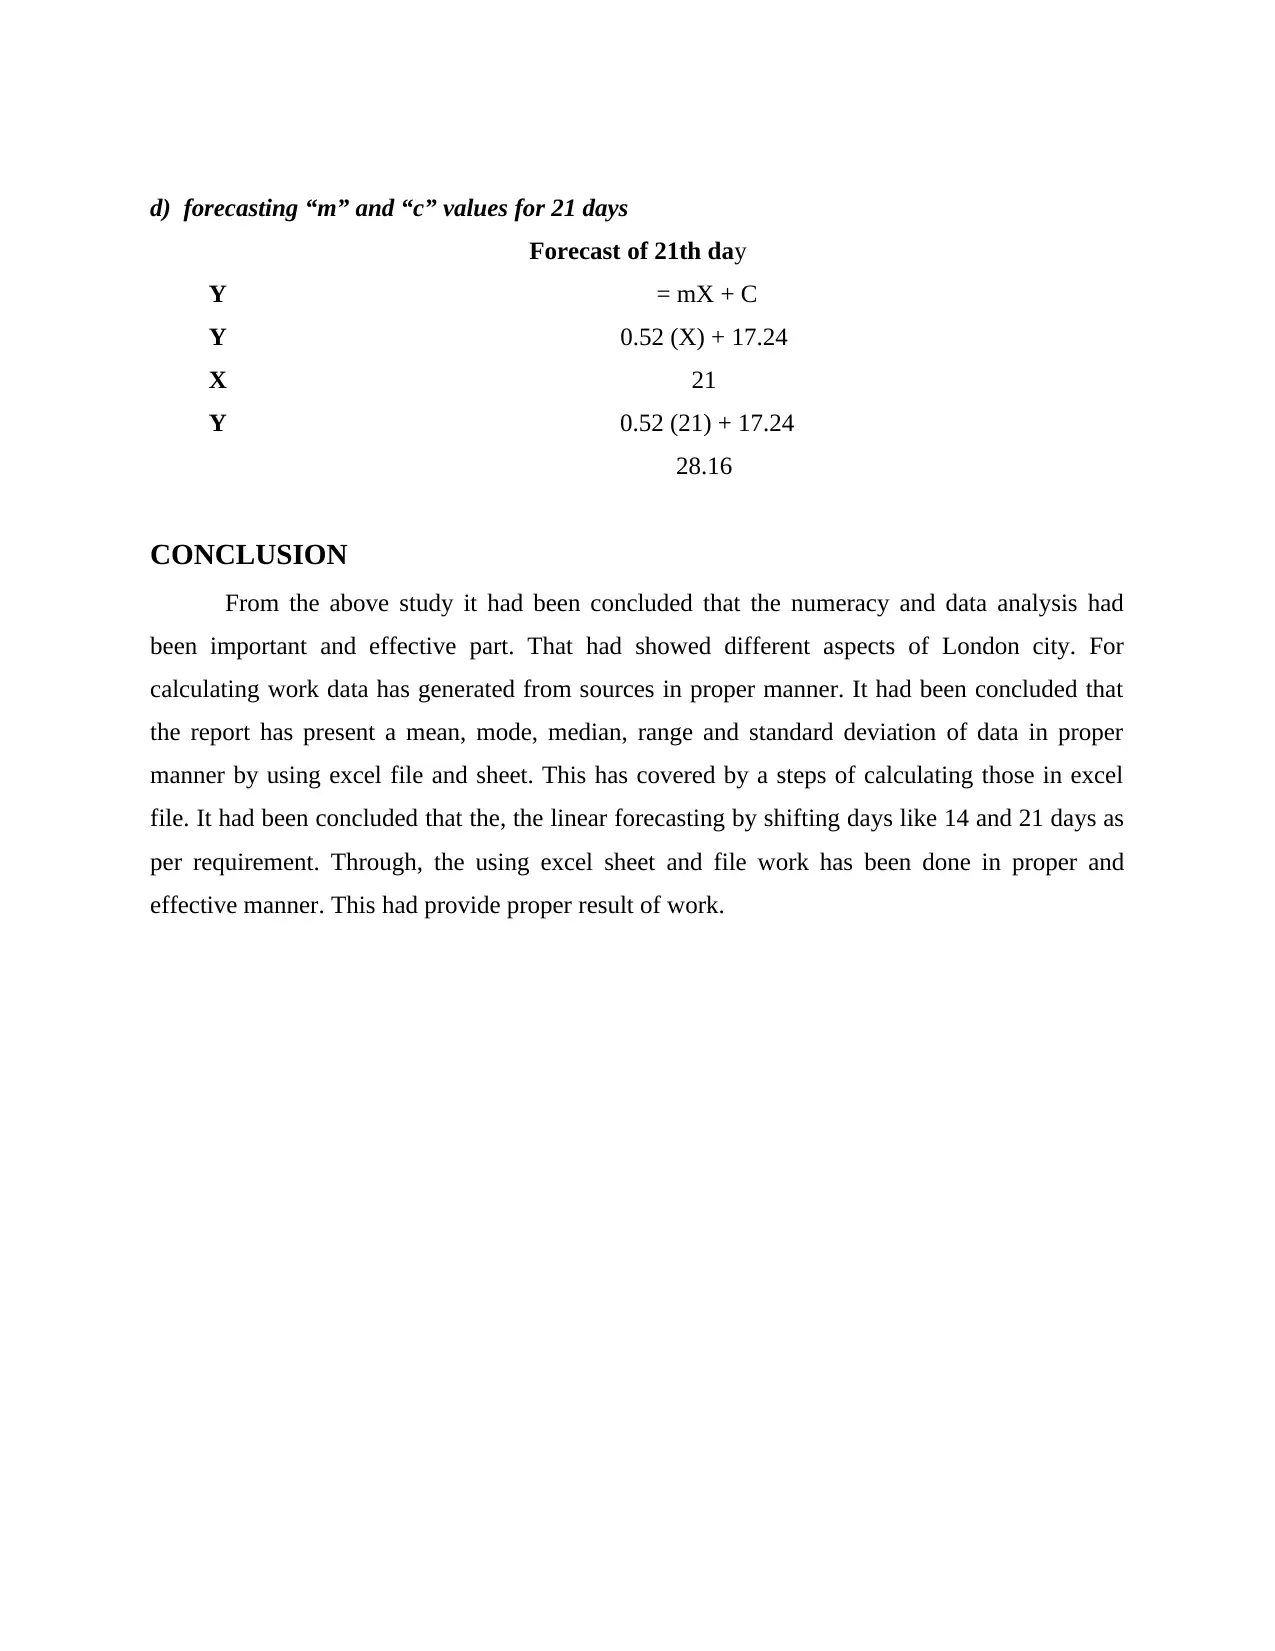
This report presents a comprehensive analysis of wind speed data from London, UK, over a 10-day period. The analysis begins with organizing the data into a tabular format, followed by data visualization using line, bar, and scatter plots. Key statistical calculations are performed, including mean, median, mode, range, and standard deviation, with final values highlighted. Furthermore, the report applies a linear forecasting model (Y = mx + c) to predict future wind speeds, demonstrating the calculation of 'm' and 'c' values and forecasting wind speeds for specific future dates (14th and 21st days). The conclusion emphasizes the importance of numeracy and data analysis, highlighting the effective use of Excel for data presentation and calculation and the application of linear forecasting for predictive analysis. References to relevant literature are also included.
1 out of 8
Related Documents


Your All-in-One AI-Powered Toolkit for Academic Success.
+13062052269
info@desklib.com
Available 24*7 on WhatsApp / Email
![[object Object]](/_next/static/media/star-bottom.7253800d.svg)
Copyright © 2020–2026 A2Z Services. All Rights Reserved. Developed and managed by ZUCOL.