Analyzing Advertisement Expenses: A Detailed Numeracy Report
VerifiedAdded on 2023/06/18
|11
|1476
|251
Report
AI Summary
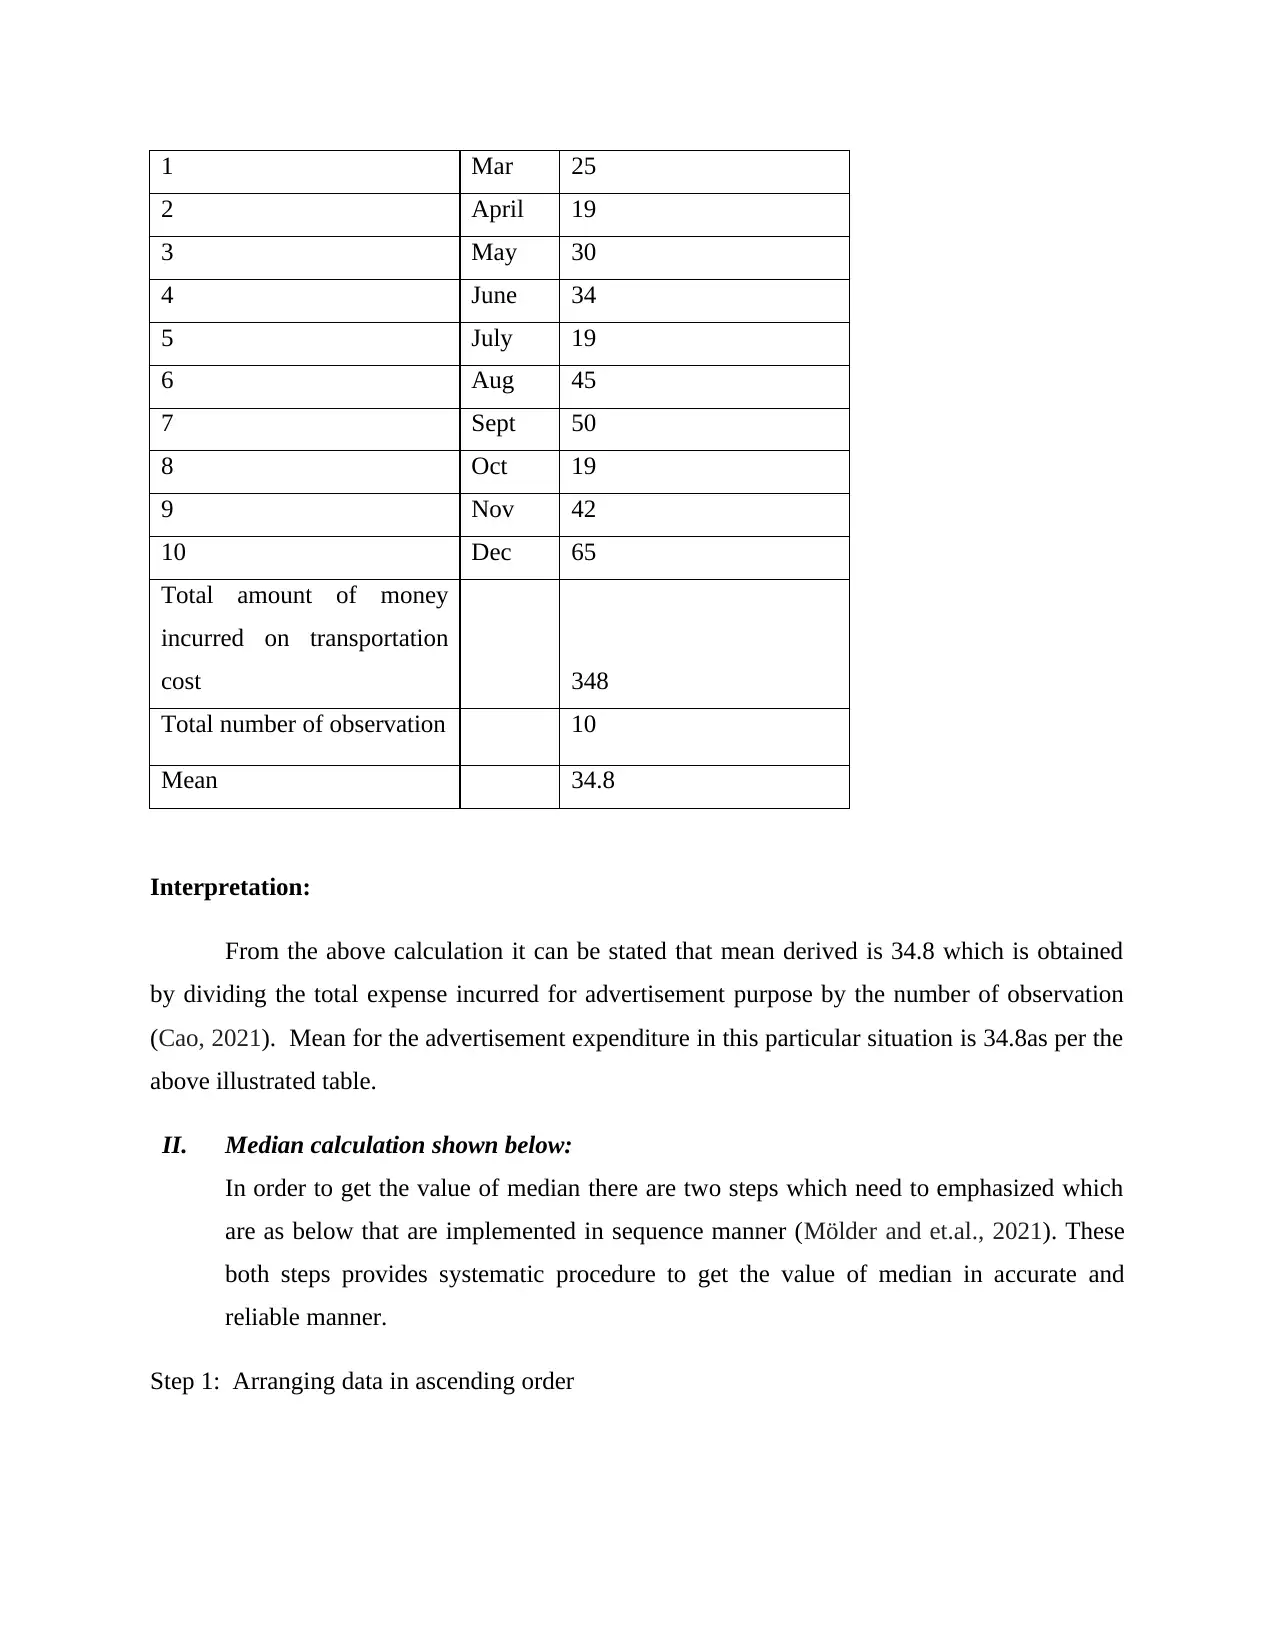
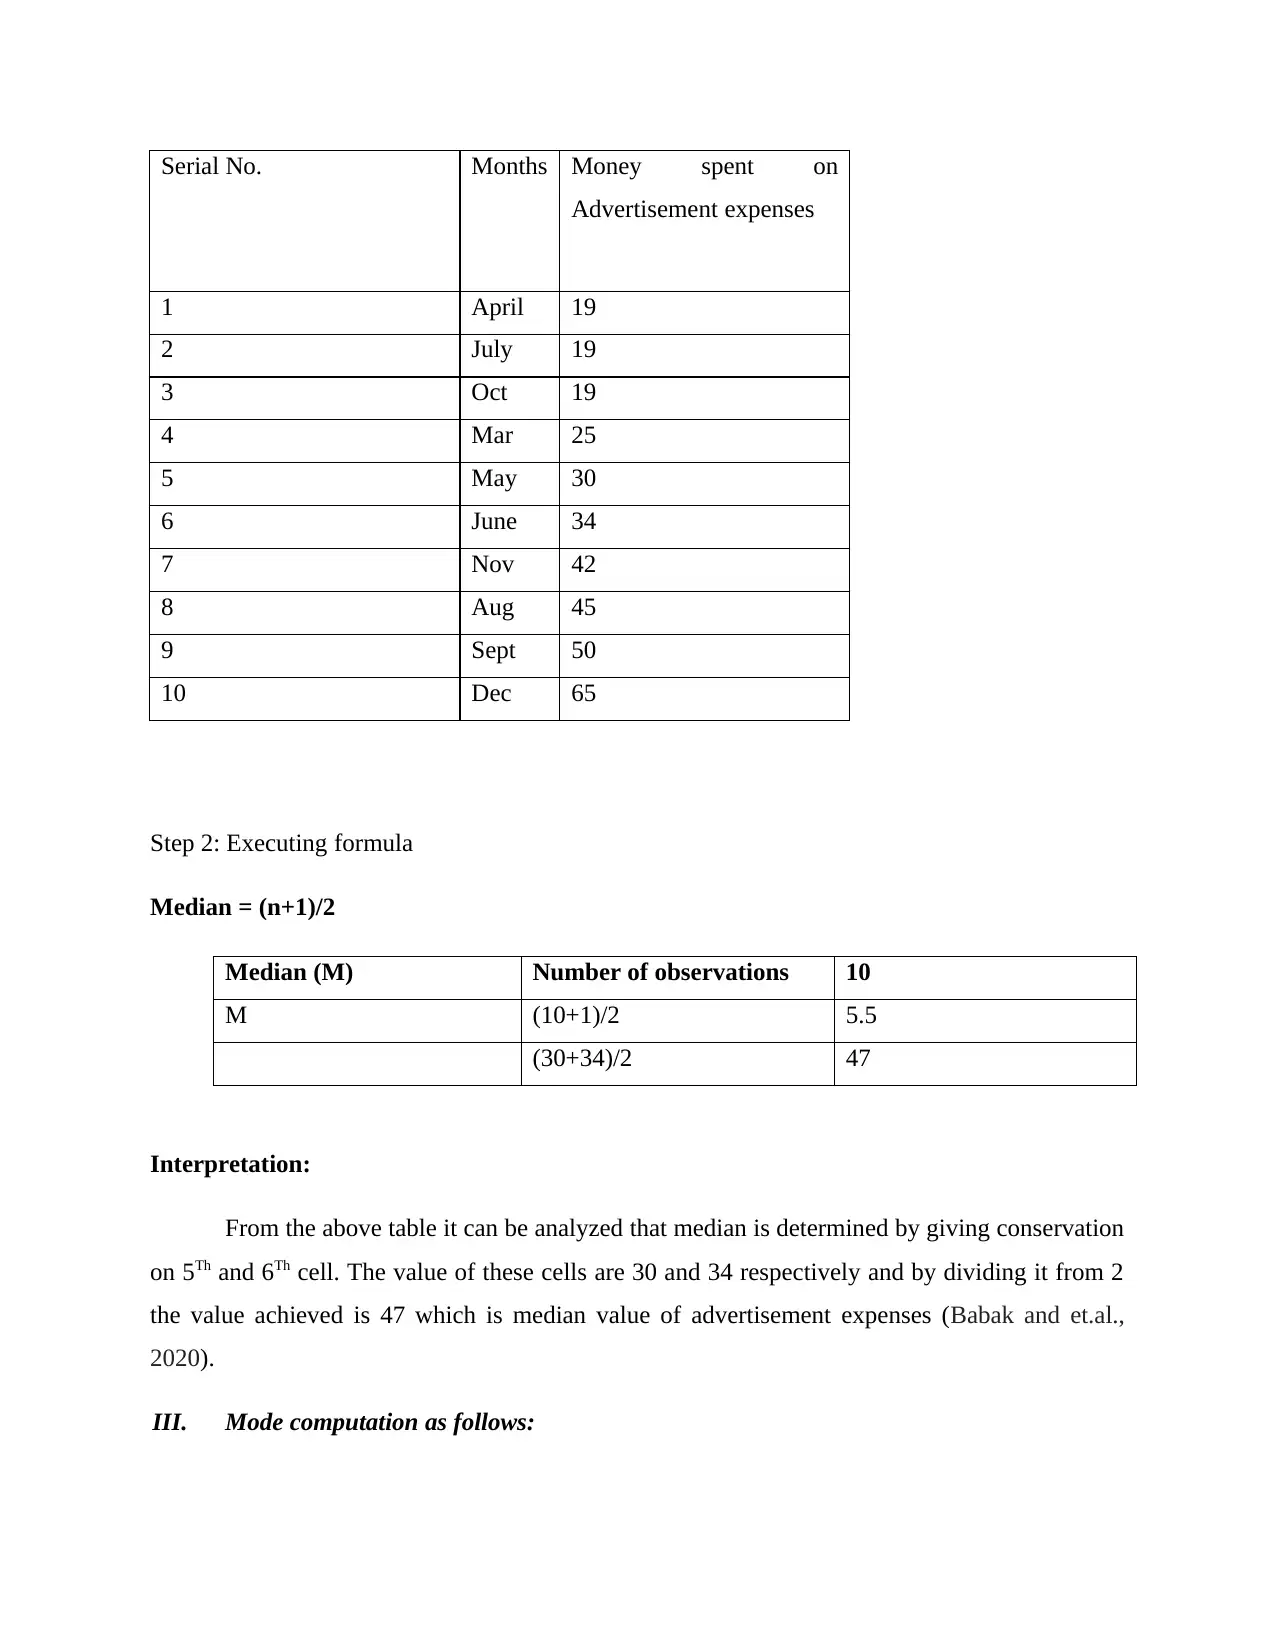
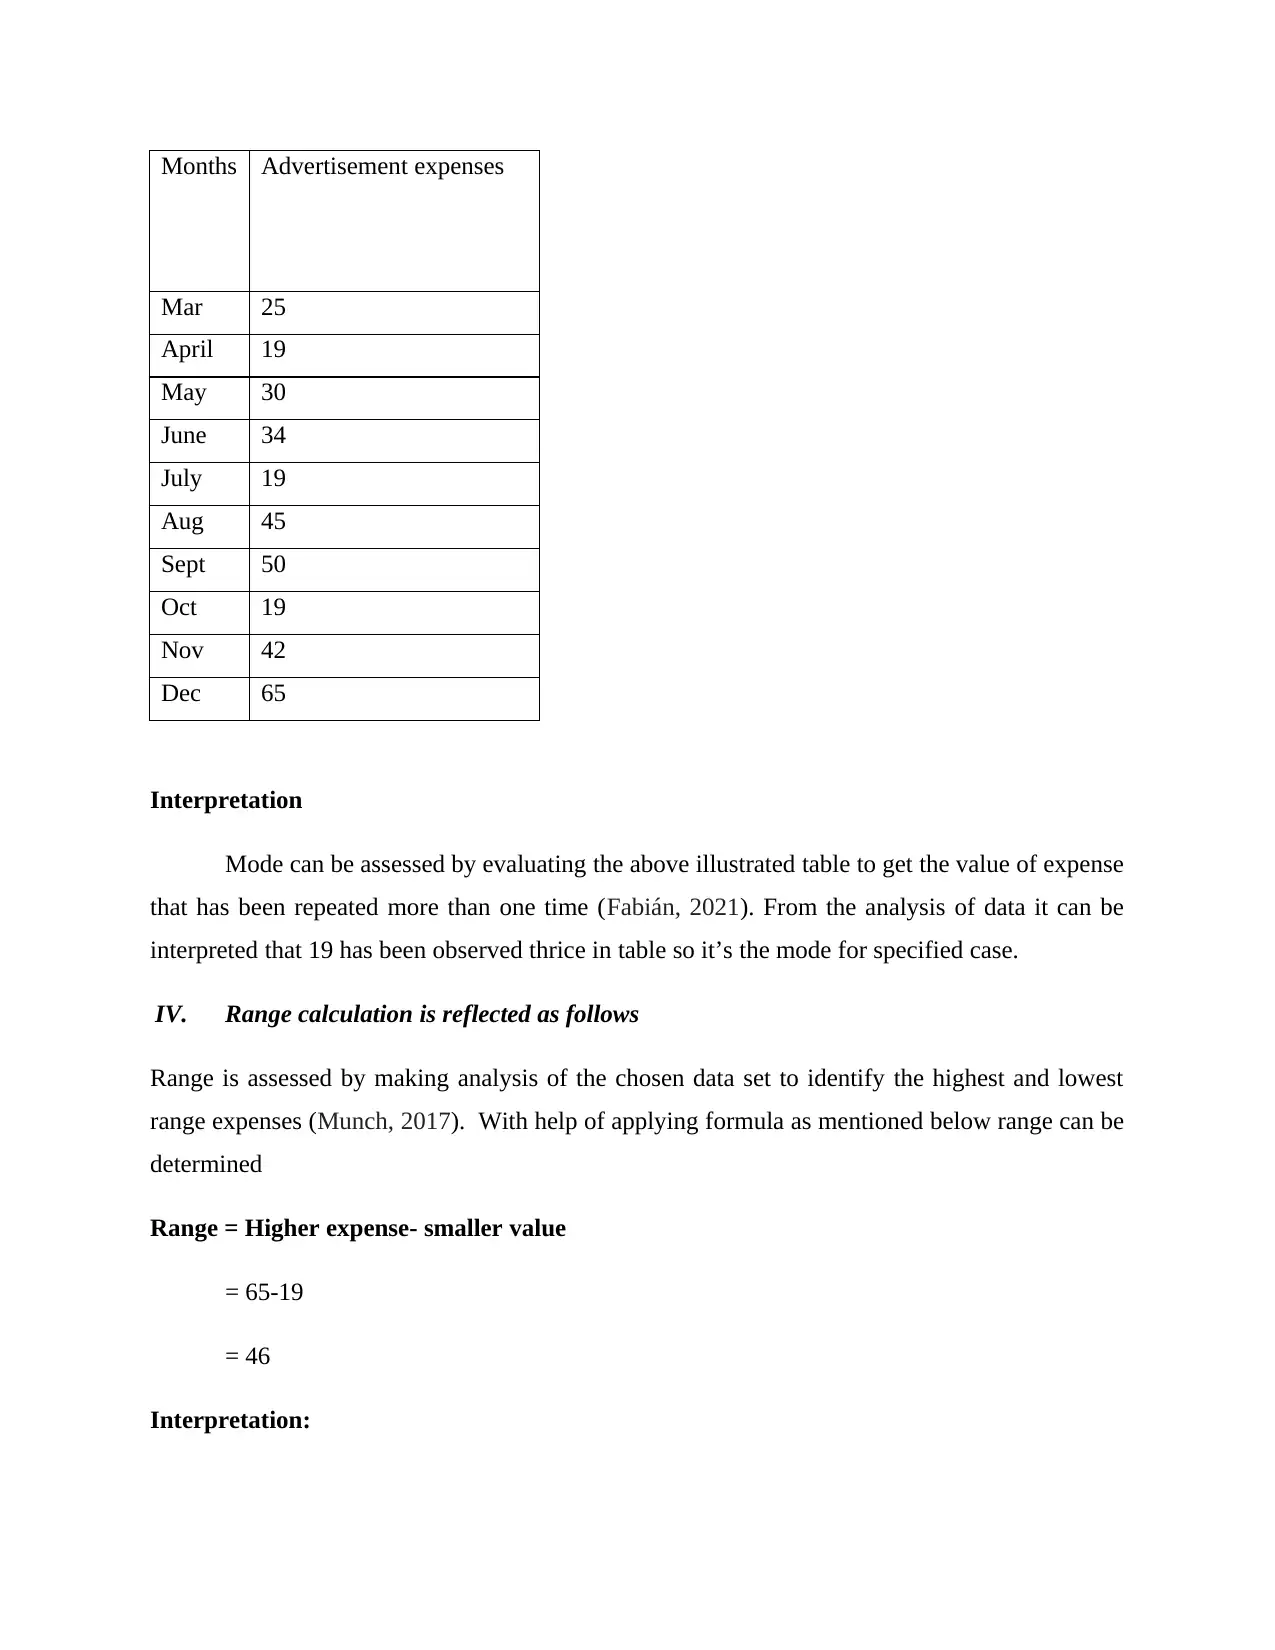
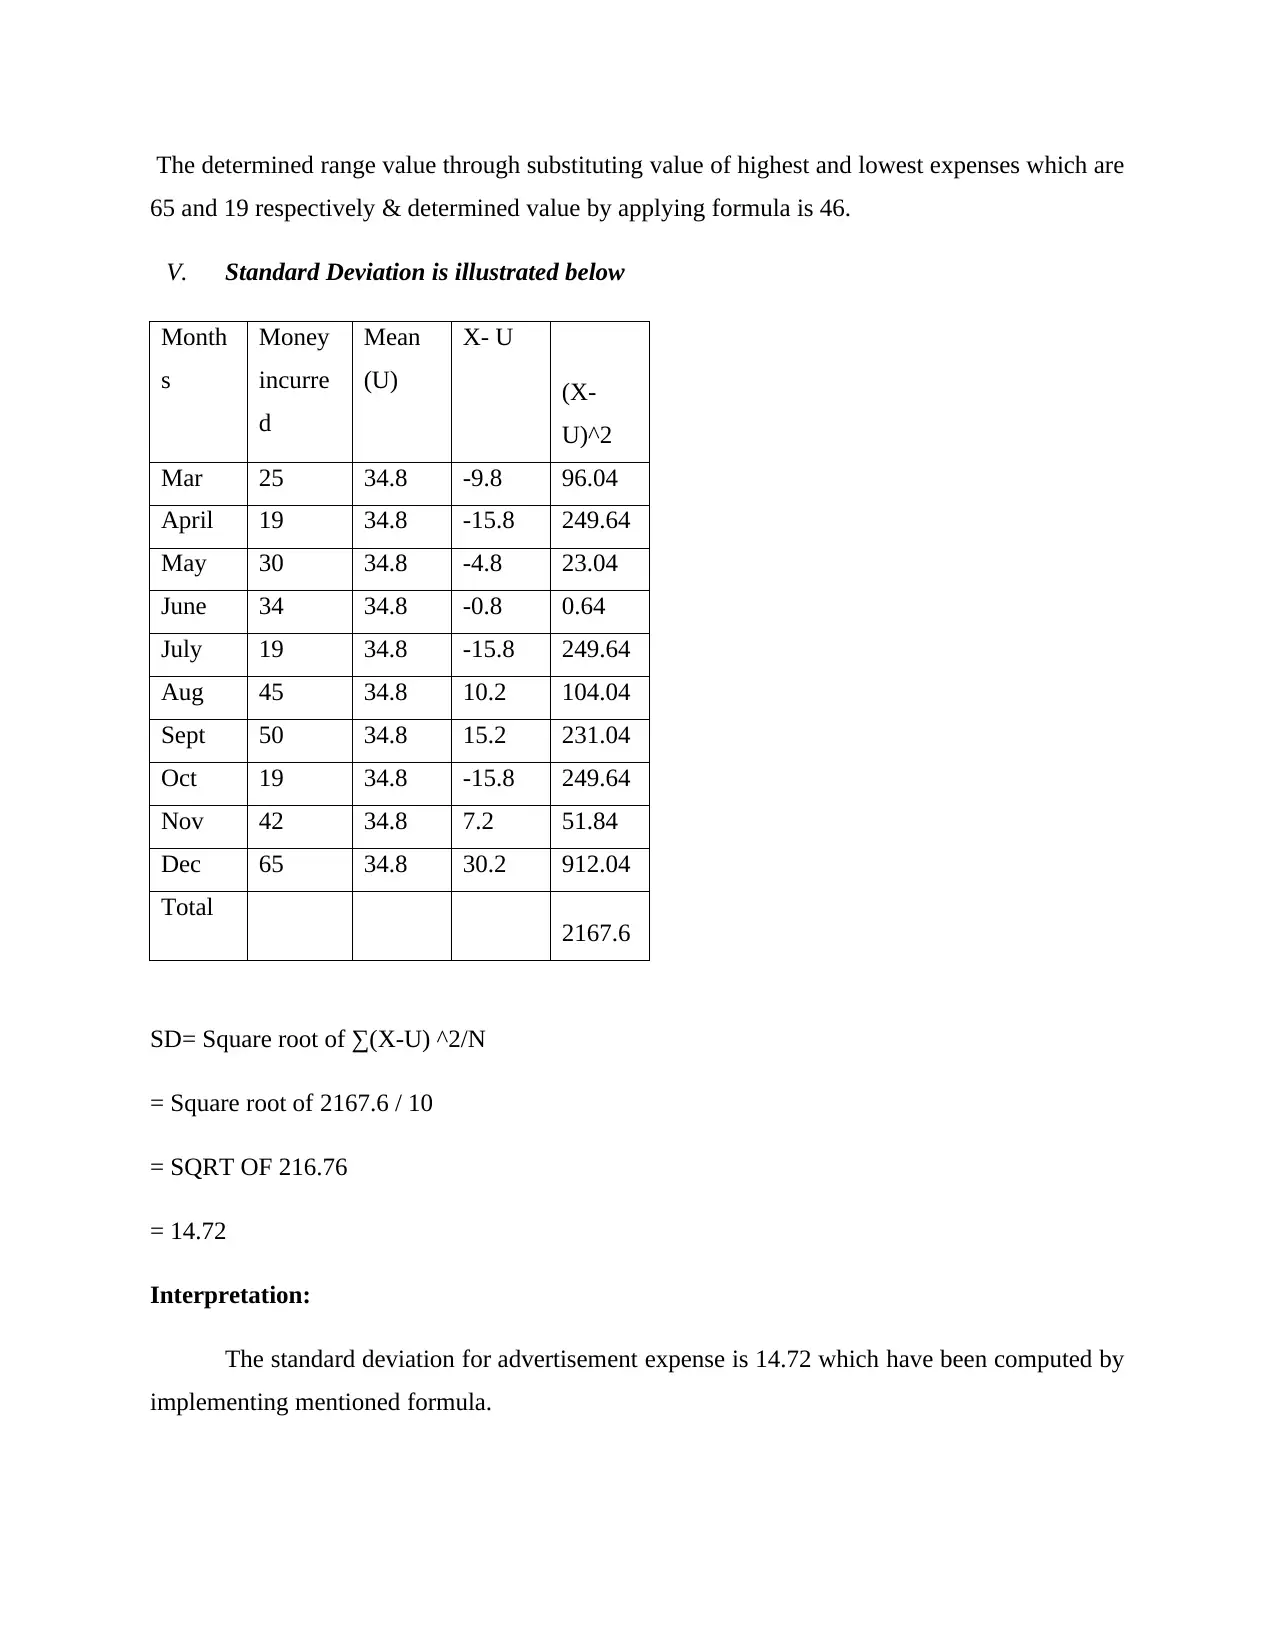
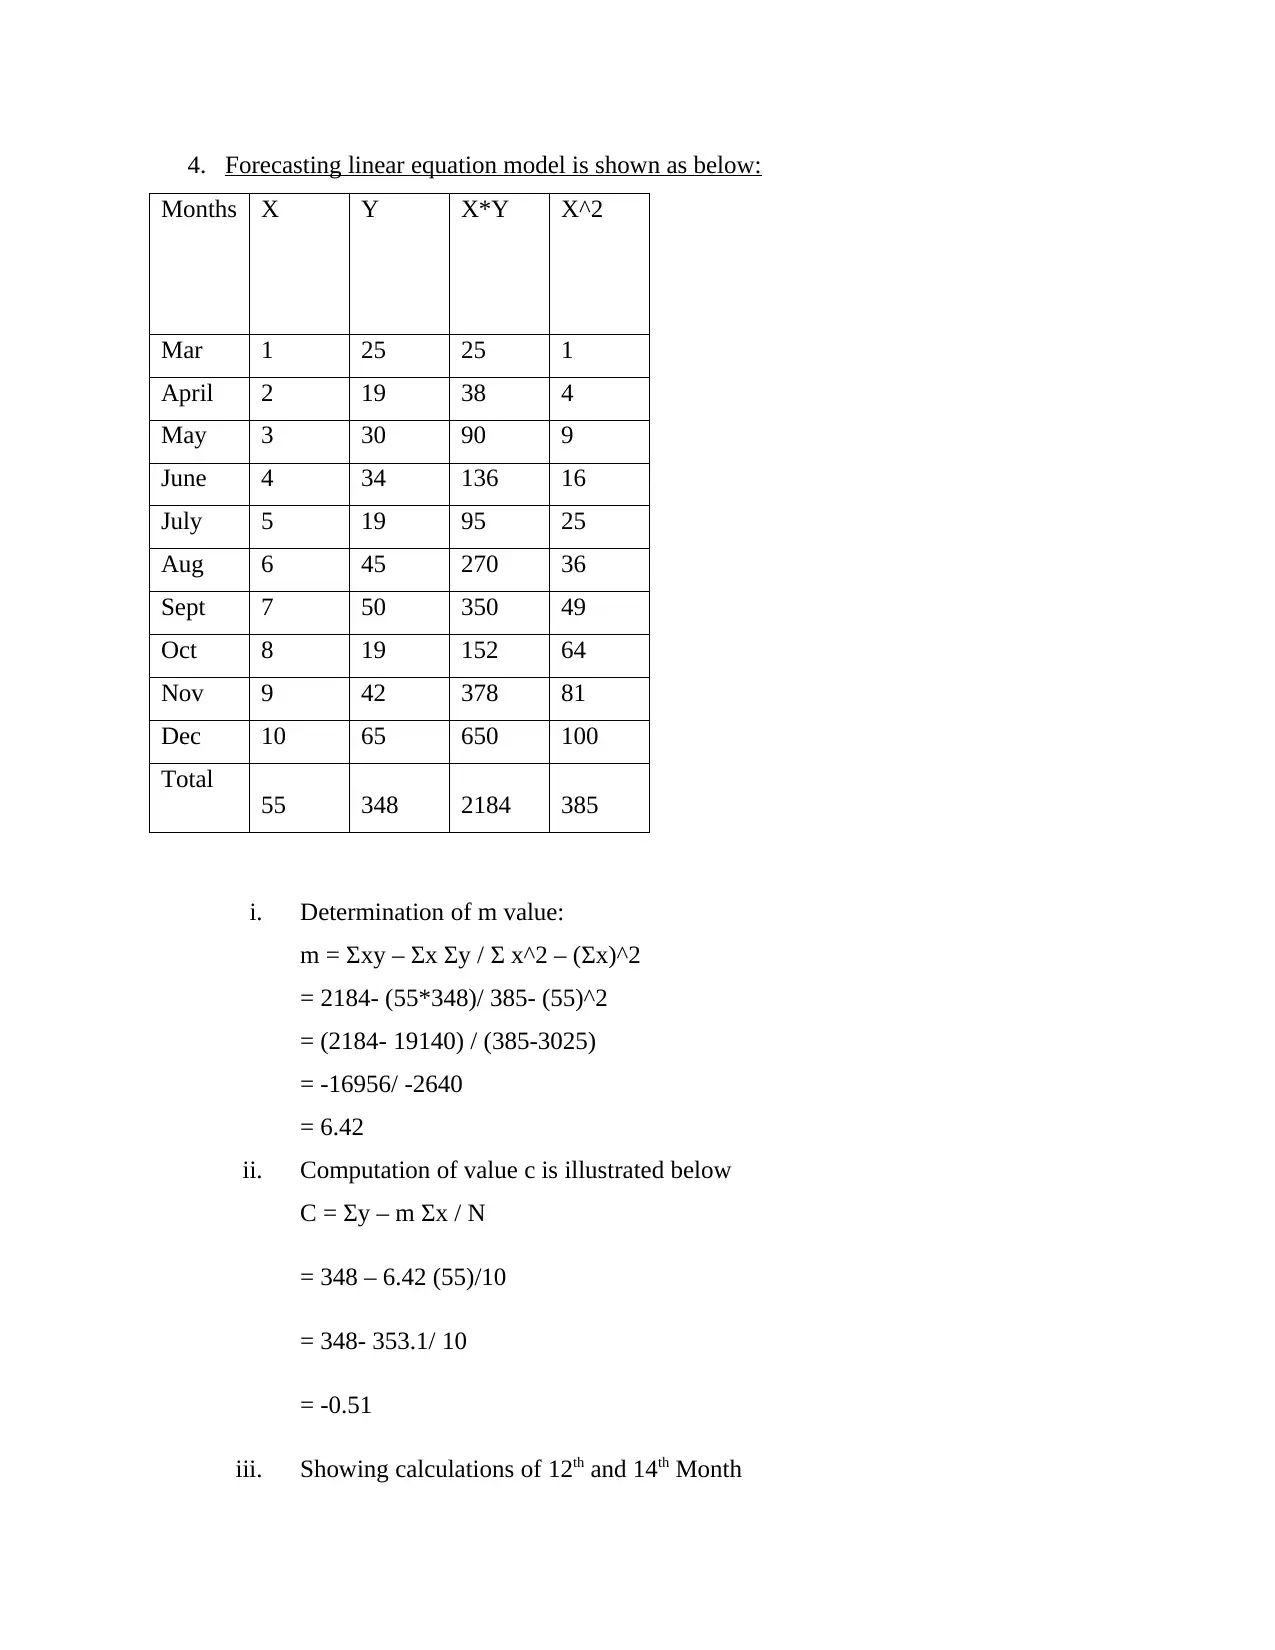
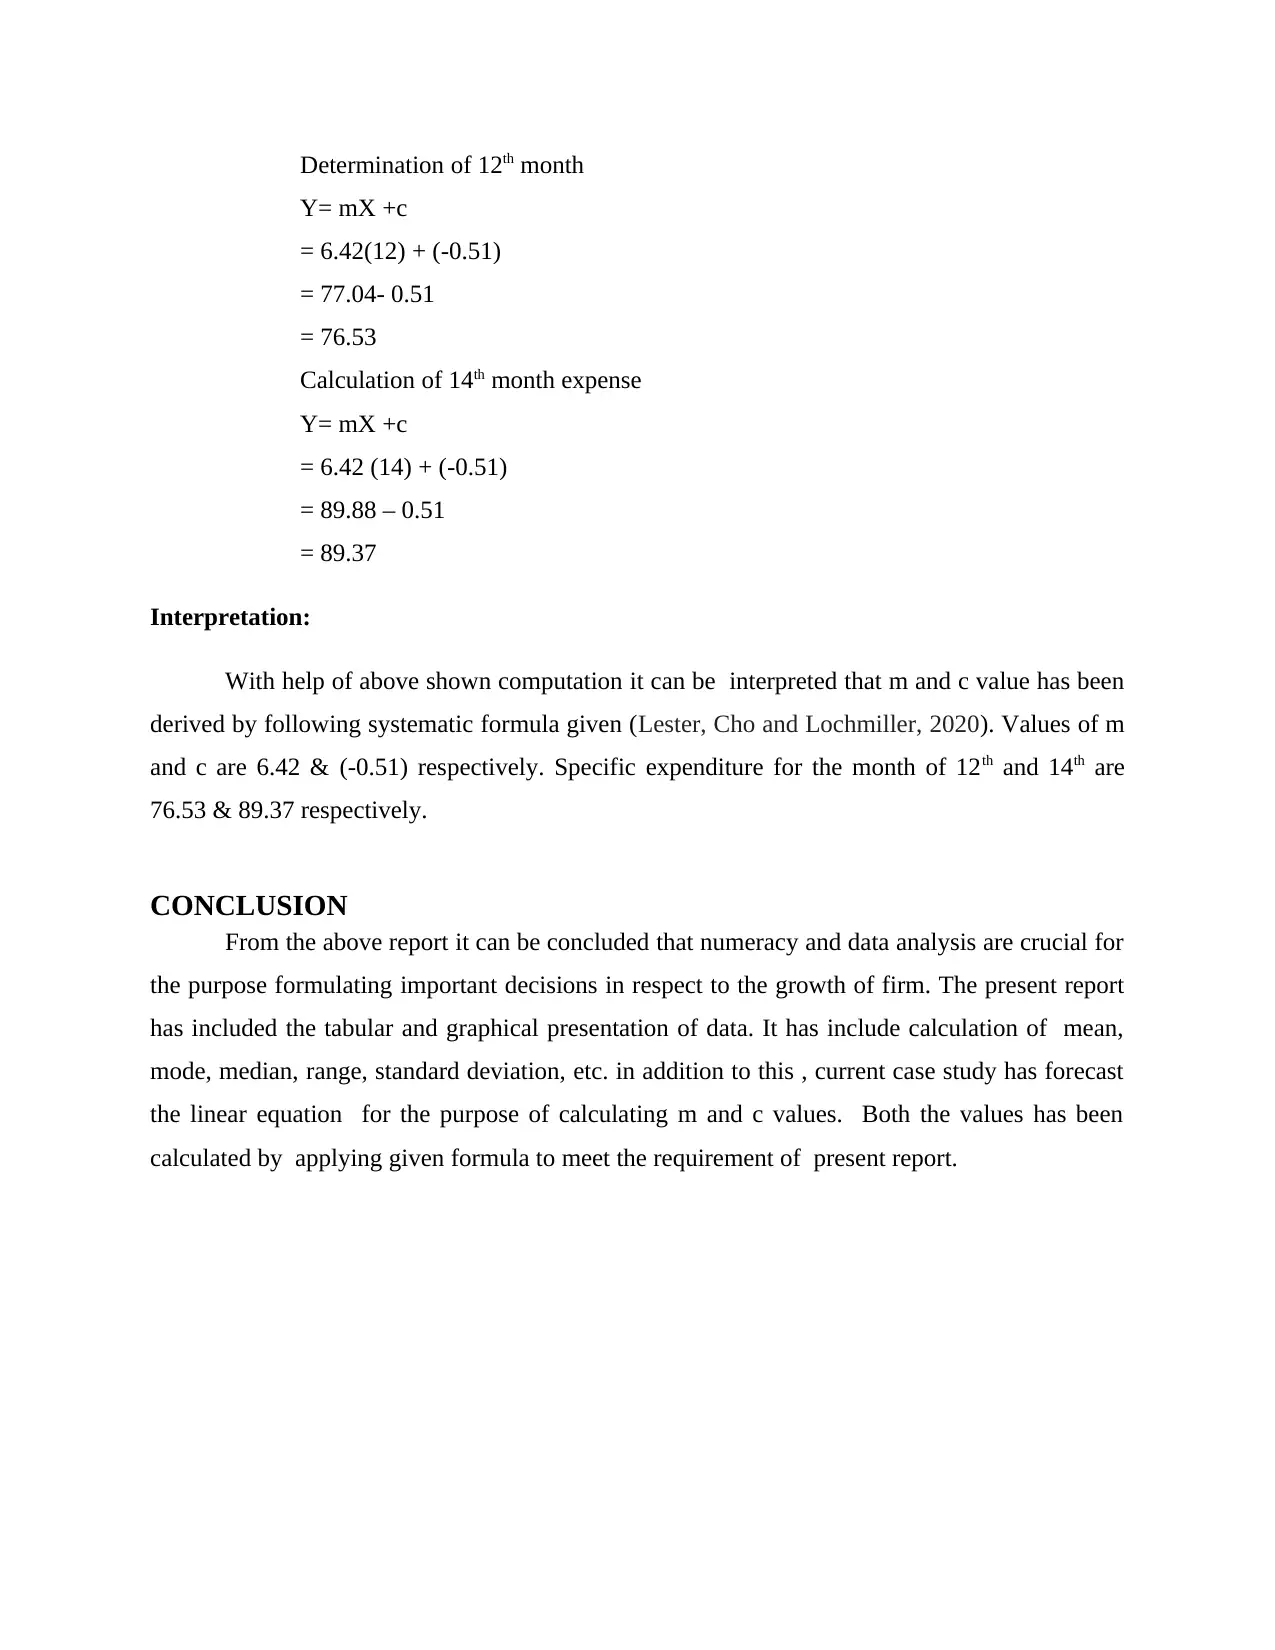
This report provides a comprehensive analysis of advertisement expenses using various statistical methods. It includes tabular and graphical data presentation, calculations of mean, median, mode, range, and standard deviation. Furthermore, the report employs a linear forecasting model to determine 'm' and 'c' values, crucial for predictive analysis. The analysis offers insights into expenditure patterns and forecasts future expenses, concluding that numeracy and data analysis are essential for informed decision-making and strategic growth within organizations. This document is available on Desklib, a platform offering a wide array of study tools and solved assignments for students.
1 out of 11
Related Documents


Your All-in-One AI-Powered Toolkit for Academic Success.
+13062052269
info@desklib.com
Available 24*7 on WhatsApp / Email
![[object Object]](/_next/static/media/star-bottom.7253800d.svg)
Copyright © 2020–2026 A2Z Services. All Rights Reserved. Developed and managed by ZUCOL.