Detailed Report on Applications of Numeracy, Data and IT
VerifiedAdded on 2023/06/18
|18
|4187
|379
Report
AI Summary
This report focuses on the application of numeracy, data handling, and information technology in problem-solving and data interpretation. It includes calculations involving fractions, percentages, and significant figures, alongside practical applications such as determining costs, savings, and time management. The report analyzes a dataset related to Olympic medal counts, answering questions about medal distribution, country performance, and potential influencing factors. The analysis involves calculating ranges, modes, and percentages to derive meaningful insights from the provided data. The document makes effective use of numeracy skills and IT tools to interpret and present data.
Using Numeracy, Data
and IT
and IT
Paraphrase This Document
Need a fresh take? Get an instant paraphrase of this document with our AI Paraphraser
Contents
INTRODUCTION...........................................................................................................................3
PART-1.............................................................................................................................................3
PART-2.............................................................................................................................................8
PART-3...........................................................................................................................................10
CONCLUSION..............................................................................................................................17
References......................................................................................................................................18
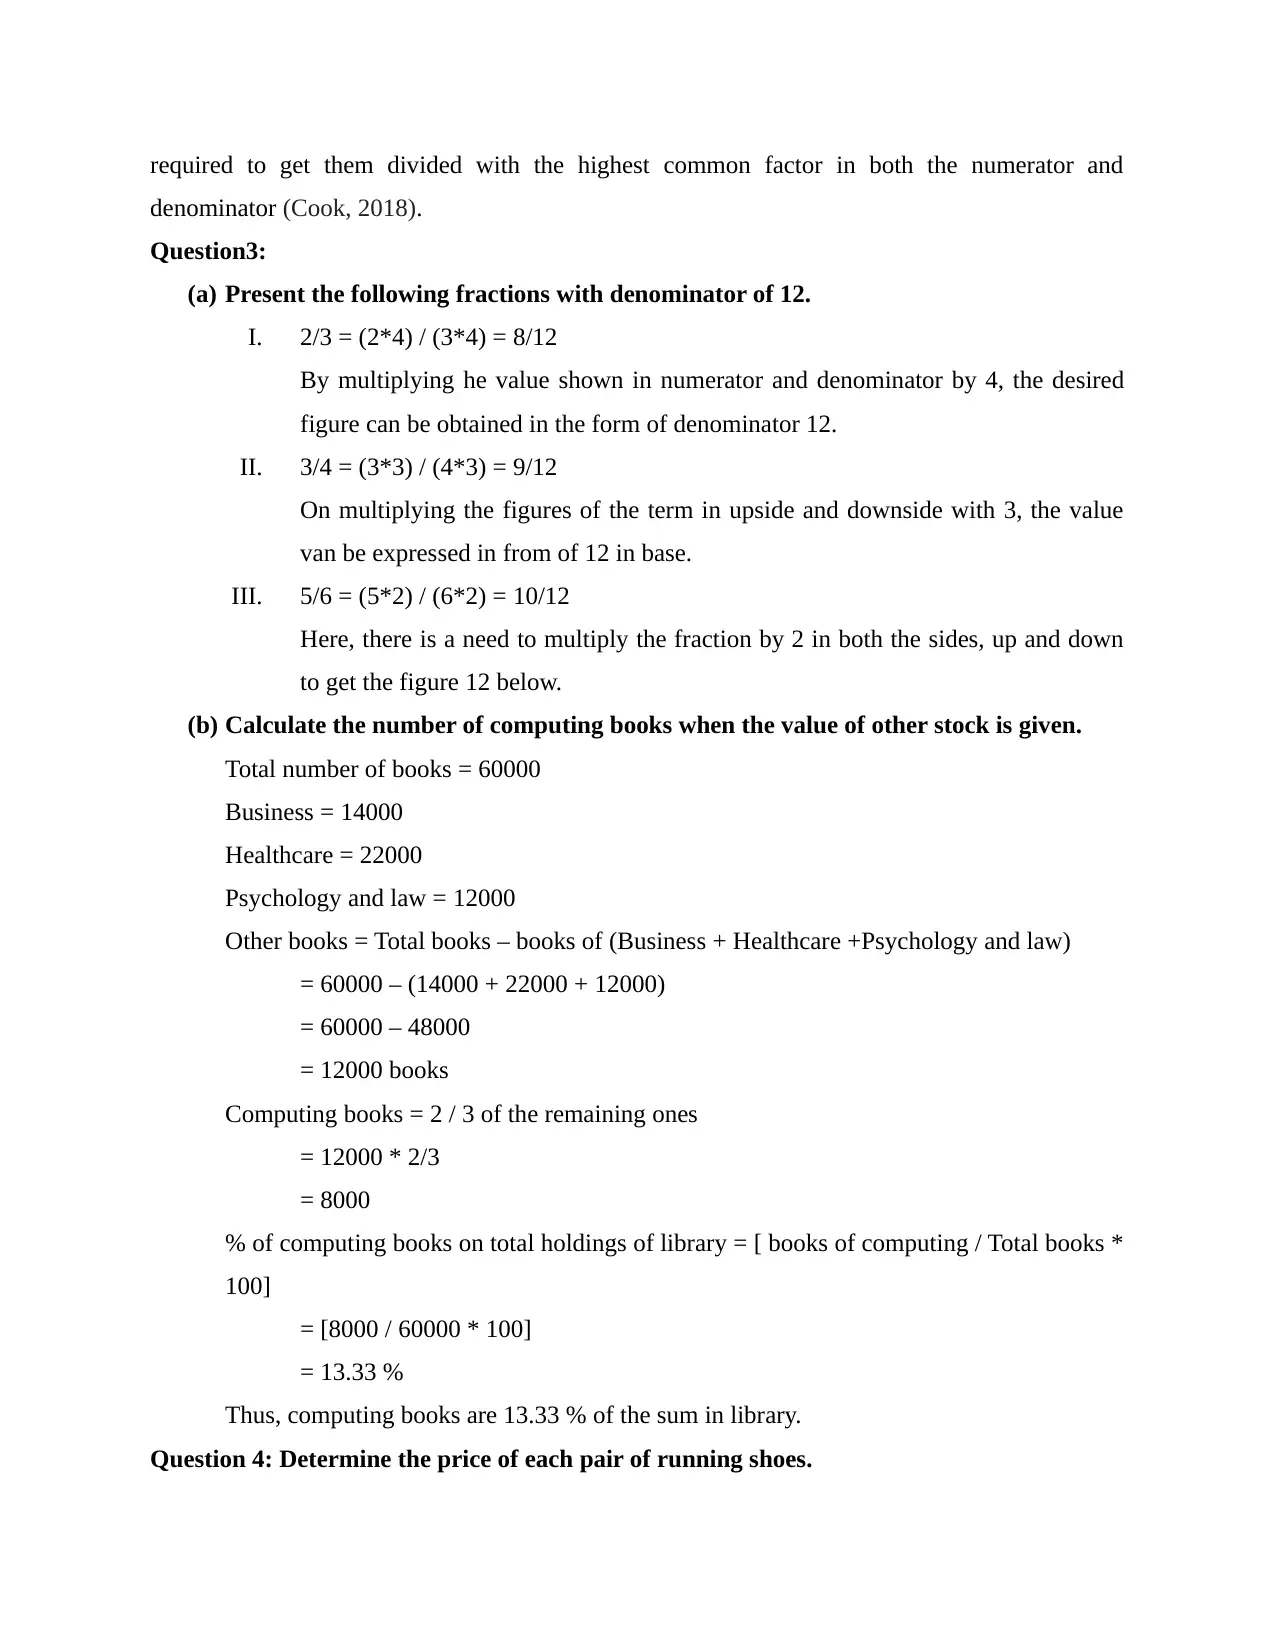
INTRODUCTION
Numeracy is the method of understanding and calculating the values of figures by
making use of other information on it. It is not about complex skills of mathematics. It is just a
confident knowledge of math and its application in real life instances. Data is a collection of raw
data, value and figures which need dome interpretation and operation through the tools of
numeracy. IT helps in sorting all these in better and simplest form for analysis as well as
interpretation (Calero, Murillo Huertas and Raymond Bara, 2019). This report is about the
calculation of numbers and data by applying various basic and high level knowledge. It also
makes use of excel and graphs to make the given data meaningful.
PART-1
Question 1: Discuss about numerator and denominator.
Numerator is the upper value of fraction. When a figure is presented in the firm of (a/b),
the value of a presented above is denoted as numerator. It is used to show the portion occupied
by particular fraction from complete data. With the increase in the value of numerator, the value
of complete fraction also increases and vice versa. For example, there are 9 apples in a plate, 2
got rotten. Thus for presenting it in of fraction, 2 will be place in numerator and value will
become, 2/9. If one more apple gets rotten, it will become 3/9. This means two ninth or three
ninth part of all apples are rotten.
Denominator means the value shown below in fraction. In a/b it is the figure b, which is
shown as denominator. The value if whole fraction tends to decrease with increase in its value. In
above example, 9 is the denominator.
Question2: Express followings terms in simplest forms.
I. 24/40 = (24/8) / (40/8) = 3/5
on dividing both the terms up and below by the maximum common factor 8, we get 3/5.
It is the simplest form of this expression.
II. 18/42 = (18/6) / (42/86 = 3/7
When diving the figures of numerator and denominator by 6 which is the maximum
similar value, the resulting value is 3/7. This is its simplest value.
The above mentioned two figures have the potential to be reduced to shorter term.
Presently, there values are high and for the purpose of presenting them to simplest firm, it is
⊘ This is a preview!⊘
Do you want full access?
Subscribe today to unlock all pages.
Trusted by 1+ million students worldwide
required to get them divided with the highest common factor in both the numerator and
denominator (Cook, 2018).
Question3:
(a) Present the following fractions with denominator of 12.
I. 2/3 = (2*4) / (3*4) = 8/12
By multiplying he value shown in numerator and denominator by 4, the desired
figure can be obtained in the form of denominator 12.
II. 3/4 = (3*3) / (4*3) = 9/12
On multiplying the figures of the term in upside and downside with 3, the value
van be expressed in from of 12 in base.
III. 5/6 = (5*2) / (6*2) = 10/12
Here, there is a need to multiply the fraction by 2 in both the sides, up and down
to get the figure 12 below.
(b) Calculate the number of computing books when the value of other stock is given.
Total number of books = 60000
Business = 14000
Healthcare = 22000
Psychology and law = 12000
Other books = Total books – books of (Business + Healthcare +Psychology and law)
= 60000 – (14000 + 22000 + 12000)
= 60000 – 48000
= 12000 books
Computing books = 2 / 3 of the remaining ones
= 12000 * 2/3
= 8000
% of computing books on total holdings of library = [ books of computing / Total books *
100]
= [8000 / 60000 * 100]
= 13.33 %
Thus, computing books are 13.33 % of the sum in library.
Question 4: Determine the price of each pair of running shoes.
Paraphrase This Document
Need a fresh take? Get an instant paraphrase of this document with our AI Paraphraser
Amount given by Liz = 3 * £50 = £150
Change return = £10.50
Consider the price of single pair of shoes be x
Price of 2 pair of shoes: [ 2 times the price of one pair of shoes] + 10.5 = 150
2x + 10.50 = 150
2x = 150 – 10.50
2x = 139.50
x = 139.50 / 2
= £69.75
So, the value of one pair of shoes in £69.75.
Question 5:
(a) Express the value into 2 significant figures.
For calculating the figure to 2 decimal places, the value of resulting figure is required to
be presenting by summing up the whole amount and presenting only 2 digits after
decimal.
240.50 * 19.54
= 4699.3700
The above value is up to 4 decimal places. For getting desired result of 2 significant
figures, it is important to remove the last two digits, which are 00 in this case. So,
resulting value is 4699.37
(b) Present the number as a power if 10.
Showing the value as a power of 10 means presenting it comprehensive scientific
quotation.
52100= 5.21 * 10^4
So, the desired figure is 5.21 * 104.
Question 6
(a) Calculate total savings
Total discount = 30%
Amount paid by patty and her two siblings = £210
Advantage of offer in percentage = 100*30 = 70 %
If the value of £210 amounts to 70%, then value saved by them will be =
value paid / % of amount paid * % of
discount
= 210 / 70 * 30
= £ 90
So, the total savings made by them results to be £90.
(b) What is the average savings per person?
Total number of people = 3
Sum of savings = 90
Average for one person = Total savings / Number of person
=90 / 3
= 30
Thus, average savings per person is equal to £ 30.
Question 7: Calculate the following:
(a) 3 / 4 – 7 / 9 + 2 / 3
The very first step for solving this equation is to derive the lowest common multiple
(LCM) of the denominators which are 4, 9, 3. It comes out to be 36. Now, all the value of
equation will be multiplied by such numbers that the figure in denominator comes out to
be 36.
(3 / 4 *9 / 9) – (7 / 9 *4 / 4) + (2 / 3 * 12 / 12)
The resulting value is (27 – 28 + 24) / 36
= (-1 + 24) / 36
= 23 / 36
So, 3 /4 – 7 /9 + 2 / 3 = 23 / 36
(b) Determine the largest number.
0.1, 0.02, 0.003, 0.0004, 0.00005
Considering the case of decimal values, all the figures mentioned above are divided by
power of 10s. when the power of 10 tends to increase in denominator, the resulted value
after division becomes more and more smaller.
For 0.1, the divisor is 10. But in 0.02, the divisor becomes 100, and this process goes on
for all the values.
⊘ This is a preview!⊘
Do you want full access?
Subscribe today to unlock all pages.
Trusted by 1+ million students worldwide
Also, looking at the place value, the highest value among these numbers comes out to be
0.1.
Thus, Largest number = 0.1
Question 8: Calculate the percentage of men who said no.
Total number of men = 90
Sum total of women = 60
Total persons = 90 + 60 = 150
Total number of people who said ’YES’ = 150 * 3 / 5
= 90
Total number of women saying ‘Yes’ = 60 * 3 / 10
= 18
Men saying yes = 90 – 18
= 72
Number of men saying no = 90 – 72
= 18
Percentage of men saying no = count of men saying no / total number of men * 100
= 18 / 90 * 100
= 20 %;38
Count if men saying no in percentage = 20 % men
Question 9: Calculate the time at which Annabelle is required to leave home for attending
conference in Birmingham.
Time of meeting in Birmingham = 10:30 AM
Let us consider, Annabelle waked out from home at 8:00 AM.
From there, it will take one hour to reach at Euston Rail station, on reaching there, the
time would be 9:00 AM. As per the timing of station, the next train to Birmingham will leave at
9:05 AM. From that train, Annabelle would reach Birmingham after one hour 10 minutes. At this
point, the time would be 10:15.
As it takes 5 minutes to reach the meeting hall from the station, Annabelle would reach
the hall at 10:20 AM which is 10 minutes earlier.
Paraphrase This Document
Need a fresh take? Get an instant paraphrase of this document with our AI Paraphraser
So, Annabelle must move out of house at 8:00 AM. Even 5 minutes’ delay in leaving
home would result in 10 minutes’ delay in reaching her desired location because of the defined
schedule of train for Birmingham
Time pf leaving home = 8:00 AM
Question 10: Determine the heavier box.
Weight of shredded wheat box = 0.35 Kg
Weight of Weetabix box = 9 / 25 Kg = 0.36 Kg
Comparing the value of 0.35 and 0.36 equal to each other.
35 / 100 = 36 / 100
Eliminating denominator 100 from both the values, we get
35 < 36
So, it is clear from above that 36 is greater than 35.
Thus the box of Weetabix with 036 Kg is heavier one.
PART-2
Question 11: Answer the questions on the basis of graph
(a) Determine the country with lowest number of overall medals among the all?
From all the countries, Hungry won only 491 medals, which is the least value.
So, Hungry got least number of medals.
(b) Which country or countries participated in least number of games?
China and Soviet Union competed in lowest count of games.
(c) What is the mode of number of games in which countries participated in?
Highest occurring frequency is 27. It appeared 3 times.
Mode = 27
(d) What is the range of gold medals?
Range = Maximum value – Minimum value
Maximum number of gold medals = 1022
Minimum number of gold medals = 147
Range of gold medals = 1022 – 147 = 875
(e) How many countries got more silver medals than bronze medals?
There are 4 such countries who earned more silver medals rather than bronze. These are
China, Great Britain, Soviet Union & United States.
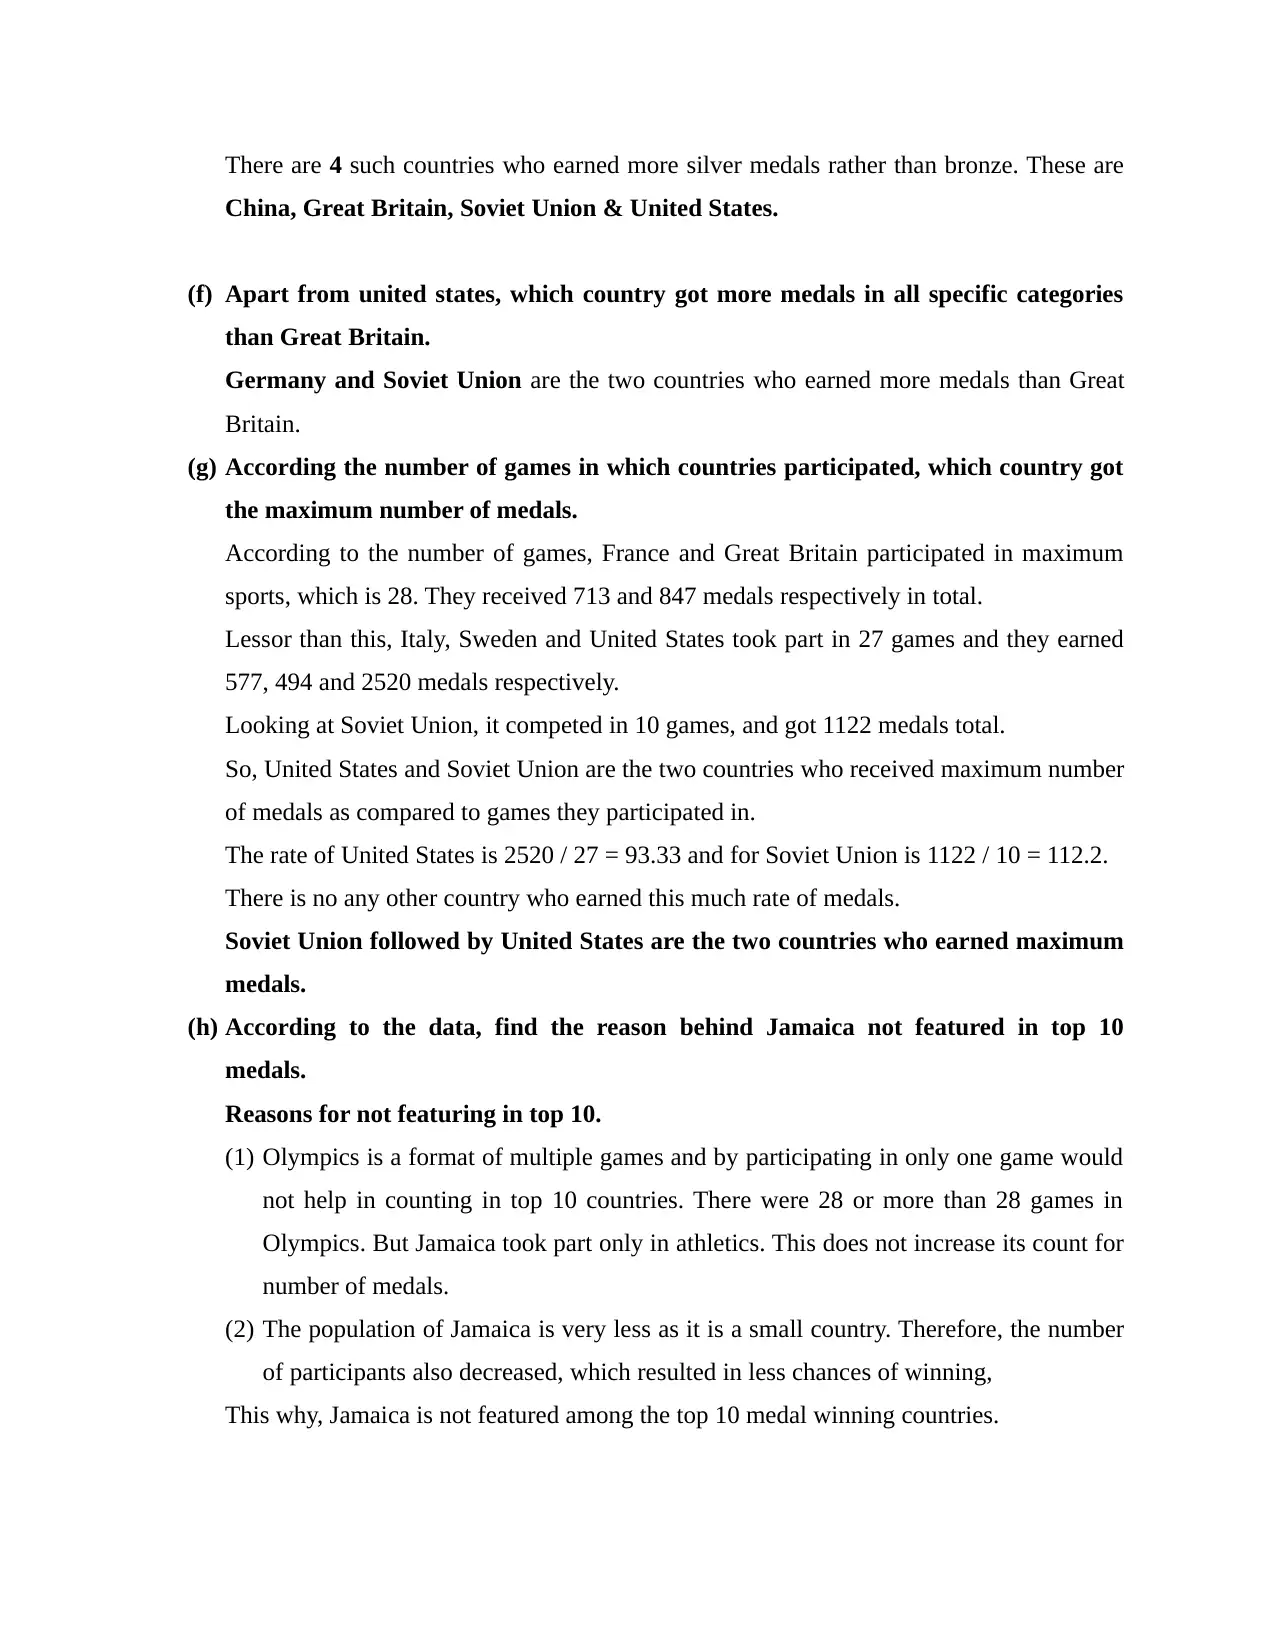
(f) Apart from united states, which country got more medals in all specific categories
than Great Britain.
Germany and Soviet Union are the two countries who earned more medals than Great
Britain.
(g) According the number of games in which countries participated, which country got
the maximum number of medals.
According to the number of games, France and Great Britain participated in maximum
sports, which is 28. They received 713 and 847 medals respectively in total.
Lessor than this, Italy, Sweden and United States took part in 27 games and they earned
577, 494 and 2520 medals respectively.
Looking at Soviet Union, it competed in 10 games, and got 1122 medals total.
So, United States and Soviet Union are the two countries who received maximum number
of medals as compared to games they participated in.
The rate of United States is 2520 / 27 = 93.33 and for Soviet Union is 1122 / 10 = 112.2.
There is no any other country who earned this much rate of medals.
Soviet Union followed by United States are the two countries who earned maximum
medals.
(h) According to the data, find the reason behind Jamaica not featured in top 10
medals.
Reasons for not featuring in top 10.
(1) Olympics is a format of multiple games and by participating in only one game would
not help in counting in top 10 countries. There were 28 or more than 28 games in
Olympics. But Jamaica took part only in athletics. This does not increase its count for
number of medals.
(2) The population of Jamaica is very less as it is a small country. Therefore, the number
of participants also decreased, which resulted in less chances of winning,
This why, Jamaica is not featured among the top 10 medal winning countries.
China, Great Britain, Soviet Union & United States.
(f) Apart from united states, which country got more medals in all specific categories
than Great Britain.
Germany and Soviet Union are the two countries who earned more medals than Great
Britain.
(g) According the number of games in which countries participated, which country got
the maximum number of medals.
According to the number of games, France and Great Britain participated in maximum
sports, which is 28. They received 713 and 847 medals respectively in total.
Lessor than this, Italy, Sweden and United States took part in 27 games and they earned
577, 494 and 2520 medals respectively.
Looking at Soviet Union, it competed in 10 games, and got 1122 medals total.
So, United States and Soviet Union are the two countries who received maximum number
of medals as compared to games they participated in.
The rate of United States is 2520 / 27 = 93.33 and for Soviet Union is 1122 / 10 = 112.2.
There is no any other country who earned this much rate of medals.
Soviet Union followed by United States are the two countries who earned maximum
medals.
(h) According to the data, find the reason behind Jamaica not featured in top 10
medals.
Reasons for not featuring in top 10.
(1) Olympics is a format of multiple games and by participating in only one game would
not help in counting in top 10 countries. There were 28 or more than 28 games in
Olympics. But Jamaica took part only in athletics. This does not increase its count for
number of medals.
(2) The population of Jamaica is very less as it is a small country. Therefore, the number
of participants also decreased, which resulted in less chances of winning,
This why, Jamaica is not featured among the top 10 medal winning countries.
⊘ This is a preview!⊘
Do you want full access?
Subscribe today to unlock all pages.
Trusted by 1+ million students worldwide
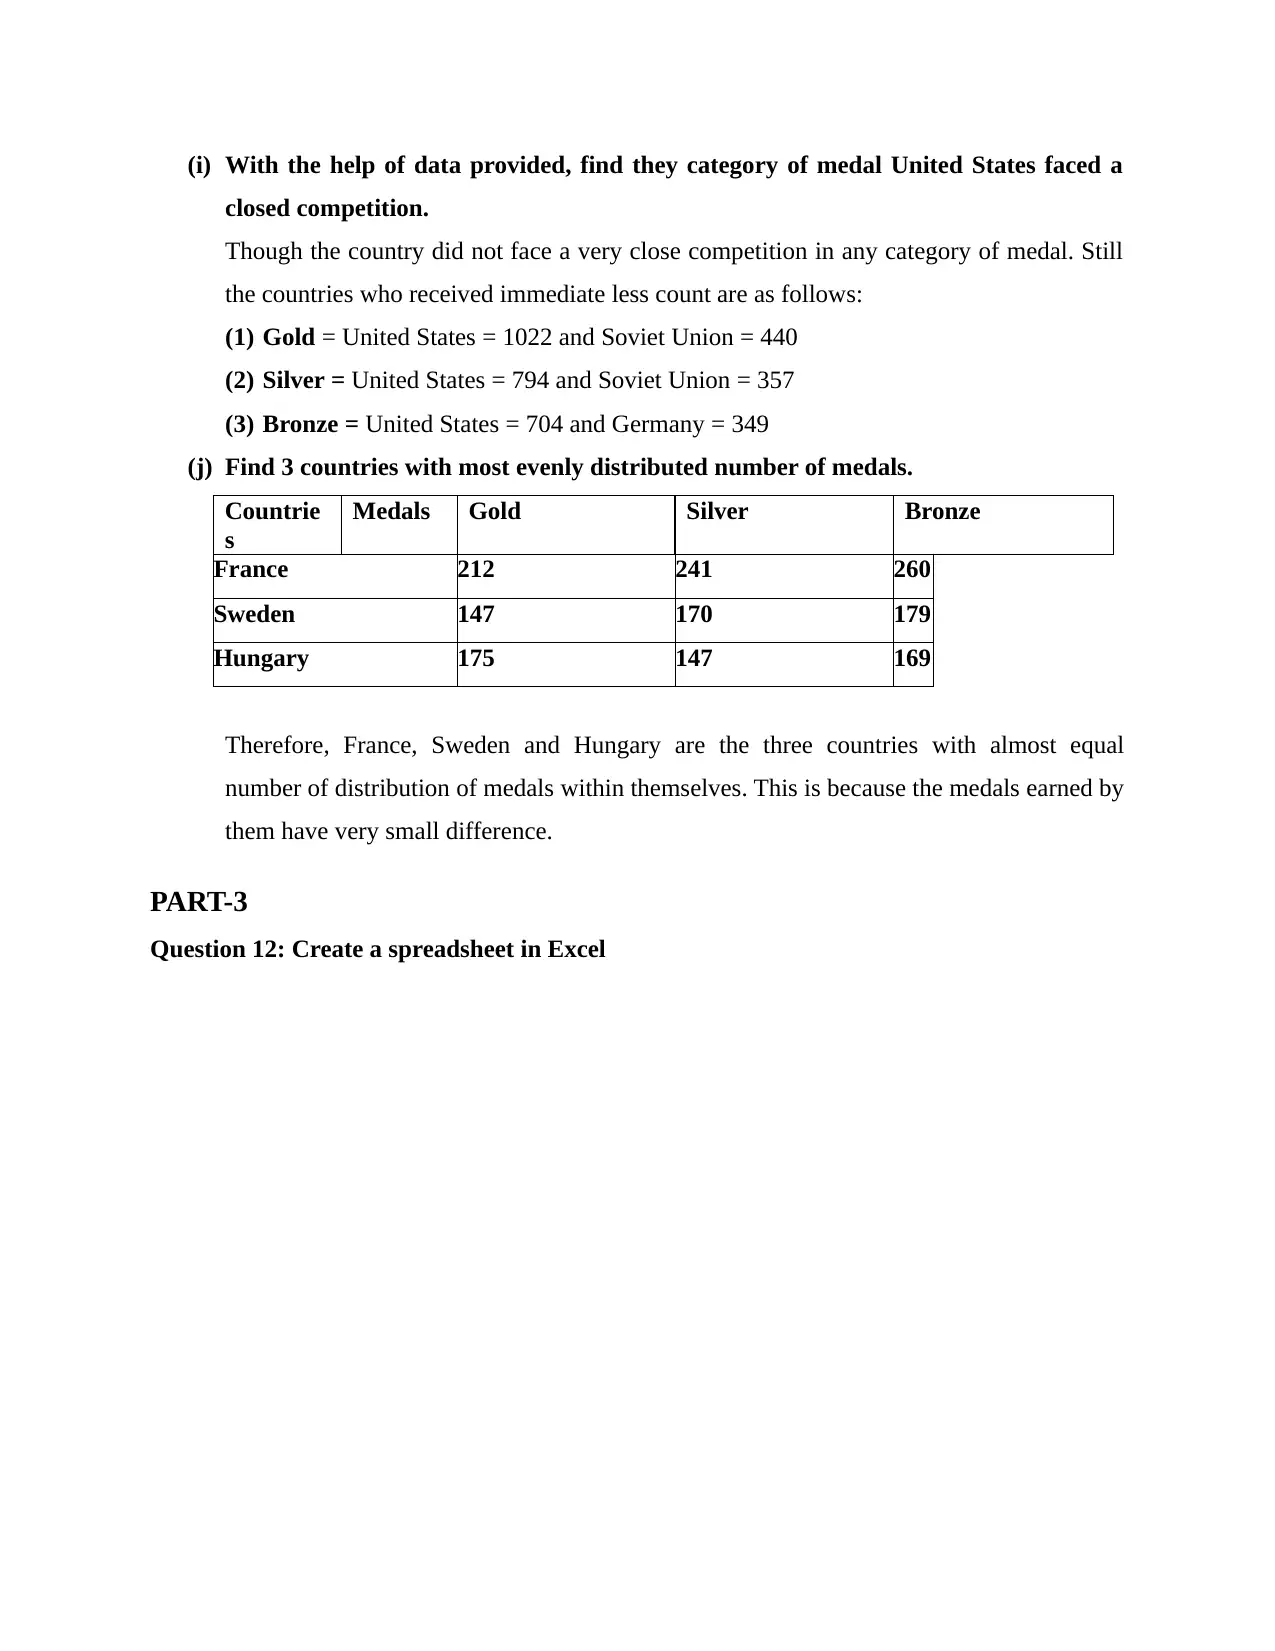
(i) With the help of data provided, find they category of medal United States faced a
closed competition.
Though the country did not face a very close competition in any category of medal. Still
the countries who received immediate less count are as follows:
(1) Gold = United States = 1022 and Soviet Union = 440
(2) Silver = United States = 794 and Soviet Union = 357
(3) Bronze = United States = 704 and Germany = 349
(j) Find 3 countries with most evenly distributed number of medals.
Countrie
s
Medals Gold Silver Bronze
France 212 241 260
Sweden 147 170 179
Hungary 175 147 169
Therefore, France, Sweden and Hungary are the three countries with almost equal
number of distribution of medals within themselves. This is because the medals earned by
them have very small difference.
PART-3
Question 12: Create a spreadsheet in Excel
Paraphrase This Document
Need a fresh take? Get an instant paraphrase of this document with our AI Paraphraser
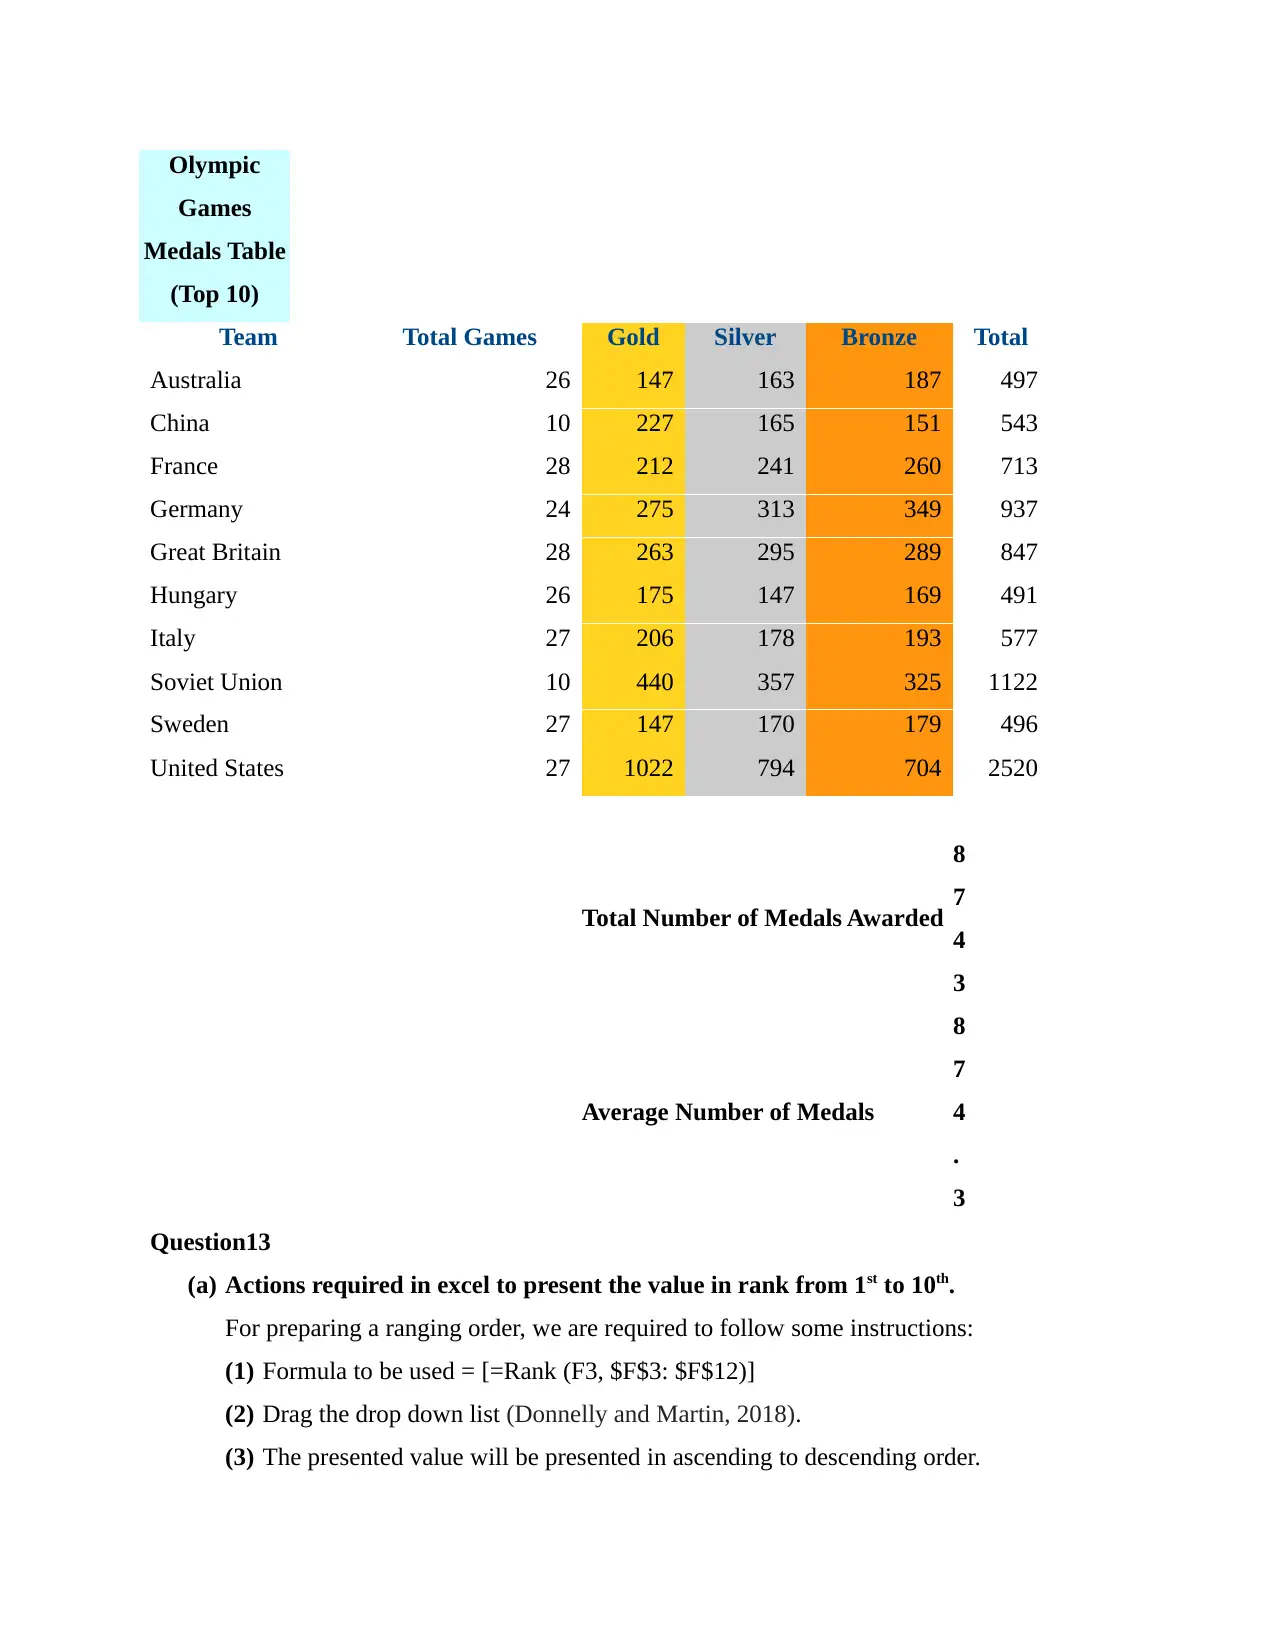
Olympic
Games
Medals Table
(Top 10)
Team Total Games Gold Silver Bronze Total
Australia 26 147 163 187 497
China 10 227 165 151 543
France 28 212 241 260 713
Germany 24 275 313 349 937
Great Britain 28 263 295 289 847
Hungary 26 175 147 169 491
Italy 27 206 178 193 577
Soviet Union 10 440 357 325 1122
Sweden 27 147 170 179 496
United States 27 1022 794 704 2520
Total Number of Medals Awarded
8
7
4
3
Average Number of Medals
8
7
4
.
3
Question13
(a) Actions required in excel to present the value in rank from 1st to 10th.
For preparing a ranging order, we are required to follow some instructions:
(1) Formula to be used = [=Rank (F3, $F$3: $F$12)]
(2) Drag the drop down list (Donnelly and Martin, 2018).
(3) The presented value will be presented in ascending to descending order.
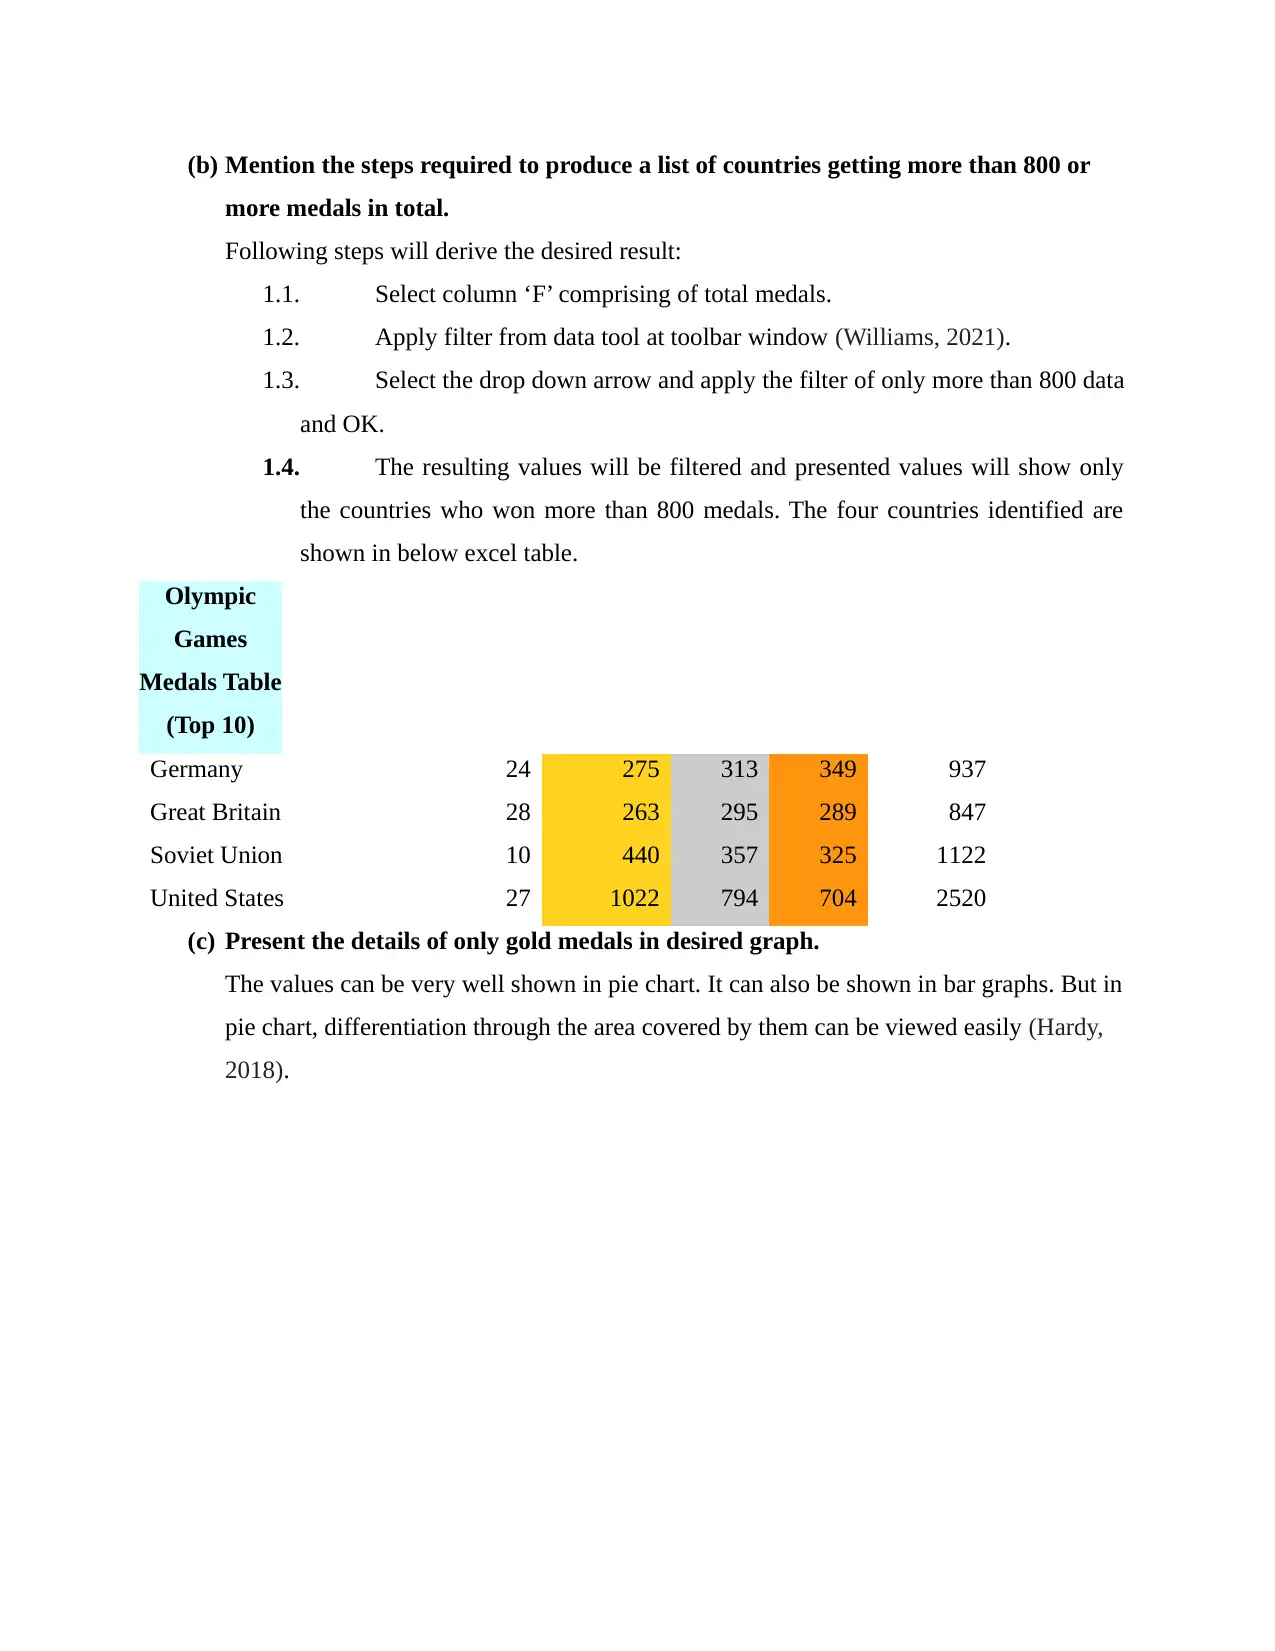
(b) Mention the steps required to produce a list of countries getting more than 800 or
more medals in total.
Following steps will derive the desired result:
1.1. Select column ‘F’ comprising of total medals.
1.2. Apply filter from data tool at toolbar window (Williams, 2021).
1.3. Select the drop down arrow and apply the filter of only more than 800 data
and OK.
1.4. The resulting values will be filtered and presented values will show only
the countries who won more than 800 medals. The four countries identified are
shown in below excel table.
Olympic
Games
Medals Table
(Top 10)
Germany 24 275 313 349 937
Great Britain 28 263 295 289 847
Soviet Union 10 440 357 325 1122
United States 27 1022 794 704 2520
(c) Present the details of only gold medals in desired graph.
The values can be very well shown in pie chart. It can also be shown in bar graphs. But in
pie chart, differentiation through the area covered by them can be viewed easily (Hardy,
2018).
⊘ This is a preview!⊘
Do you want full access?
Subscribe today to unlock all pages.
Trusted by 1+ million students worldwide
1 out of 18
Related Documents


Your All-in-One AI-Powered Toolkit for Academic Success.
+13062052269
info@desklib.com
Available 24*7 on WhatsApp / Email
![[object Object]](/_next/static/media/star-bottom.7253800d.svg)
Unlock your academic potential
Copyright © 2020–2026 A2Z Services. All Rights Reserved. Developed and managed by ZUCOL.