Numeracy, Data & IT Assignment: A Complete Step-by-Step Solution
VerifiedAdded on 2023/06/18
|22
|3447
|345
Homework Assignment
AI Summary
This document provides a detailed solution to a Numeracy, Data & IT assignment, covering topics such as basic numeracy calculations, data analysis, and IT applications. The numeracy section includes problems on fractions, percentages, and basic arithmetic operations. The data analysis section focuses on interpreting medal tables from the Olympic Games, calculating modes and ranges, and comparing country performances. The IT section demonstrates the use of spreadsheet software like Excel to rank countries based on medal counts and apply conditional formatting. Specific Excel formulas like RANK and IF are explained, along with the selection of appropriate chart types for data visualization. This comprehensive solution offers step-by-step guidance for students studying numeracy, data analysis, and IT skills.
NUMERACY, DATA & IT
Paraphrase This Document
Need a fresh take? Get an instant paraphrase of this document with our AI Paraphraser
Table of Contents
PART 1- USING NUMERACY......................................................................................................4
Question 1....................................................................................................................................4
Question 2....................................................................................................................................4
Question 3....................................................................................................................................4
b) For calculating the percentage of computing books:...................................................................4
Question 4....................................................................................................................................5
Question 5....................................................................................................................................5
Question 6....................................................................................................................................5
so the total saving = £300 - £210....................................................................................................6
b) The average saving per person ...................................................................................................6
Patty and her 2 siblings show that they are 3 people so,..................................................................6
Question 7....................................................................................................................................6
Question 8....................................................................................................................................6
Question 9....................................................................................................................................7
Question 10..................................................................................................................................7
PART 2 – USING DATA................................................................................................................7
Question 11..................................................................................................................................7
a)..................................................................................................................................................7
b)..................................................................................................................................................8
c)..................................................................................................................................................8
d)..................................................................................................................................................8
e)..................................................................................................................................................8
f)...................................................................................................................................................8
g)..................................................................................................................................................8
h)..................................................................................................................................................9
i)...................................................................................................................................................9
j)...................................................................................................................................................9
PART 3 – USING IT.....................................................................................................................10
Question 12................................................................................................................................10
Question 13................................................................................................................................10
a)................................................................................................................................................10
b)................................................................................................................................................11
c)................................................................................................................................................12
d)................................................................................................................................................12
e)................................................................................................................................................13
Question 14................................................................................................................................13
a)................................................................................................................................................13
b)................................................................................................................................................14
c)................................................................................................................................................14
d)................................................................................................................................................15
Question 15................................................................................................................................16
a)................................................................................................................................................16
b)................................................................................................................................................16
c)................................................................................................................................................17
d)................................................................................................................................................17
Question 16................................................................................................................................18
a)................................................................................................................................................18
b)................................................................................................................................................18
REFERENCES................................................................................................................................1
You're viewing a preview
Unlock full access by subscribing today!
PART 1- USING NUMERACY
Question 1
a) Numerator: Numerator is a Latin word that means number. Out of a whole fraction it
indicates the number of parts to be considered. Fraction is representing in the form of x/y in that
fraction the number on top (x) is numerator (Reder, Gauly and Lechner, 2020).
b) Denominator: It is the part of fraction that represent in below the line of a fraction. It works
as the divisor of the numerator that represent the equal parts of the number in an item. In fraction
x/y the number on below (y) is denominator.
Question 2
The simplest form of 24/40 is 3/5
& 18/42 is 3/7
Steps to simplifying fractions
First step is find the HCF (highest common factor) of numerator & denominator. In the above
question HCF of 24 and 40 is 8 or 18 and 42 is 6.
Divide both the numerator & denominator by the HCF.
24/40 is divided by 8 or 18/42 is divided by 6.
After completing of the above two steps fraction is reduced at its lowest term.
24/40 is reduced at 3/5 or 18/42 is reduced at 3/7.
Question 3
a) Equivalent fractions are the two or more fractions that after simplified give same value. In this
process simplification is done of both numerator and denominator with the same value.
So the fractions are converted into equivalent fractions with a denominator of 12 are described
below:
2/3 * 4/4 = 8/12
3/4 * 3/3 = 9/12
5/6 * 2/2 = 10/12
b) For calculating the percentage of computing books:
First calculate the remaining books
= 60000 – 48000 (14000, 22000, 12000)
Paraphrase This Document
Need a fresh take? Get an instant paraphrase of this document with our AI Paraphraser
= 12000 (remaining books)
After calculating of remaining books, 2/3 of remaining books is computing books
= 12000 *2/3 = 8000
Last step is convert the computing books into part of total percentage of library book
= 8000/60000 * 100 = 13.33%
Question 4
Given:
No. of pairs of shoes bought by Liz = 2
She gave three crisp to attendant = £50 notes
Total money given by Liz = £50*3 = £150
Money she was returned = £10.50
Calculate the price of each pair of running shoes are as described below:
price of two pairs of shoes = total money given by Liz – money she returned
= £150 - £10.50 = £139.50
price of one pair of shoes = £139.50/2
= £69.75
Question 5
a) 240.50 * 19.54 = 4699.37
b) 52100 as a power of 10
Like any number written in scientific notation, 52100 has a coefficient of 5.21 multiplied by the
10000 expressed by the base 10 and index 4:
52100 = 5.21×10000
= 5.21 * 10^4
Question 6
a) Given,
Offer 30% discount
Patty and her 2 siblings pay total amount of £210.
Calculate the total savings
Patty had a discount of 30% means that they paid 70%
100% (total %) - 30% (discount) = 70% (paid)
To find the total saving, they need to know the total cost from the 70% payment made
70% = £210
1% = 210/70 = £3
if 1% = £3, then 100% will be £300
so the total saving = £300 - £210
= £90
b) The average saving per person
Patty and her 2 siblings show that they are 3 people so,
If the 3 people saved £90
average of one person is
= 90/3 = £30
Question 7
a) 3/4 - 7/9 + 2/3
Simplify this,
3/4 = 0.75
7/9 = 0.78
2/3 = 0.66
= 0.75 – 0.78 + (0.66)
= 0.63
b) The largest number is 0.1 from the 0.1, 0.02, 0.003, 0.0004, 0.00005.
Question 8
Given,
90 men & 60 women
3/5 of the total people said yes
3/10 of the women said yes
Calculation of the percentage of the men said no
First calculate the total persons said yes
Total person = 90 + 60 = 150
3/5 total people said yes
3/5 of 150 = 90
From 90 total persons 3/10 women said yes
Means 3/10 of 90 = 27 are women
You're viewing a preview
Unlock full access by subscribing today!
Then 90 – 27 = 63 men said yes
For men said no
= 90 (total men) – 63 (said yes)
= 27 men said no.
Question 9
Time of conference in Birmingham is at 10:30 am.
So, she has to leave at 08:00 am from her home
Explained this answer below:
Time to get Euston Rail station = 1 hour, so she will be station at 09.00 am.
Birmingham trains run at the following times:
5 minutes past the hour, 25 minutes past the hour and 45 minutes past the hour i.e. she will get
her train at 9.05 am.
The train journey from Euston to Birmingham is 1 hour & 10 minutes so she will reach at 10.15
am.
The meeting venue in Birmingham is a 5-minute walking distance from the station so she will
reach the venue at 10.20 am.
She will reach exactly 10 minutes before the meeting.
Question 10
Weight of a Shredded wheat is 0.35 kg
A box of Weetabix weights is 9/25 kg i.e. 0.36 kg
Weetabix box is heavier by 0.01 kg.
PART 2 – USING DATA
Question 11
a)
On the basis of medal table for summer Olympic Games, it is analysed that Hungary is a country
having the lowest number of overall medals out the ten countries. The total medals awarded by
Hungary is 491.
Paraphrase This Document
Need a fresh take? Get an instant paraphrase of this document with our AI Paraphraser
b)
On the basis of medals table, it is identified that China and Soviet Union is the countries which
has competed in the least number of games. The total games competed by China and Soviet
Union is 10.
c)
Mode is basically a value that appears most of the time in the whole data set which means the
value which is repeated maximum time is considered as mode. In the given table, 27 is the
number of matches which is repeating thrice thus considered as mode (Yamashita and et.l.,
2020). So, here the mode is 27.
d)
The range of the given data is basically difference between the maximum and minimum value.
So, the range between the gold medals awarded to the ten countries are 1022 – 147 = 875.
e)
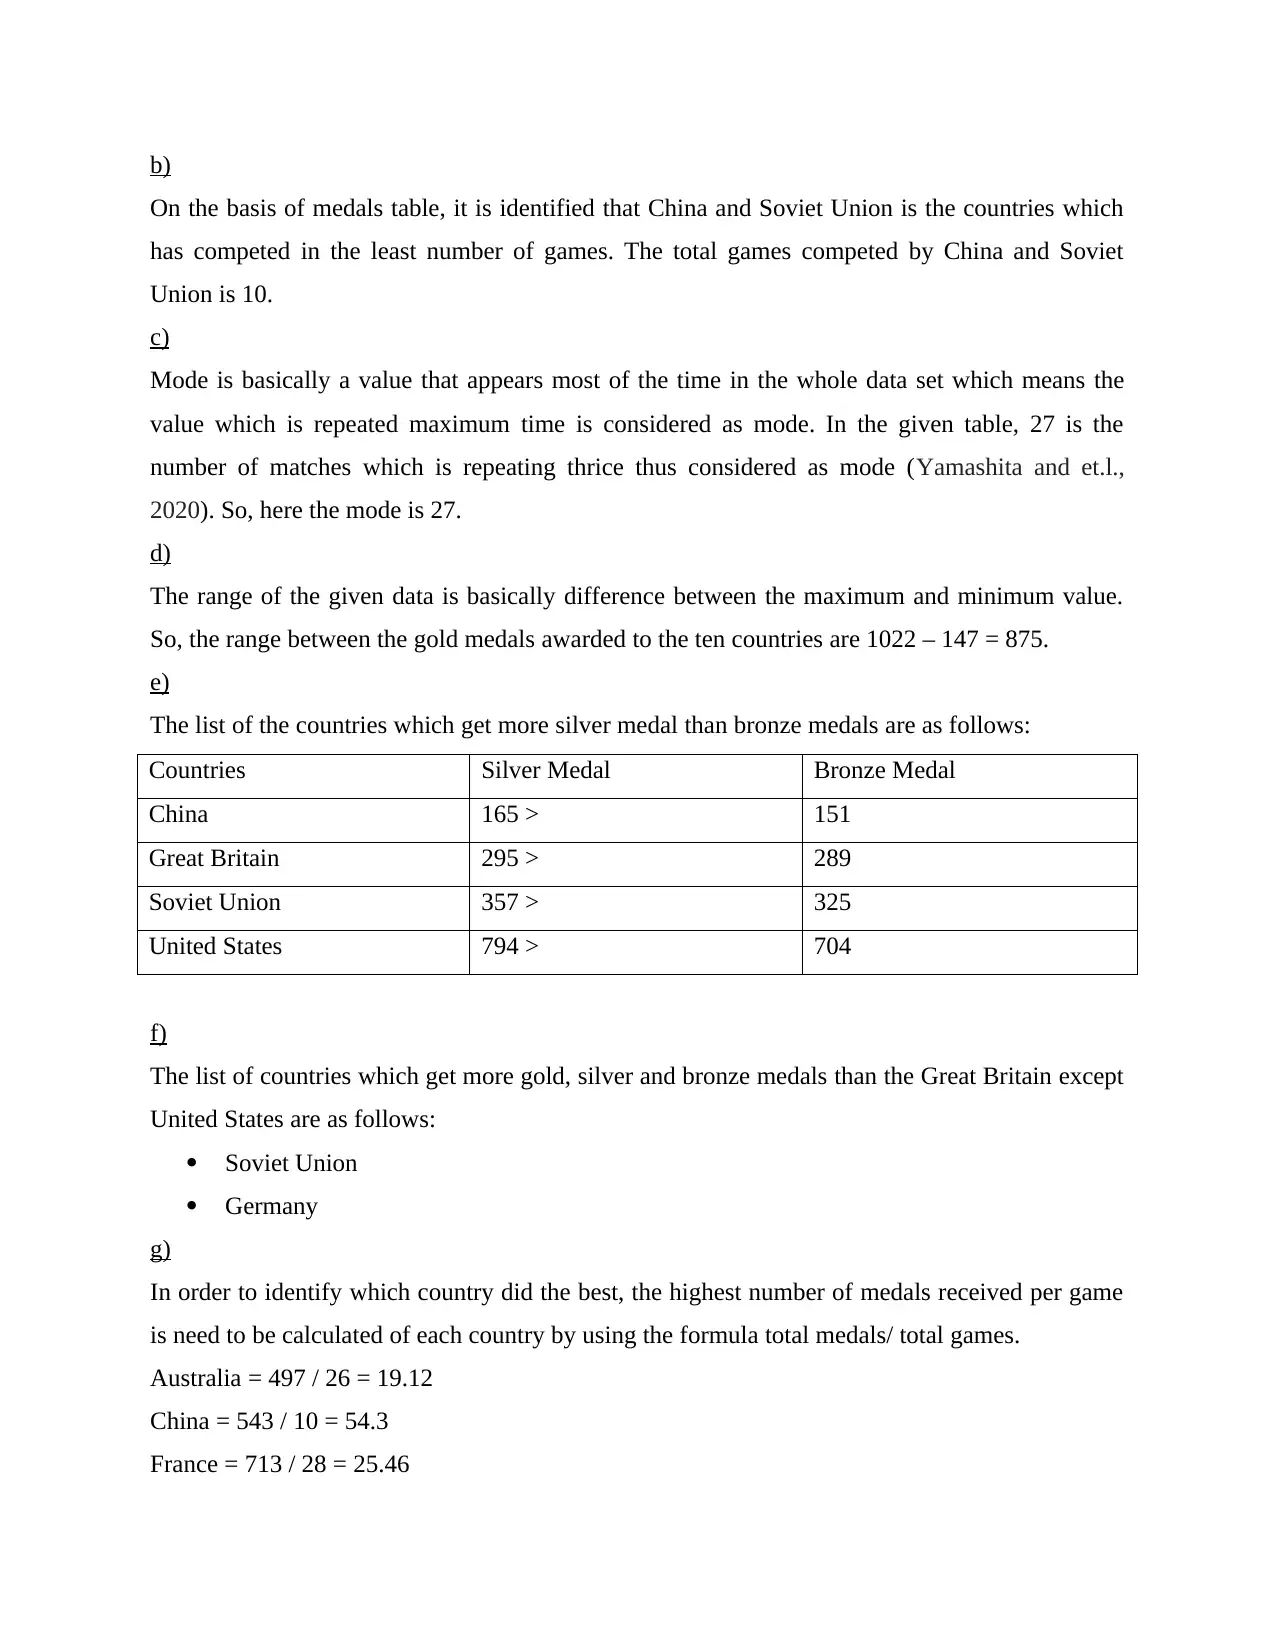
The list of the countries which get more silver medal than bronze medals are as follows:
Countries Silver Medal Bronze Medal
China 165 > 151
Great Britain 295 > 289
Soviet Union 357 > 325
United States 794 > 704
f)
The list of countries which get more gold, silver and bronze medals than the Great Britain except
United States are as follows:
Soviet Union
Germany
g)
In order to identify which country did the best, the highest number of medals received per game
is need to be calculated of each country by using the formula total medals/ total games.
Australia = 497 / 26 = 19.12
China = 543 / 10 = 54.3
France = 713 / 28 = 25.46
On the basis of medals table, it is identified that China and Soviet Union is the countries which
has competed in the least number of games. The total games competed by China and Soviet
Union is 10.
c)
Mode is basically a value that appears most of the time in the whole data set which means the
value which is repeated maximum time is considered as mode. In the given table, 27 is the
number of matches which is repeating thrice thus considered as mode (Yamashita and et.l.,
2020). So, here the mode is 27.
d)
The range of the given data is basically difference between the maximum and minimum value.
So, the range between the gold medals awarded to the ten countries are 1022 – 147 = 875.
e)
The list of the countries which get more silver medal than bronze medals are as follows:
Countries Silver Medal Bronze Medal
China 165 > 151
Great Britain 295 > 289
Soviet Union 357 > 325
United States 794 > 704
f)
The list of countries which get more gold, silver and bronze medals than the Great Britain except
United States are as follows:
Soviet Union
Germany
g)
In order to identify which country did the best, the highest number of medals received per game
is need to be calculated of each country by using the formula total medals/ total games.
Australia = 497 / 26 = 19.12
China = 543 / 10 = 54.3
France = 713 / 28 = 25.46
Germany = 937 / 24 = 39
Great Britain = 847 / 28 = 30.25
Hungary = 491 / 26 = 18.88
Italy = 577 / 27 = 21.37
Soviet Union = 1122 / 10 = 112.2
Sweden = 494 / 27 = 18.296
United States = 2520 / 27 = 93.33
On the basis of above calculation, it is identified that Soviet Union is a country which is
performing best as its get more medal per game.
h)
Jamaica is a country which perform best in the athlete but the reason they do not feature and
participate in the event are as follows:
First, they are not large enough as compared to other ten countries to compete with them
besides having the best performance in athlete.
Another reason for this is that the total population of Jamaica is lower than the other 10
countries, and they are not able to provide trainings to small population regarding all
events.
i)
In order to determine the category of medal in which United States far outperformed its closet
competitors i.e., Soviet Union, the following calculation need to be performed. This includes the
formula of number of medal category (gold, silver and bronze) of Soviet union/ number of
medals category of United States (Patel, Baker and Scherer, 2019).
Gold = 440/ 1122* 100 = 43.05%
Silver = 357/790×100 = 44.96%
Bronze = 325/704* 100 = 46.16%
The above calculation indicate the 43.05% which state that US has really performed well in order
to get gold medal.
j)
In order to identify the three countries having even distribution as compared to all other countries
the following formula is used such as maximum number of given category of medal in each
column/ minimum number of given category of medal in each column.
You're viewing a preview
Unlock full access by subscribing today!
For example, in case of Australia the maximum count for Bronze is 187 and minimum count for
gold is 147 which became 187 – 147 = 40.
China = 227 – 151 = 76
France = 260 – 212 = 48
Germany = 349 – 275 = 74
Great Britain = 295 – 263 = 32
Hungary = 175 – 147 = 28
Italy = 206 – 178 = 28
Soviet Union = 440 – 325 = 115
Sweden = 179 – 147 = 32
United States = 1022 – 704 = 318.
After the calculation the three countries is Hungary, Italy, Germany and Sweden as per
ascending order.
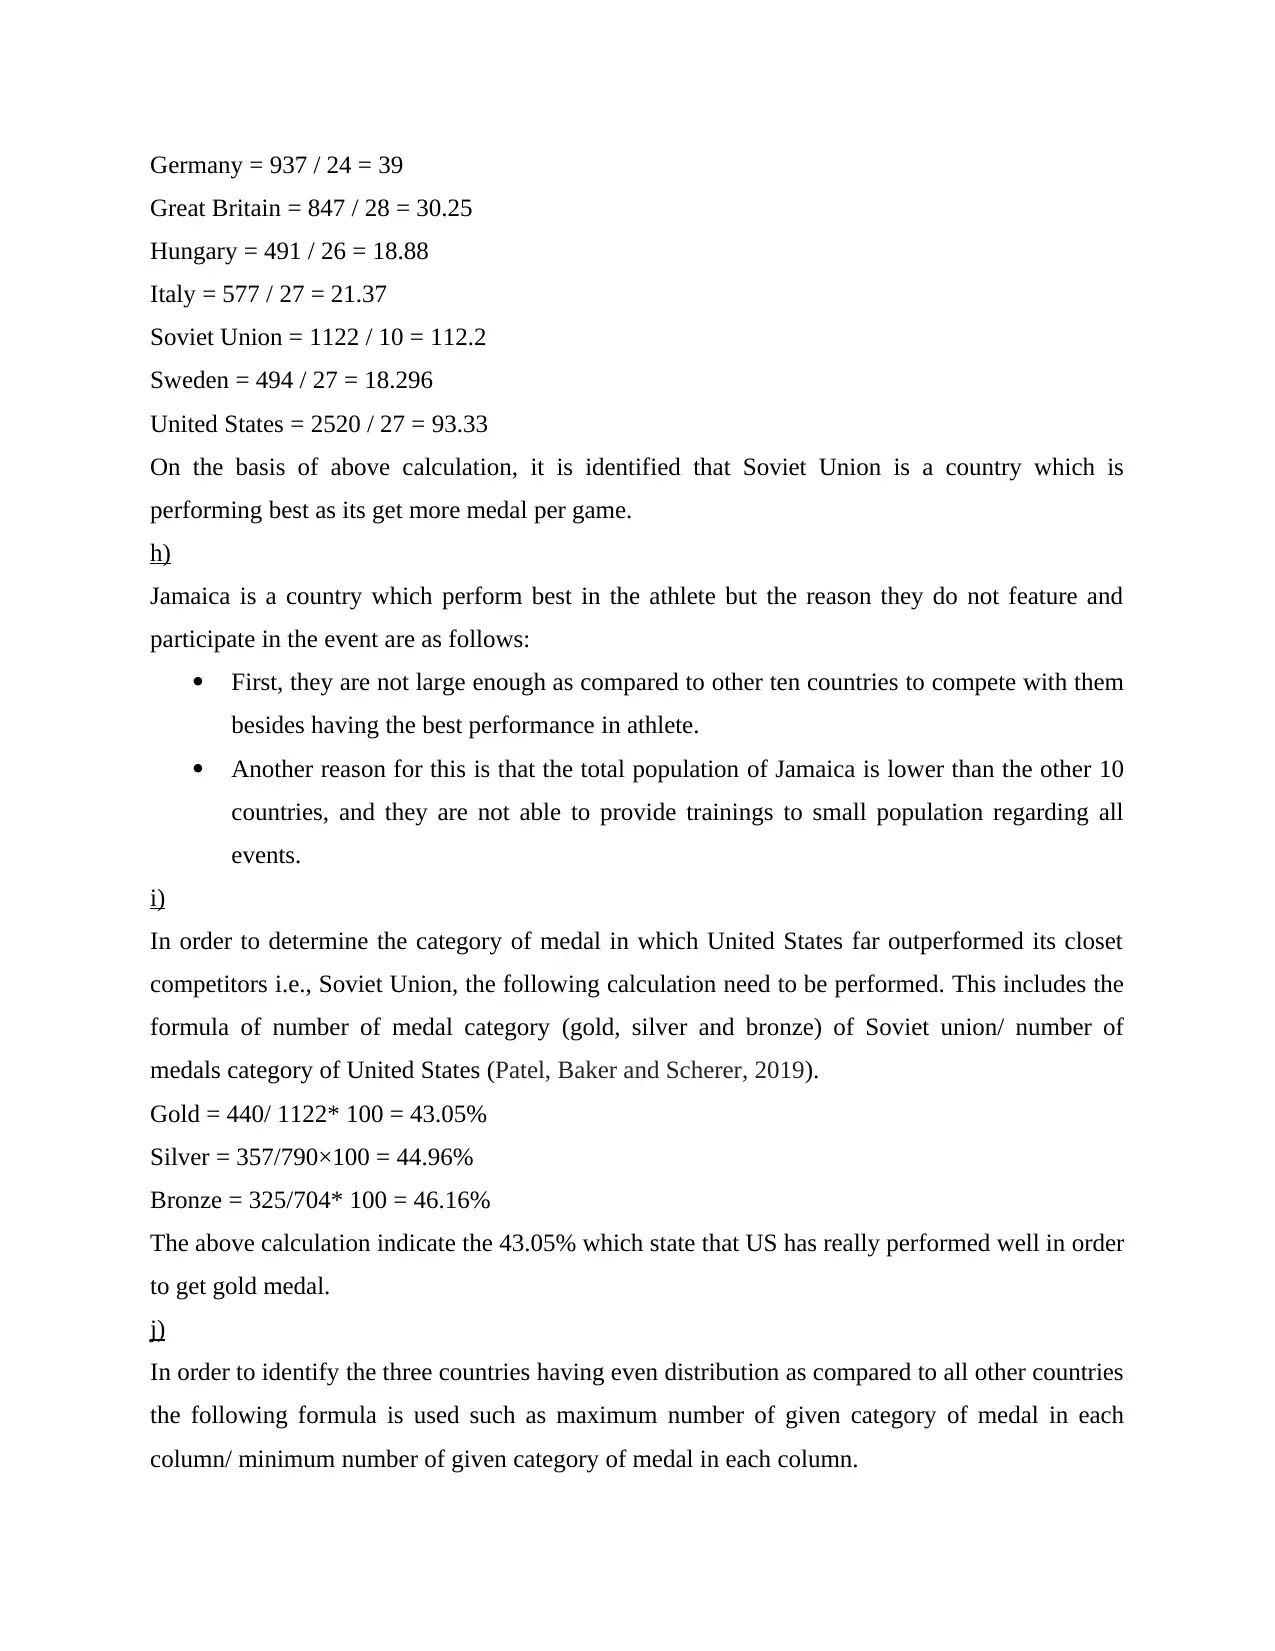
PART 3 – USING IT
Question 12
Covered in spreadsheet.
gold is 147 which became 187 – 147 = 40.
China = 227 – 151 = 76
France = 260 – 212 = 48
Germany = 349 – 275 = 74
Great Britain = 295 – 263 = 32
Hungary = 175 – 147 = 28
Italy = 206 – 178 = 28
Soviet Union = 440 – 325 = 115
Sweden = 179 – 147 = 32
United States = 1022 – 704 = 318.
After the calculation the three countries is Hungary, Italy, Germany and Sweden as per
ascending order.
PART 3 – USING IT
Question 12
Covered in spreadsheet.
Paraphrase This Document
Need a fresh take? Get an instant paraphrase of this document with our AI Paraphraser
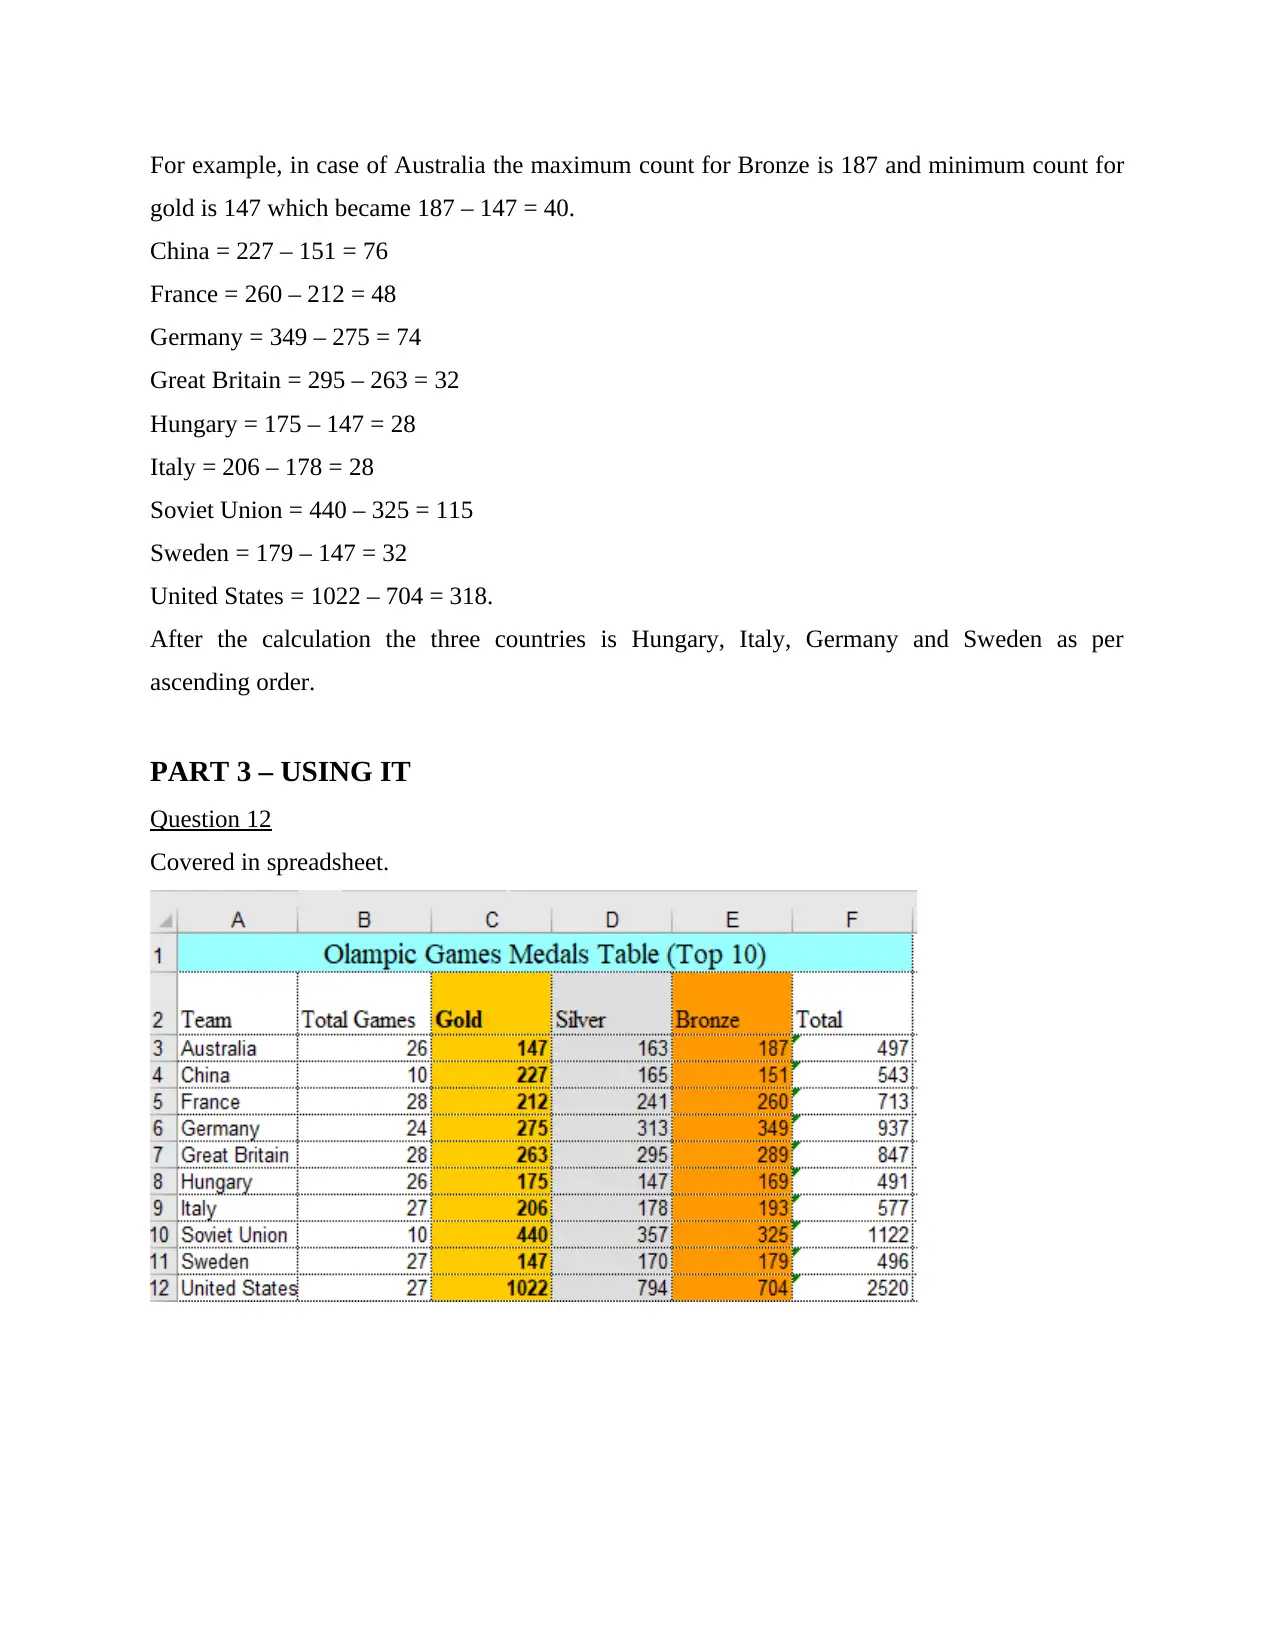
Question 13
a)
In order to rank the countries from 1st to 10th, excel formula of rank is used which is as follows
=Rank(number, ref, [order])
The steps include:
Step1: Identification of value of column and row which need to rank. For example, in this
question rank will be done on basis of total number of medals of each country.
Step2: After that the formula of rank is need to be put in the formula box.
Step3: Enter button need to be pressed after putting all the data as per the formula and which
result into rank (Spithourakis and Riedel, 2018).
Step4: At end drop and drag the rank of each country to calculate all countries rank using the
same formula.
For example, this question is done in excel as follows:
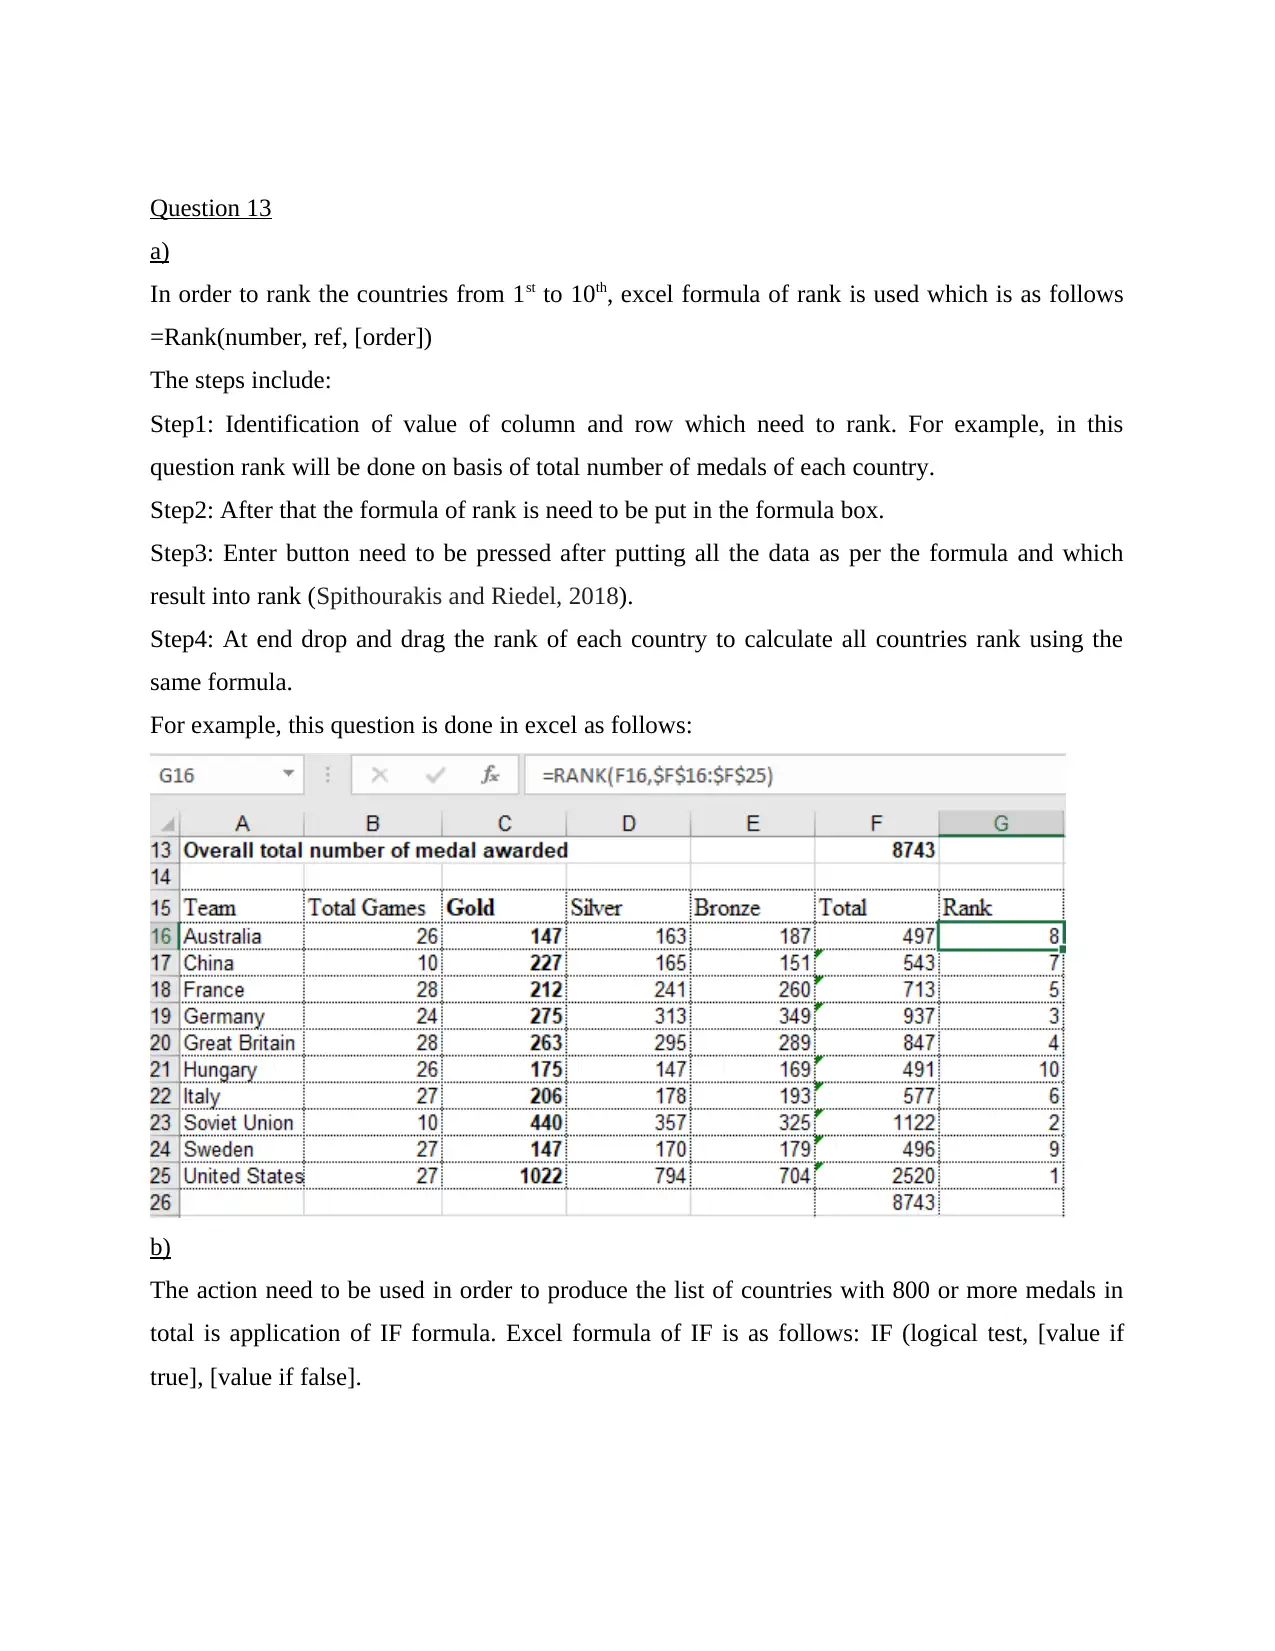
b)
The action need to be used in order to produce the list of countries with 800 or more medals in
total is application of IF formula. Excel formula of IF is as follows: IF (logical test, [value if
true], [value if false].
a)
In order to rank the countries from 1st to 10th, excel formula of rank is used which is as follows
=Rank(number, ref, [order])
The steps include:
Step1: Identification of value of column and row which need to rank. For example, in this
question rank will be done on basis of total number of medals of each country.
Step2: After that the formula of rank is need to be put in the formula box.
Step3: Enter button need to be pressed after putting all the data as per the formula and which
result into rank (Spithourakis and Riedel, 2018).
Step4: At end drop and drag the rank of each country to calculate all countries rank using the
same formula.
For example, this question is done in excel as follows:
b)
The action need to be used in order to produce the list of countries with 800 or more medals in
total is application of IF formula. Excel formula of IF is as follows: IF (logical test, [value if
true], [value if false].
By applying this formula, it is identified that there are four countries name Germany, Great
Britain, Soviet Union and United States which have 800 or more total number of medals. The
application of formula are as follows:
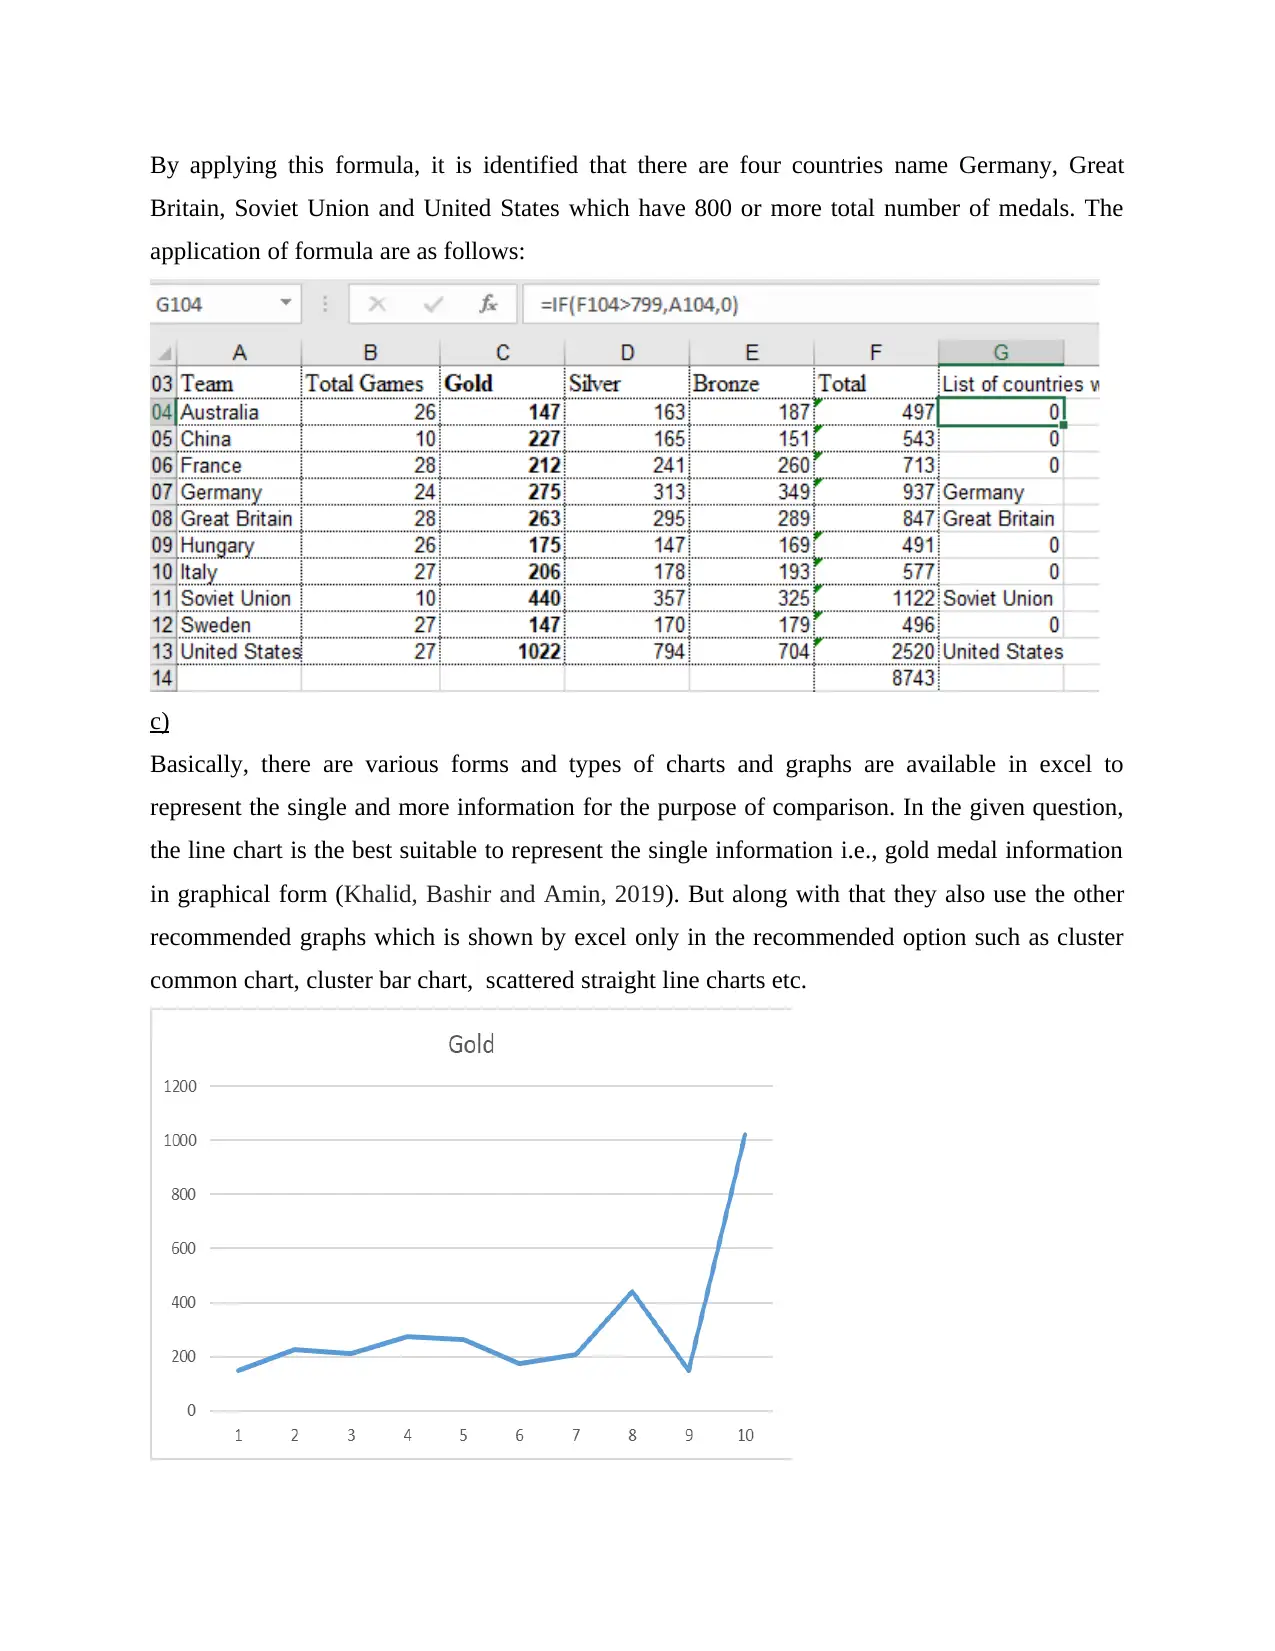
c)
Basically, there are various forms and types of charts and graphs are available in excel to
represent the single and more information for the purpose of comparison. In the given question,
the line chart is the best suitable to represent the single information i.e., gold medal information
in graphical form (Khalid, Bashir and Amin, 2019). But along with that they also use the other
recommended graphs which is shown by excel only in the recommended option such as cluster
common chart, cluster bar chart, scattered straight line charts etc.
Britain, Soviet Union and United States which have 800 or more total number of medals. The
application of formula are as follows:
c)
Basically, there are various forms and types of charts and graphs are available in excel to
represent the single and more information for the purpose of comparison. In the given question,
the line chart is the best suitable to represent the single information i.e., gold medal information
in graphical form (Khalid, Bashir and Amin, 2019). But along with that they also use the other
recommended graphs which is shown by excel only in the recommended option such as cluster
common chart, cluster bar chart, scattered straight line charts etc.
You're viewing a preview
Unlock full access by subscribing today!
d)
The replication and duplication of data is a way with the help of which the movement of data at a
single point of time. This is used when it is not possible to calculate value of all the column by
inserting formula at every point. For example, in order to calculate rank of Australia the formula
of rank is used and inserted (Dowding and et.al., 2017). Now to calculate the rank of remaining 9
countries the replication and duplication method is used such as drop and drag method.
e)
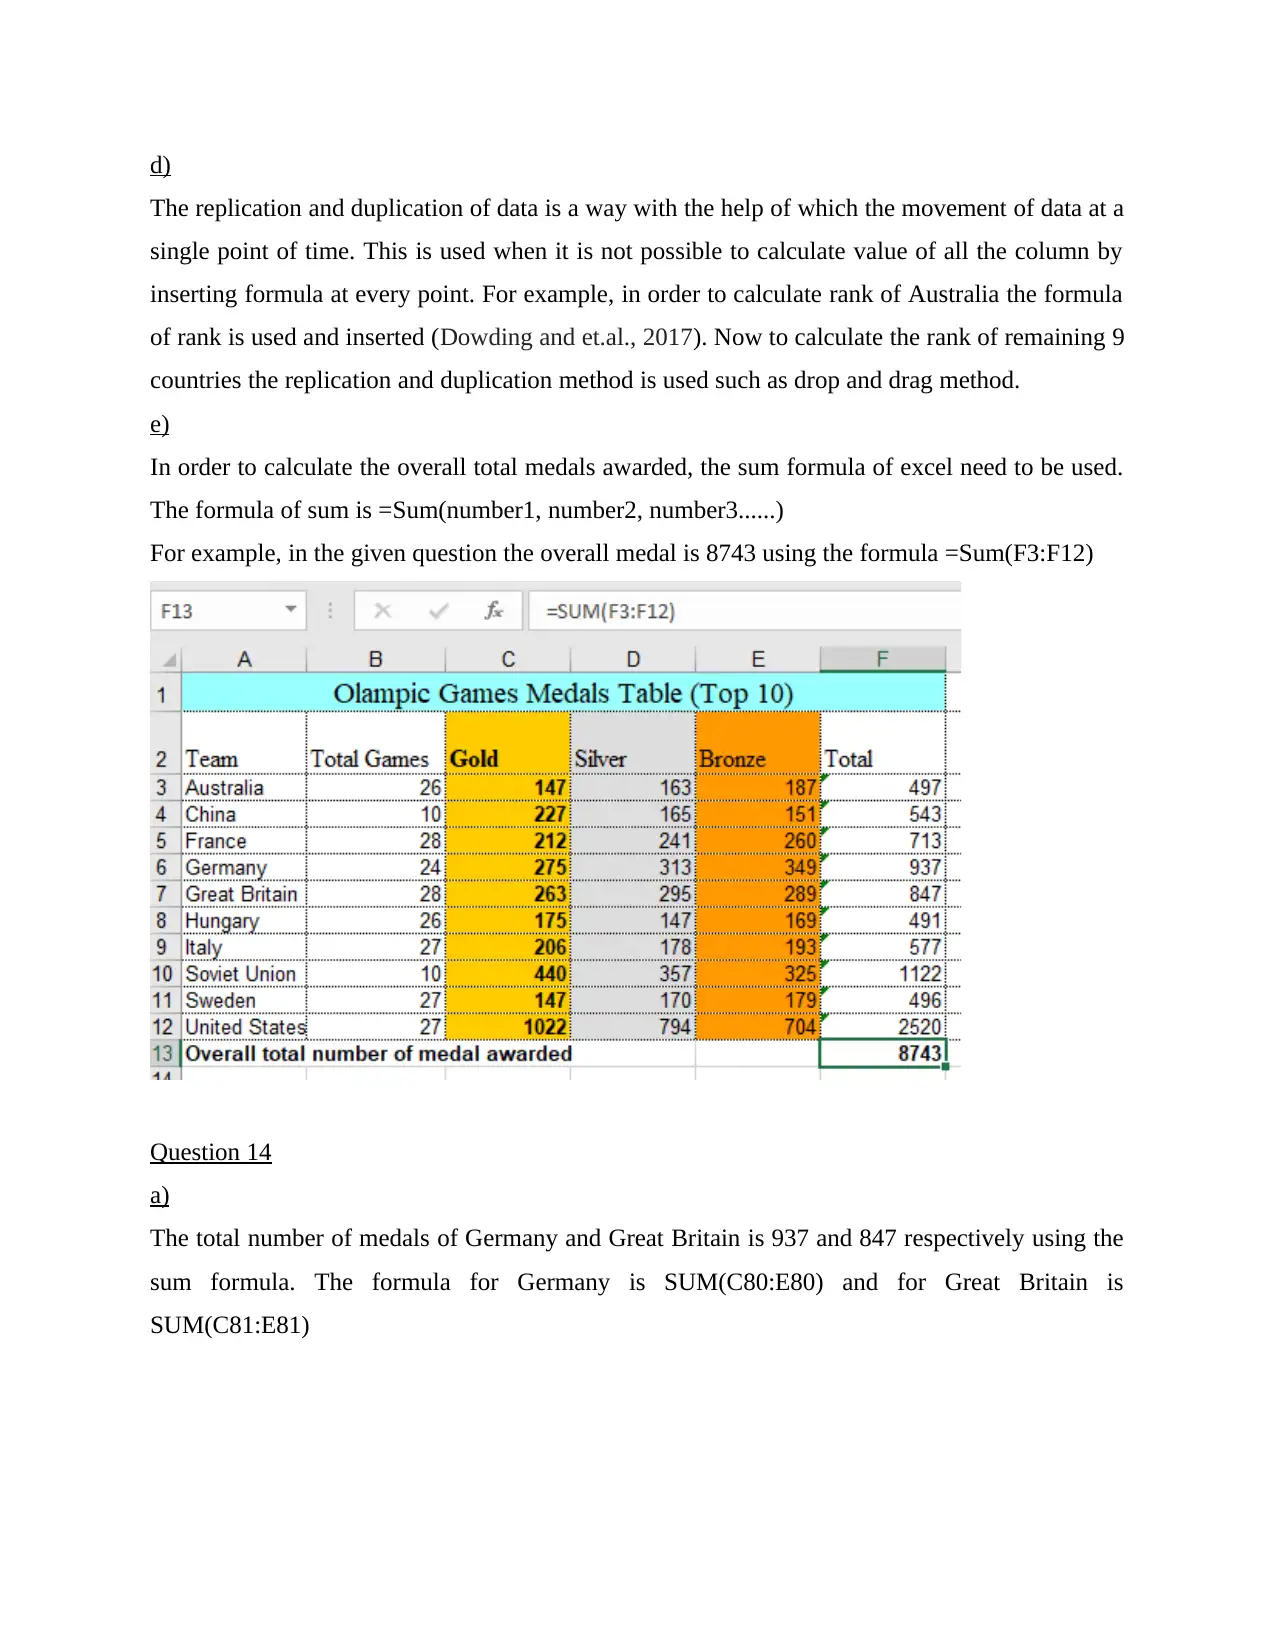
In order to calculate the overall total medals awarded, the sum formula of excel need to be used.
The formula of sum is =Sum(number1, number2, number3......)
For example, in the given question the overall medal is 8743 using the formula =Sum(F3:F12)
Question 14
a)
The total number of medals of Germany and Great Britain is 937 and 847 respectively using the
sum formula. The formula for Germany is SUM(C80:E80) and for Great Britain is
SUM(C81:E81)
The replication and duplication of data is a way with the help of which the movement of data at a
single point of time. This is used when it is not possible to calculate value of all the column by
inserting formula at every point. For example, in order to calculate rank of Australia the formula
of rank is used and inserted (Dowding and et.al., 2017). Now to calculate the rank of remaining 9
countries the replication and duplication method is used such as drop and drag method.
e)
In order to calculate the overall total medals awarded, the sum formula of excel need to be used.
The formula of sum is =Sum(number1, number2, number3......)
For example, in the given question the overall medal is 8743 using the formula =Sum(F3:F12)
Question 14
a)
The total number of medals of Germany and Great Britain is 937 and 847 respectively using the
sum formula. The formula for Germany is SUM(C80:E80) and for Great Britain is
SUM(C81:E81)
Paraphrase This Document
Need a fresh take? Get an instant paraphrase of this document with our AI Paraphraser
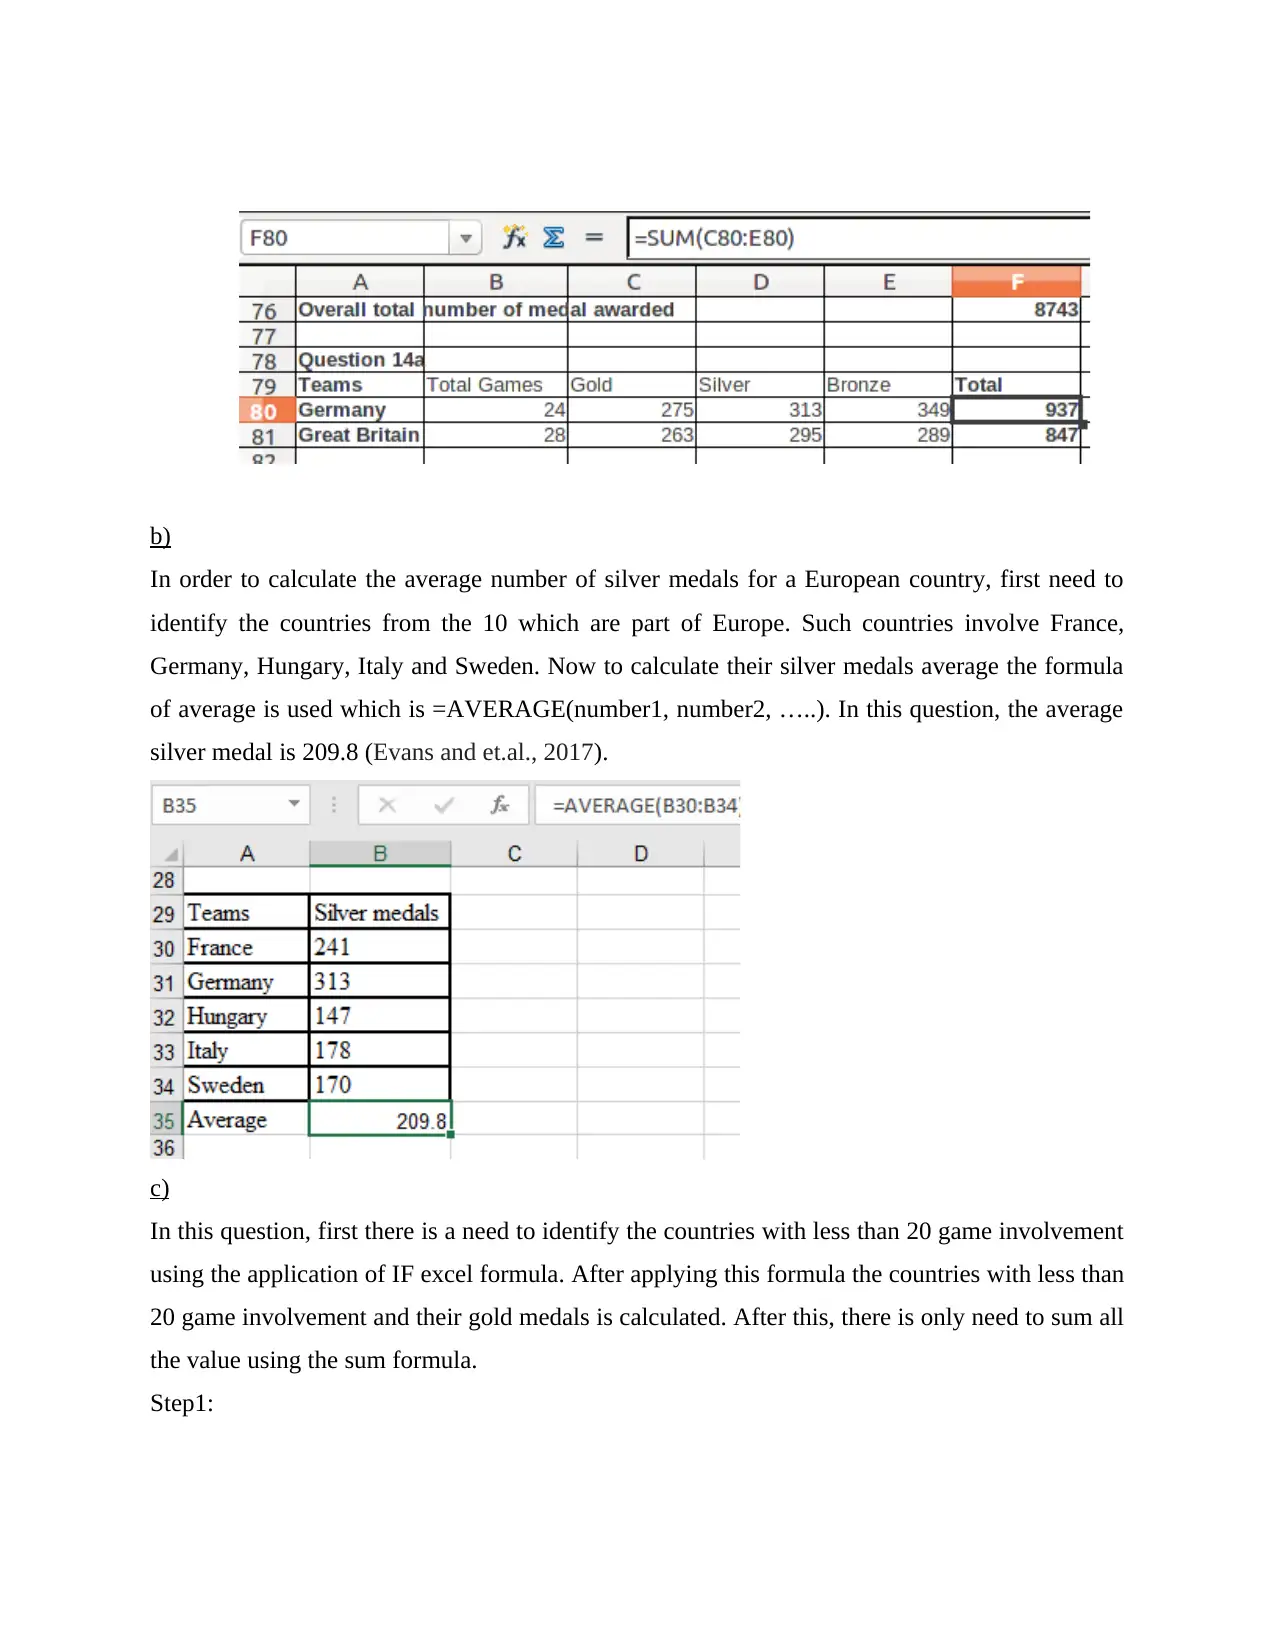
b)
In order to calculate the average number of silver medals for a European country, first need to
identify the countries from the 10 which are part of Europe. Such countries involve France,
Germany, Hungary, Italy and Sweden. Now to calculate their silver medals average the formula
of average is used which is =AVERAGE(number1, number2, …..). In this question, the average
silver medal is 209.8 (Evans and et.al., 2017).
c)
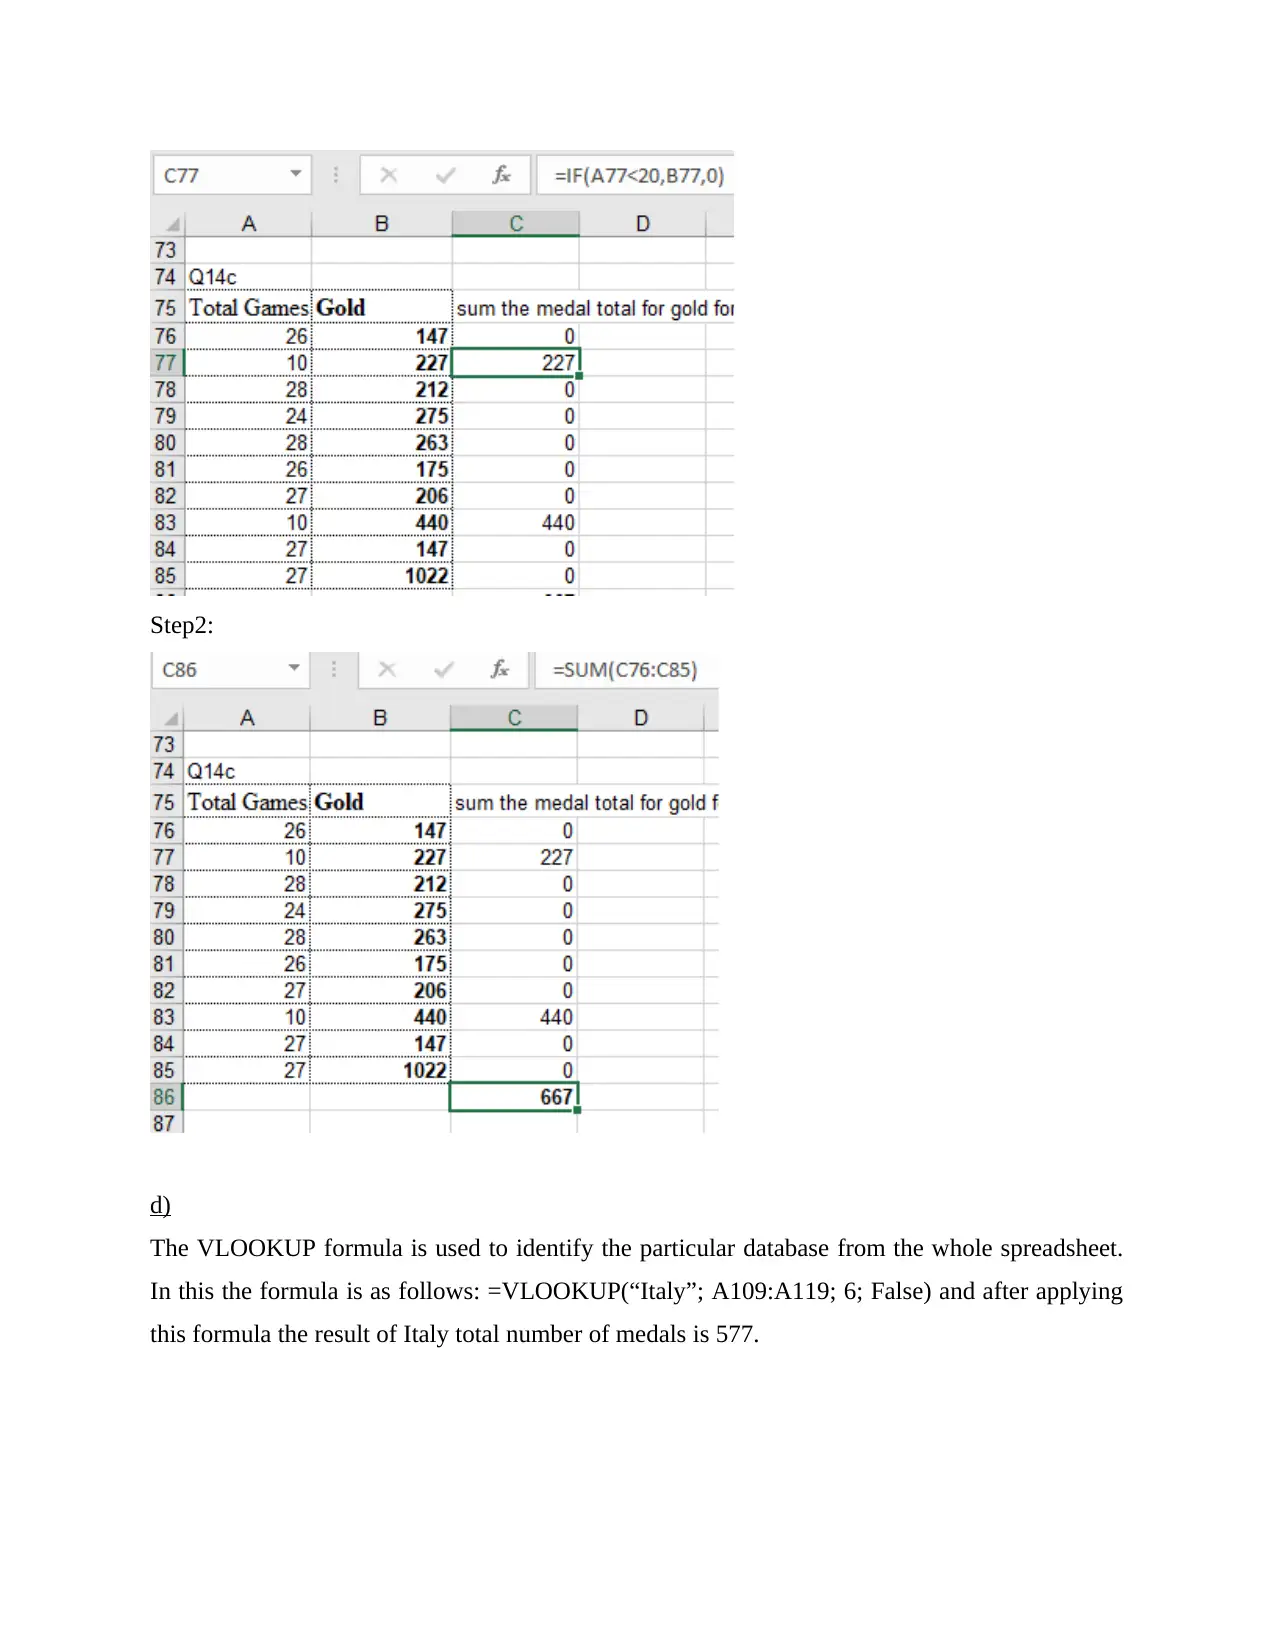
In this question, first there is a need to identify the countries with less than 20 game involvement
using the application of IF excel formula. After applying this formula the countries with less than
20 game involvement and their gold medals is calculated. After this, there is only need to sum all
the value using the sum formula.
Step1:
In order to calculate the average number of silver medals for a European country, first need to
identify the countries from the 10 which are part of Europe. Such countries involve France,
Germany, Hungary, Italy and Sweden. Now to calculate their silver medals average the formula
of average is used which is =AVERAGE(number1, number2, …..). In this question, the average
silver medal is 209.8 (Evans and et.al., 2017).
c)
In this question, first there is a need to identify the countries with less than 20 game involvement
using the application of IF excel formula. After applying this formula the countries with less than
20 game involvement and their gold medals is calculated. After this, there is only need to sum all
the value using the sum formula.
Step1:
Step2:
d)
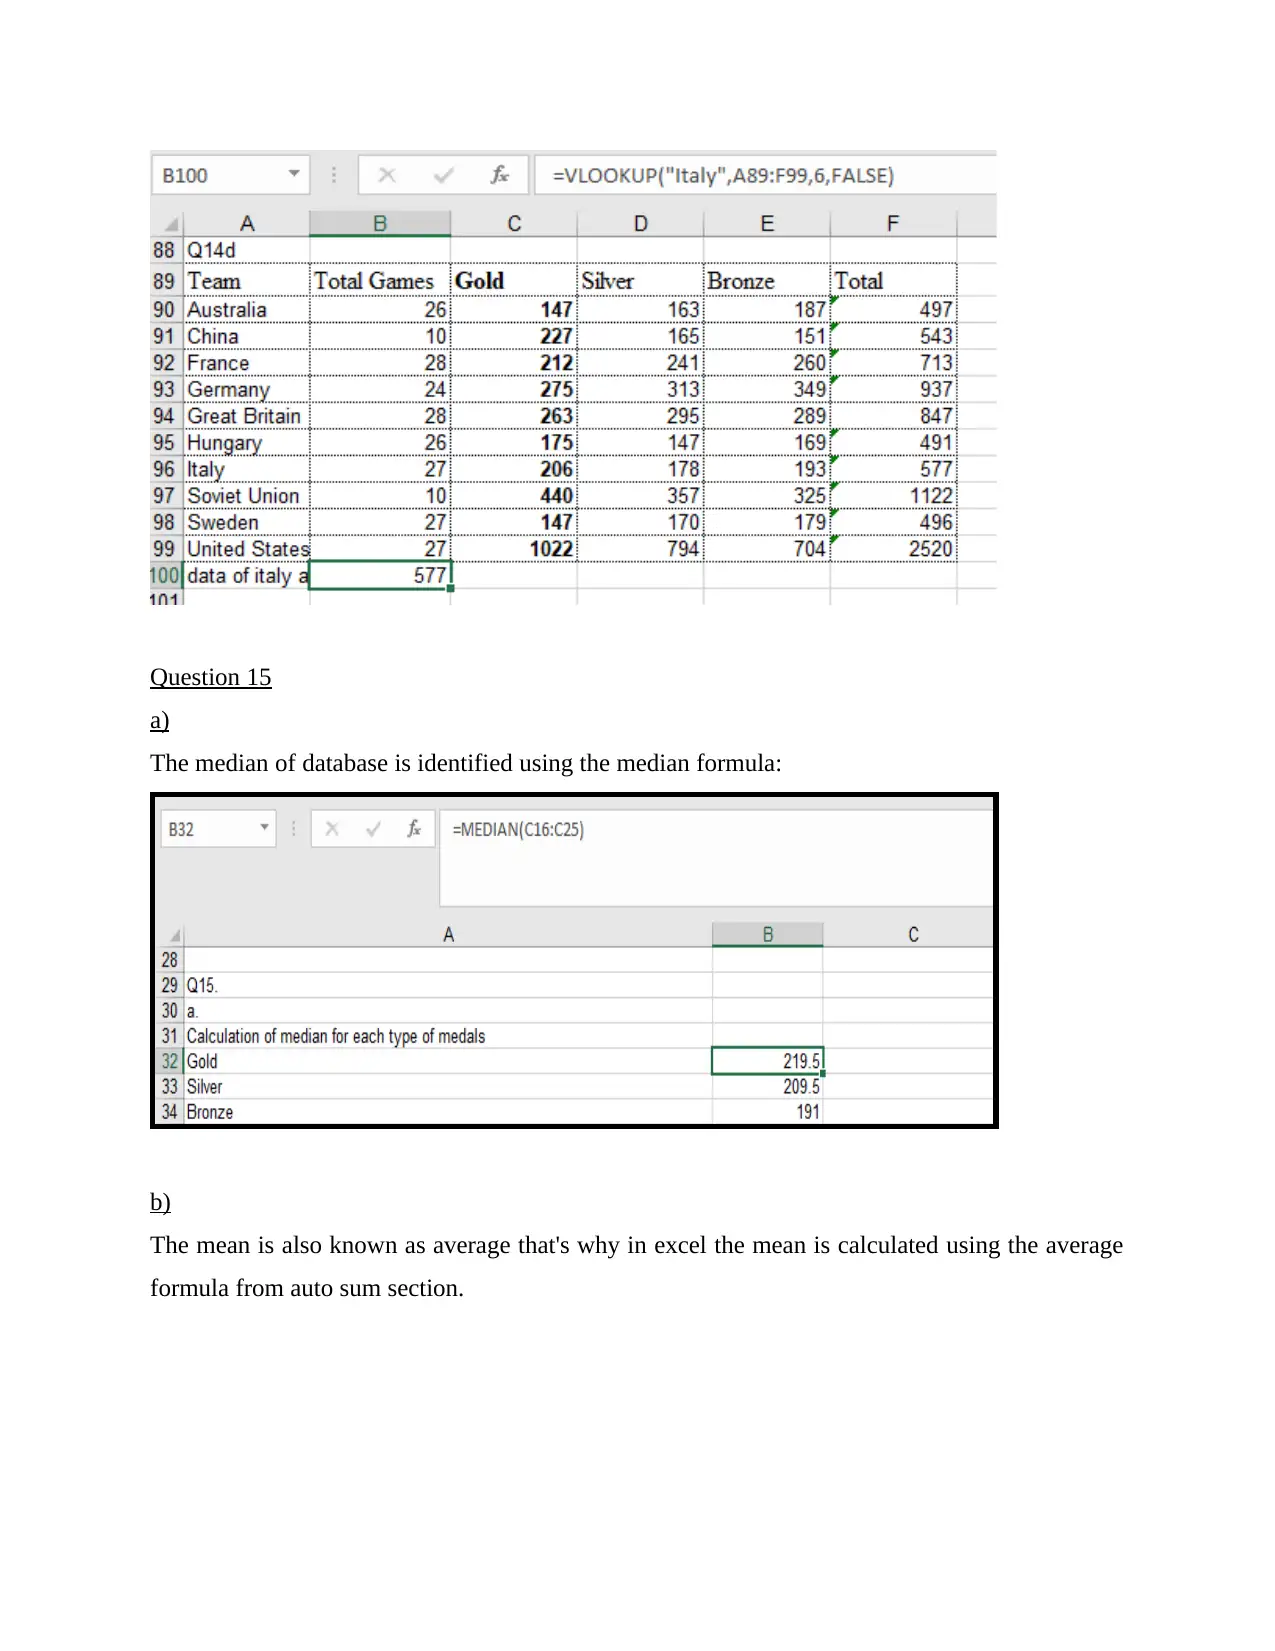
The VLOOKUP formula is used to identify the particular database from the whole spreadsheet.
In this the formula is as follows: =VLOOKUP(“Italy”; A109:A119; 6; False) and after applying
this formula the result of Italy total number of medals is 577.
d)
The VLOOKUP formula is used to identify the particular database from the whole spreadsheet.
In this the formula is as follows: =VLOOKUP(“Italy”; A109:A119; 6; False) and after applying
this formula the result of Italy total number of medals is 577.
You're viewing a preview
Unlock full access by subscribing today!
Question 15
a)
The median of database is identified using the median formula:
b)
The mean is also known as average that's why in excel the mean is calculated using the average
formula from auto sum section.
a)
The median of database is identified using the median formula:
b)
The mean is also known as average that's why in excel the mean is calculated using the average
formula from auto sum section.
Paraphrase This Document
Need a fresh take? Get an instant paraphrase of this document with our AI Paraphraser
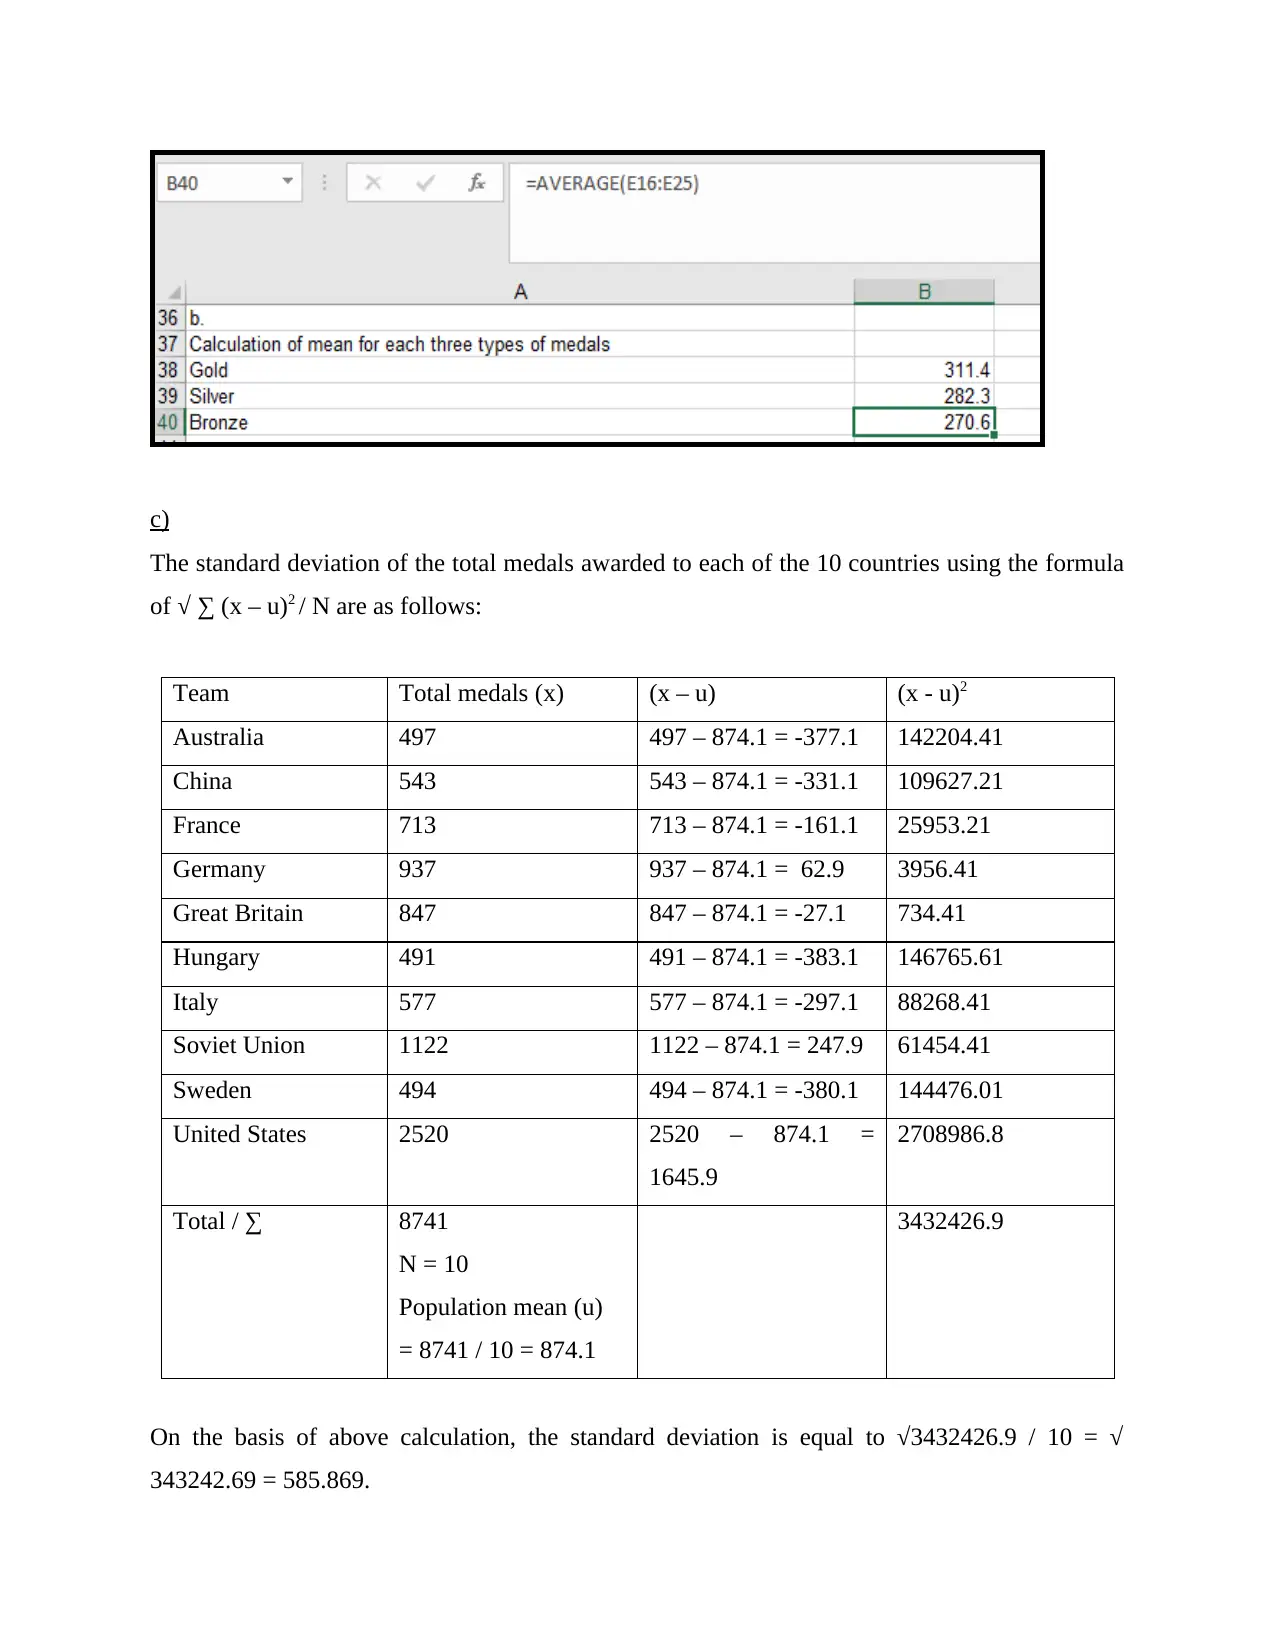
c)
The standard deviation of the total medals awarded to each of the 10 countries using the formula
of √ ∑ (x – u)2 / N are as follows:
Team Total medals (x) (x – u) (x - u)2
Australia 497 497 – 874.1 = -377.1 142204.41
China 543 543 – 874.1 = -331.1 109627.21
France 713 713 – 874.1 = -161.1 25953.21
Germany 937 937 – 874.1 = 62.9 3956.41
Great Britain 847 847 – 874.1 = -27.1 734.41
Hungary 491 491 – 874.1 = -383.1 146765.61
Italy 577 577 – 874.1 = -297.1 88268.41
Soviet Union 1122 1122 – 874.1 = 247.9 61454.41
Sweden 494 494 – 874.1 = -380.1 144476.01
United States 2520 2520 – 874.1 =
1645.9
2708986.8
Total / ∑ 8741
N = 10
Population mean (u)
= 8741 / 10 = 874.1
3432426.9
On the basis of above calculation, the standard deviation is equal to √3432426.9 / 10 = √
343242.69 = 585.869.
d)
The uses of standard deviation are as follows:
This is useful to measure and average and expected value of a group of data.
It is also helpful in identifying the difference of the specific value from its means which
indicate that high standard deviation are more spread outs (Blum and Krauss, 2018).
Question 16
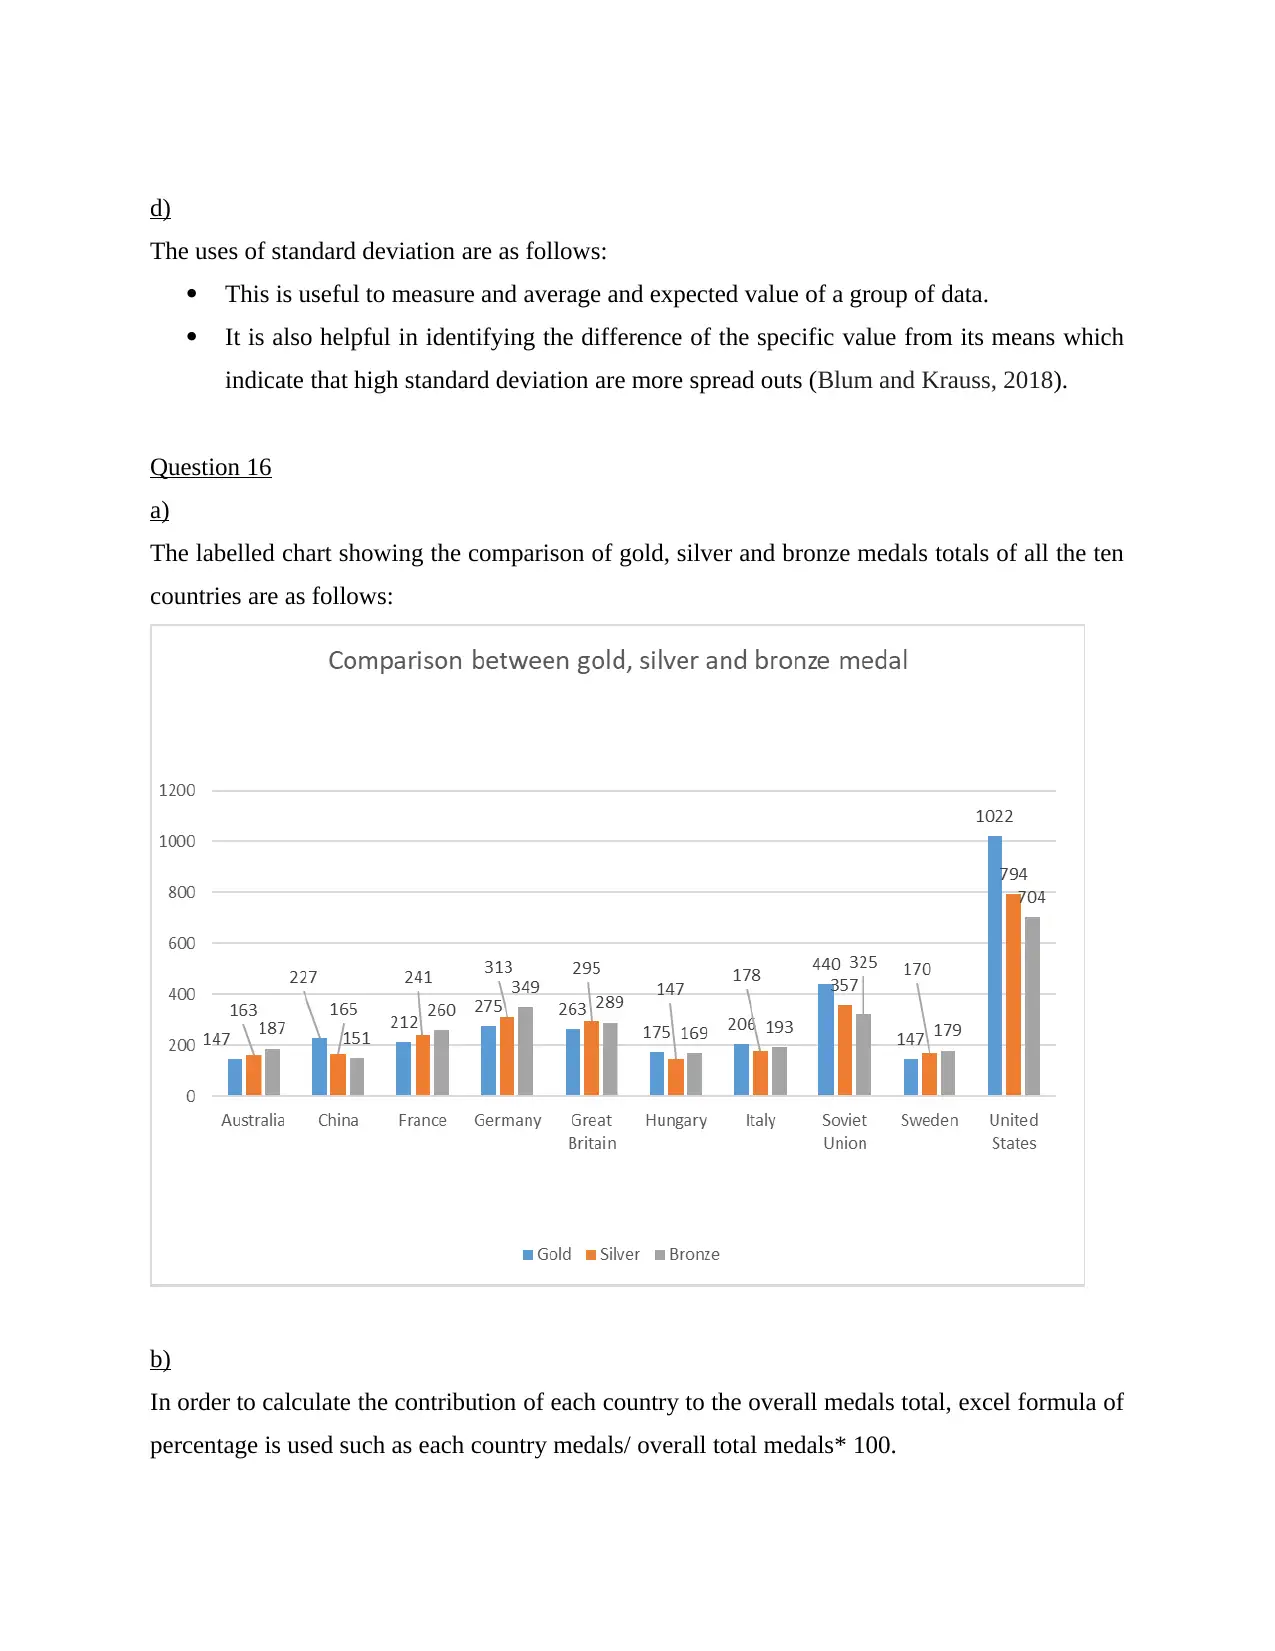
a)
The labelled chart showing the comparison of gold, silver and bronze medals totals of all the ten
countries are as follows:
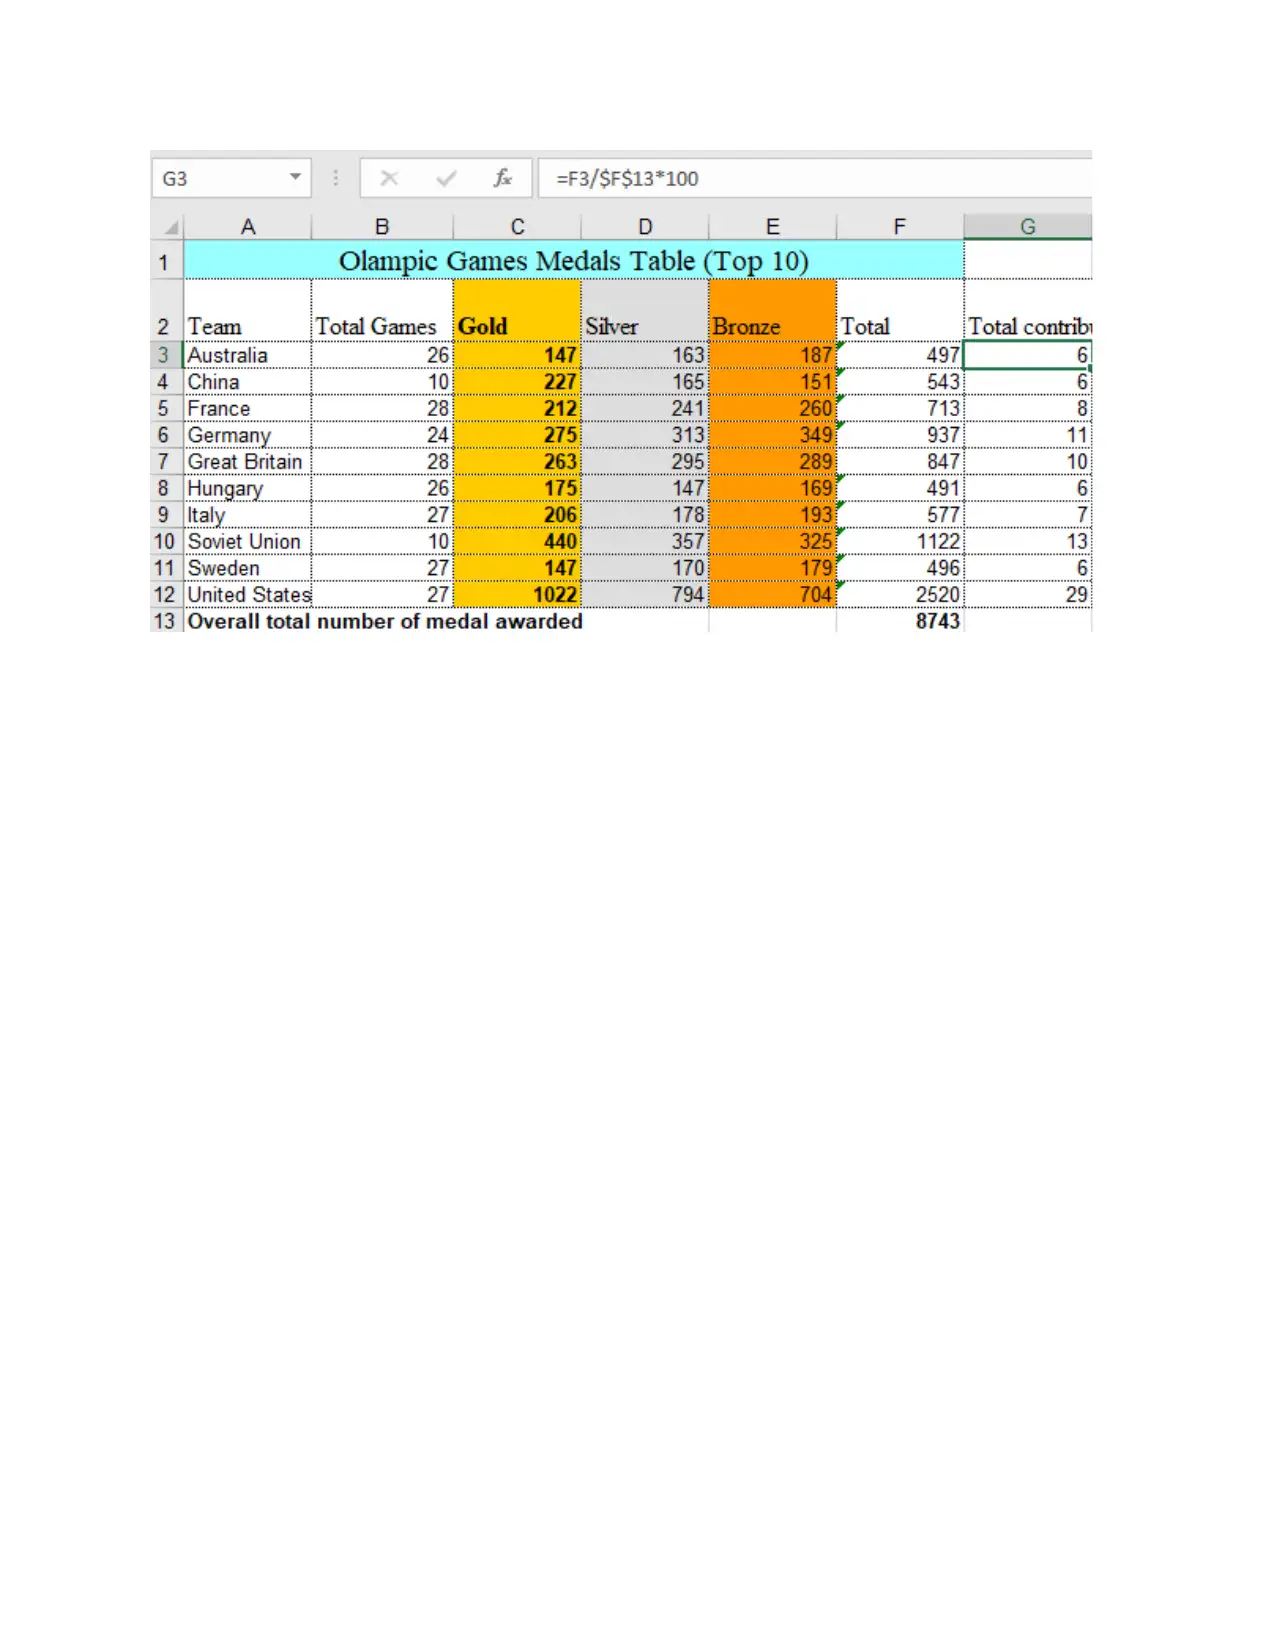
b)
In order to calculate the contribution of each country to the overall medals total, excel formula of
percentage is used such as each country medals/ overall total medals* 100.
The uses of standard deviation are as follows:
This is useful to measure and average and expected value of a group of data.
It is also helpful in identifying the difference of the specific value from its means which
indicate that high standard deviation are more spread outs (Blum and Krauss, 2018).
Question 16
a)
The labelled chart showing the comparison of gold, silver and bronze medals totals of all the ten
countries are as follows:
b)
In order to calculate the contribution of each country to the overall medals total, excel formula of
percentage is used such as each country medals/ overall total medals* 100.
You're viewing a preview
Unlock full access by subscribing today!
Paraphrase This Document
Need a fresh take? Get an instant paraphrase of this document with our AI Paraphraser

REFERENCES
Books and journals
Reder, S., Gauly, B. and Lechner, C., 2020. Practice makes perfect: Practice engagement theory
and the development of adult literacy and numeracy proficiency. International Review
of Education. 66(2). pp.267-288.
Yamashita, T. and et.l., 2020. Numeracy and preventive health care service utilization among
middle-aged and older adults in the US. Clinical gerontologist. 43(2). pp.221-232.
Patel, N., Baker, S. G. and Scherer, L. D., 2019. Evaluating the cognitive reflection test as a
measure of intuition/reflection, numeracy, and insight problem solving, and the
implications for understanding real-world judgments and beliefs. Journal of
Experimental Psychology: General. 148(12). p.2129.
Spithourakis, G. P. and Riedel, S., 2018. Numeracy for language models: Evaluating and
improving their ability to predict numbers. arXiv preprint arXiv:1805.08154.
Khalid, M., Bashir, S. and Amin, H., 2019. Effectiveness of Literacy and Numeracy Drive at
Primary Level in Punjab: A Trend Analysis. Journal of Educational Research (1027-
9776). 22(2).
Schwenger, B., 2018. Research on training wheels–embedding academic literacy and numeracy
in vocational pedagogy through action research. Educational Action Research. 26(2).
pp.288-300.
Dowding, D. W. and et.al., 2017. Does level of numeracy and graph literacy impact
comprehension of quality targets? Findings from a survey of home care nurses. In AMIA
Annual Symposium Proceedings (Vol. 2017, p. 635). American Medical Informatics
Association.
Evans, J. and et.al., 2017. Numeracy skills and the numerate environment: affordances and
demands. Adults Learning Mathematics: An International Journal. 12(1). pp.17-26.
Blum, M. and Krauss, K. P., 2018. Age heaping and numeracy: looking behind the curtain. The
Economic History Review. 71(2). pp.464-479.
1
You're viewing a preview
Unlock full access by subscribing today!

2
1 out of 22
Related Documents


Your All-in-One AI-Powered Toolkit for Academic Success.
+13062052269
info@desklib.com
Available 24*7 on WhatsApp / Email
![[object Object]](/_next/static/media/star-bottom.7253800d.svg)
Unlock your academic potential
© 2024 | Zucol Services PVT LTD | All rights reserved.