Numeracy, Data & IT: Basic Arithmetic, Fractions, Olympics Medal Table Analysis, Excel Functions
VerifiedAdded on 2023/06/17
|21
|3639
|202
AI Summary
This article covers basic arithmetic, fractions, Olympics medal table analysis, and Excel functions related to Numeracy, Data & IT. It explains the importance of numeracy in everyday life and provides examples of basic arithmetic operations. It also covers fractions, percentages, and their applications. The article then analyzes the Olympics medal table and provides insights into the performance of different countries. Finally, it explains how to use Excel functions to perform calculations and create graphs.
Contribute Materials
Your contribution can guide someone’s learning journey. Share your
documents today.
Numeracy, data & IT
Secure Best Marks with AI Grader
Need help grading? Try our AI Grader for instant feedback on your assignments.
INTRODUCTION
Arithmetic expertise is described as the ability to think about and apply exact predictive
concepts, while IT competence is described as having the ability to compute and evaluate the
available arithmetic and IT data (Ascher, 2018.). Mastering in basic arithmetic, statistics,
probability, measurement is an important aspect of developing fundamental mathematical
abilities. Mathematics is required for logical cognition and mental skills in everyday routines.
The concept of numeracy is important for actions such as dining, completing tasks, assessing
invoicing, and playing sports. It also makes mathematical knowledge, patterns, scheduling, and
forms available. It was established that the concepts of language arts and mathematics may
enable them to build the basic skills that are require in day to day operation in life. There is a
significant strategies for increasing literacy and mathematical abilities, as well as helps the
learner in learning concepts that act in contributing as an active and well-informed person. This
mathematics repertory is split into 3 main exercises, each of which should be done individually.
Part 1
Question 1
As said before, mathematics competency is interpreted as the capability to analyse and
implement simple mathematical concepts. Basic quantitative abilities necessitate knowledge of
fundamental calculated values like summing, finding average, differences. Let know the meaning
of the following two types of fraction (Kilpatrick, 2020).
a) Numerator: numerator define as number which divide the total numbers in a part.
b) Denominator : It means the total part in a fraction.
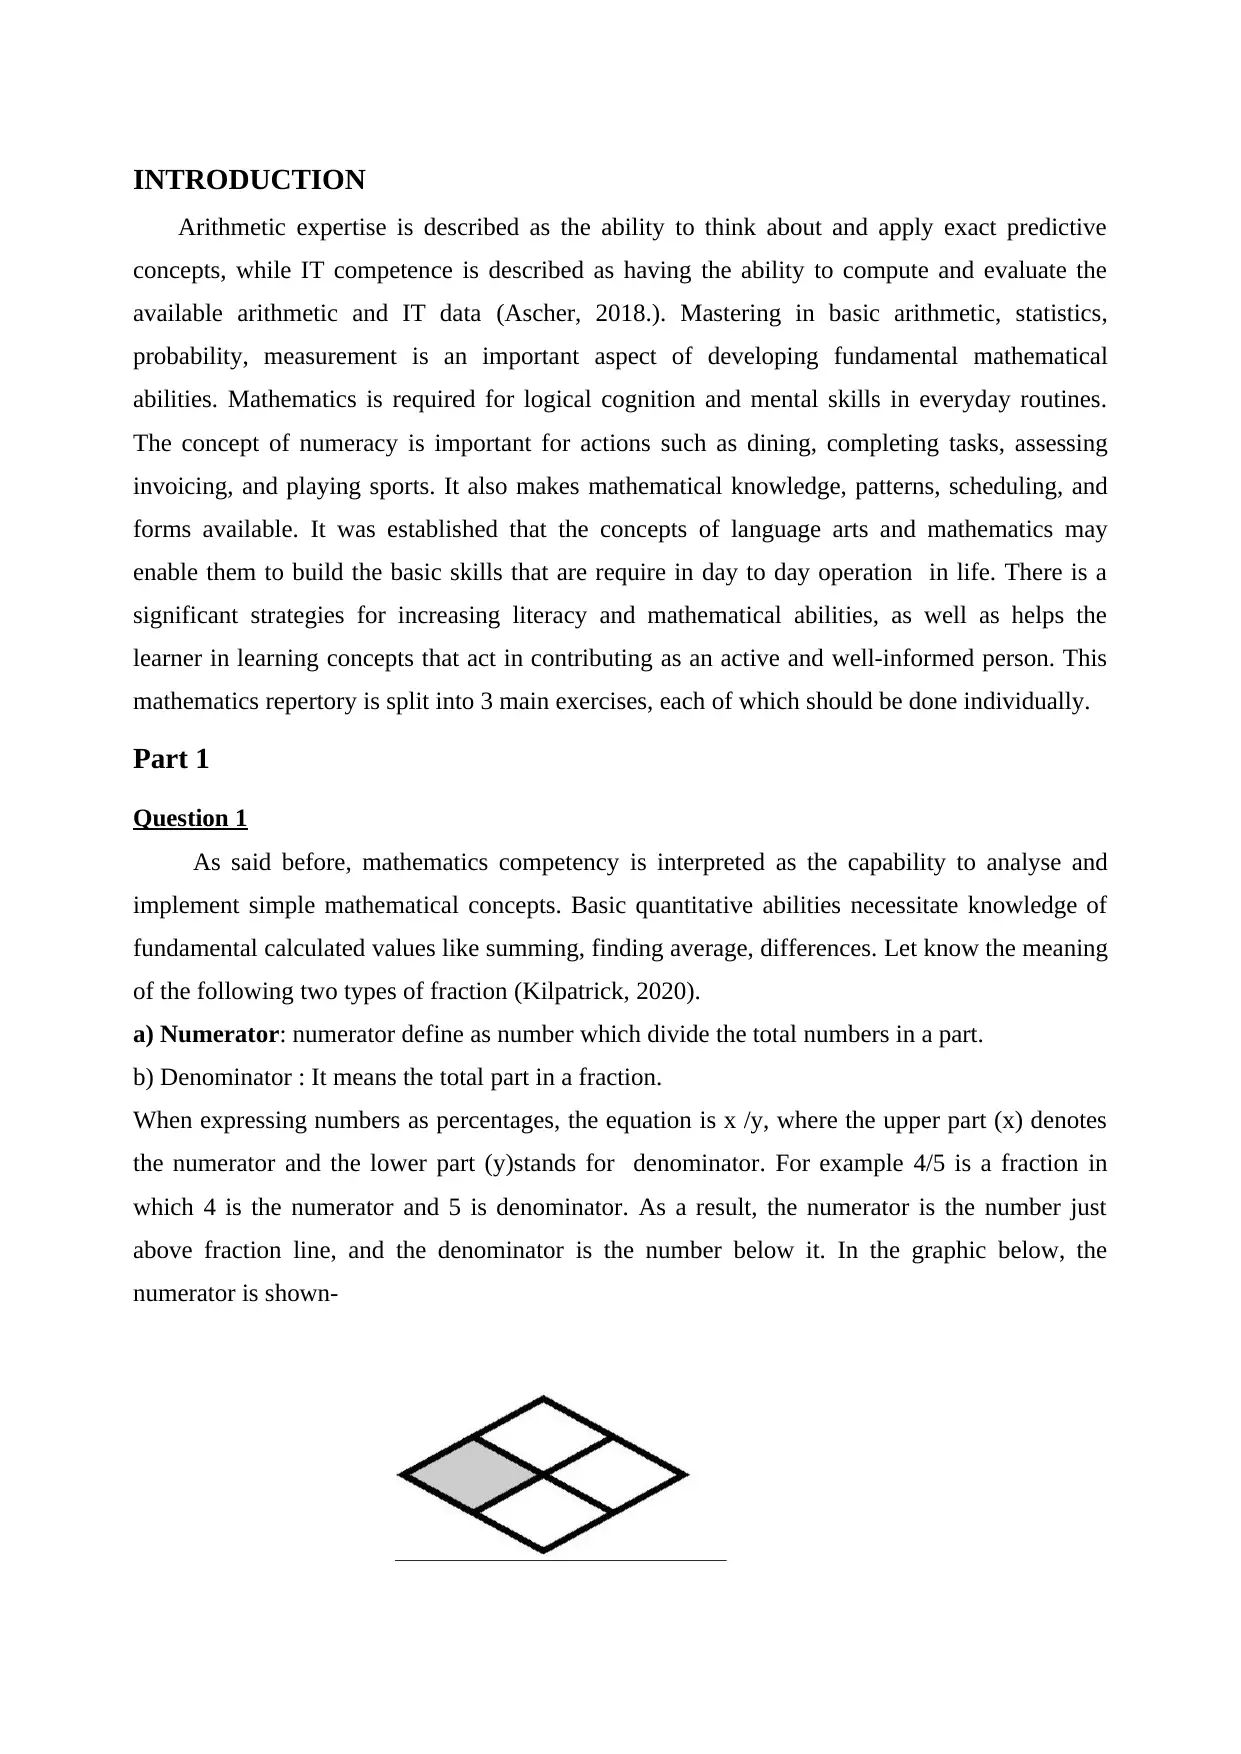
When expressing numbers as percentages, the equation is x /y, where the upper part (x) denotes
the numerator and the lower part (y)stands for denominator. For example 4/5 is a fraction in
which 4 is the numerator and 5 is denominator. As a result, the numerator is the number just
above fraction line, and the denominator is the number below it. In the graphic below, the
numerator is shown-
Arithmetic expertise is described as the ability to think about and apply exact predictive
concepts, while IT competence is described as having the ability to compute and evaluate the
available arithmetic and IT data (Ascher, 2018.). Mastering in basic arithmetic, statistics,
probability, measurement is an important aspect of developing fundamental mathematical
abilities. Mathematics is required for logical cognition and mental skills in everyday routines.
The concept of numeracy is important for actions such as dining, completing tasks, assessing
invoicing, and playing sports. It also makes mathematical knowledge, patterns, scheduling, and
forms available. It was established that the concepts of language arts and mathematics may
enable them to build the basic skills that are require in day to day operation in life. There is a
significant strategies for increasing literacy and mathematical abilities, as well as helps the
learner in learning concepts that act in contributing as an active and well-informed person. This
mathematics repertory is split into 3 main exercises, each of which should be done individually.
Part 1
Question 1
As said before, mathematics competency is interpreted as the capability to analyse and
implement simple mathematical concepts. Basic quantitative abilities necessitate knowledge of
fundamental calculated values like summing, finding average, differences. Let know the meaning
of the following two types of fraction (Kilpatrick, 2020).
a) Numerator: numerator define as number which divide the total numbers in a part.
b) Denominator : It means the total part in a fraction.
When expressing numbers as percentages, the equation is x /y, where the upper part (x) denotes
the numerator and the lower part (y)stands for denominator. For example 4/5 is a fraction in
which 4 is the numerator and 5 is denominator. As a result, the numerator is the number just
above fraction line, and the denominator is the number below it. In the graphic below, the
numerator is shown-
Question 2
a) 24/40 in simplest form:
24 / 40 divide it by 8 then it will be 3 / 5
b) 18/42 in their simplest forms
by dividing it to 6 it will = 3 / 7.
Question 3
(a)Expressing the fraction 2/3, ¾ and 5/6 as equivalent fractions with a denominator of 12.
2 * 4 / 3* 4 = 8 / 12
3* 3 / 4 *3 = 9 / 12
5 *2 / 6 * 2 = 10 / 12
(b)total books 60,000 .
14,000 are business books,
22,000 healthcare books and
12,000 on psychology and law.
Remaining book = 60000 – (14000 + 22000 + 12000) = 12000
The computer books is 2/3 of the remainder = 2/3 x 12000 = 8000
the percentage of computing out of total books in the library are 8000/60000 x 100 = 13.33%
Question 4
-Liza buys 2 pairs of shoes.
- Liza provides three £50 notes = £50 x 3 = £150
change money get = £10.50
Total amount for shoes= 150- 10.50
= £139.50
single shoe amount = £139.50 / 2
Therefore, each pair of the running shoes cost £69.75
Question 5
(a). 240.50 x 19.54 in two significant number
Secure Best Marks with AI Grader
Need help grading? Try our AI Grader for instant feedback on your assignments.
for two numbers there will be 4 decimal place after the value 240.50 x 19.54 = 4699.3700
= 4699.37 (2 decimal places)
after two decimal the number will be 4700
(b) 52100 in the power of 10
5.21 x 10⁴
Question 6
(a). A new gym offers 30% discount in registration in initial month
there are 3 people who register
together three pay £210
Let the total discount be y Therefore
discount amount is 210* 30%
= £ 63
(b) The total savings made was £63 There are 3 person
Therefore, the average savings per person is
£63 / 3 = £27
Question 7
(a) 3 / 4 + 7 / 9 + 2 / 3
Use BODMASS
(27-28+24)/36 = 23 / 36
(b) largest numbers 0.1, 0.02, 0.003, 0.0004, 0.00005 out of them will be 0.1 because if the
whole number is divided by 100 then out of the among 0.1 will be equal to 10 and
another values will be small.
Question 8
-total 90 men and 60 women were asked that whether they watched the movie or not
total audience are = 90+ 60 = 150
- The fraction of people that said yes = 3/5 (150 * 3 /5) = 90
-Portion of women who watched are = 3/10
Portion Fraction of men also watched the movie = 3/5 – 3/10 = 3/10
-Fraction of men that didn't watch= 1 – 3/10 = 7/10
total of men who did not watch are= 7 / 10 * 90 = 63
percentage who did not watched among men are = 63 / 90 * 100
= 70%
Question 9
-Annabelle resides at Bermondsey in London.
-She will deliver her speech in Birmingham at 10:30 am
time taken by her from her residence to Euston Station will be an hour (1 hr), from she will
gets the train to Birmingham
-Train journey from Euston Station to Birmingham is an hour and 10 minutes (7/6 hrs)
- The meeting destination is a 5-minute (1/6hr) walk from the platform.
Therefore, total time it will taken by Annabelle's journey from her home to the venue is = 1 hrs
+ 7/6 hrs + 1/12 hr = 27/12 hrs = 2 hours 15 minutes
the total time taken by her to reach at the destination at the scheduled time
=(10hrs 30minutes) – (2hrs 15 minutes) = 8hr 15minutes
the train that runs from Euston to Birmingham is are for different time at 5 minutes past the
hour, 25 minutes past the hour and 45 minutes past the hour.
Hence the earliest time that Annabelle can left from her house is at 8 : 15am
Question 10
Shredded Wheat weight is = 0.35
Weetabix box weight is = 9/25 that is 0.36 kg
Now we need to convert them into numbers (0.35,0.36)/100
so from the above calculation the value of the Shredded Wheat is 35, and that of the Weetabox
is 36 ,
so it is clear that Weeta box is heavier in weight by 1 kg or 0.1.
Part 2
Question 11
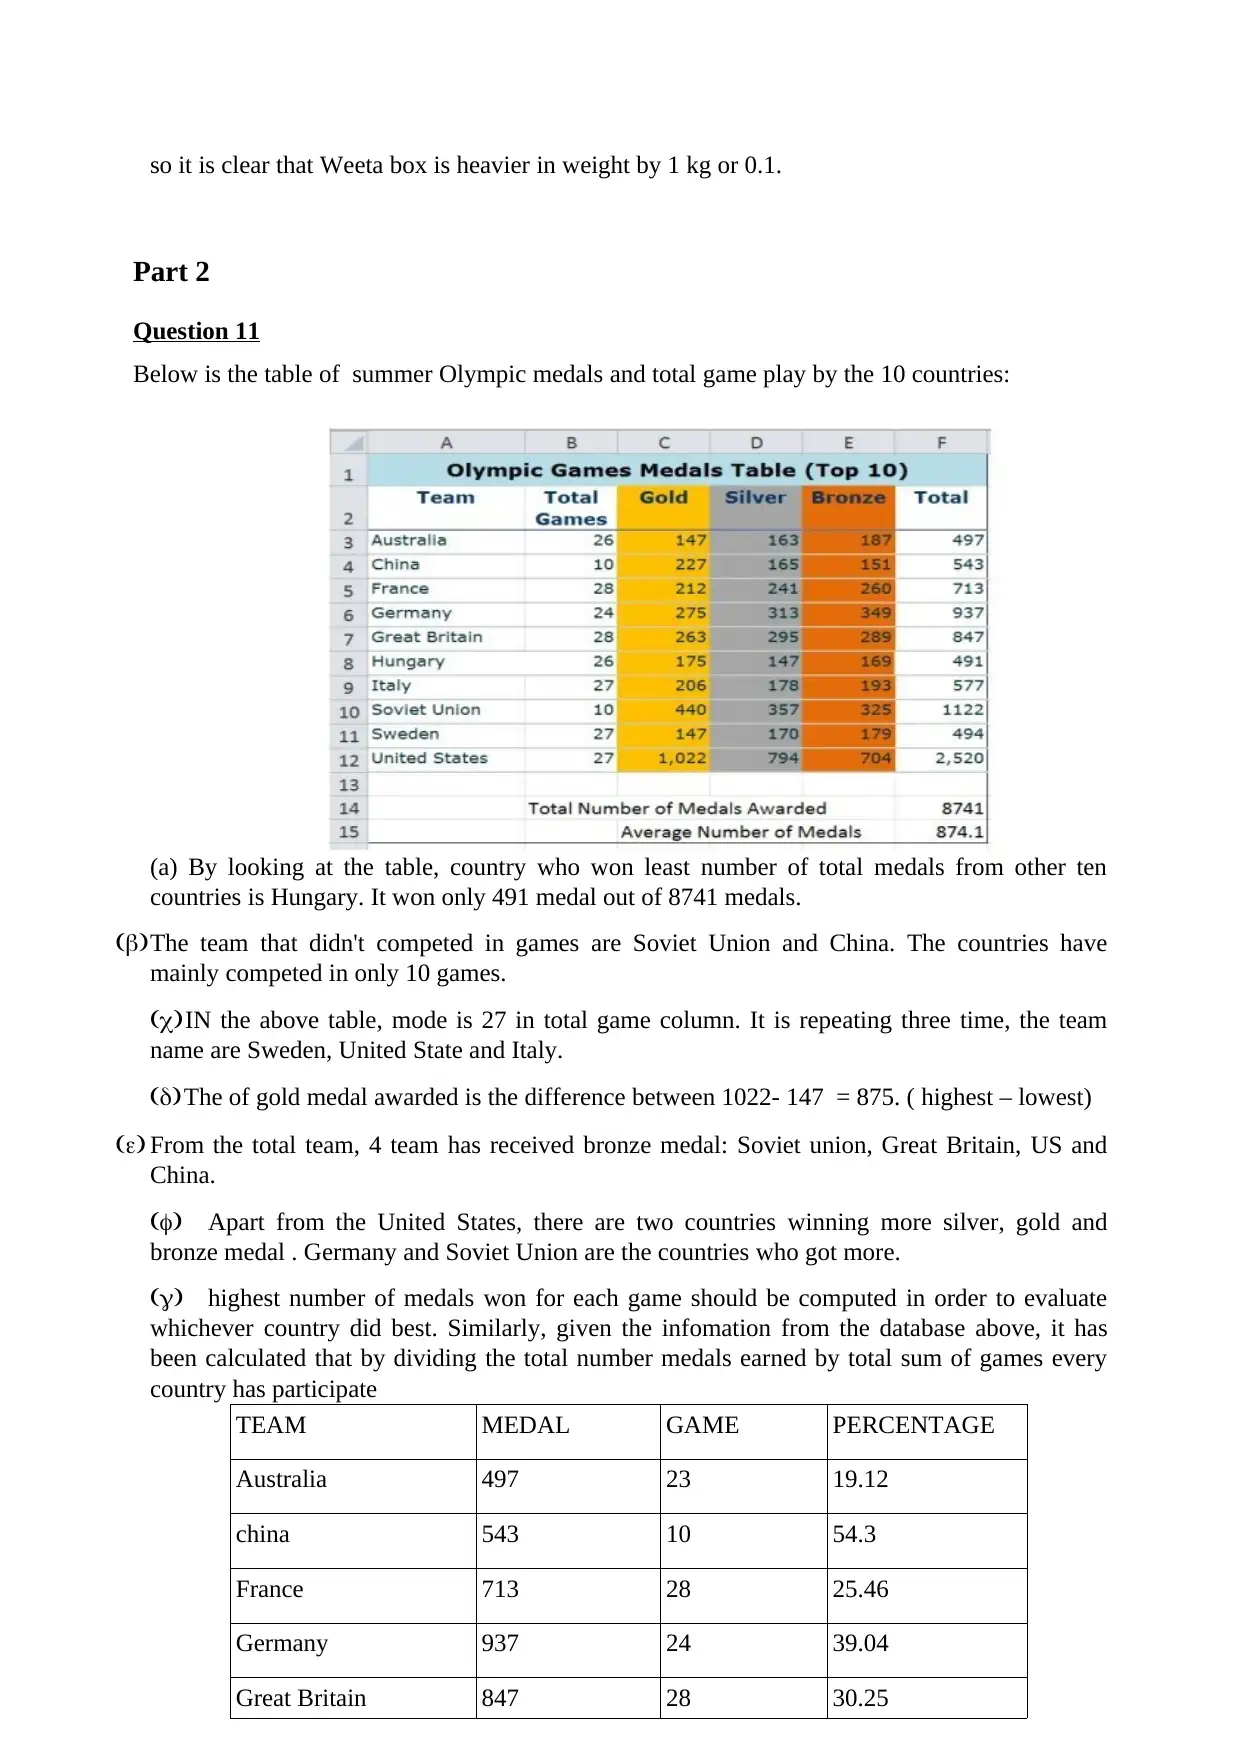
Below is the table of summer Olympic medals and total game play by the 10 countries:
(a) By looking at the table, country who won least number of total medals from other ten
countries is Hungary. It won only 491 medal out of 8741 medals.
(b)The team that didn't competed in games are Soviet Union and China. The countries have
mainly competed in only 10 games.
(c)IN the above table, mode is 27 in total game column. It is repeating three time, the team
name are Sweden, United State and Italy.
(d)The of gold medal awarded is the difference between 1022- 147 = 875. ( highest – lowest)
(e) From the total team, 4 team has received bronze medal: Soviet union, Great Britain, US and
China.
(f) Apart from the United States, there are two countries winning more silver, gold and
bronze medal . Germany and Soviet Union are the countries who got more.
(g) highest number of medals won for each game should be computed in order to evaluate
whichever country did best. Similarly, given the infomation from the database above, it has
been calculated that by dividing the total number medals earned by total sum of games every
country has participate
TEAM MEDAL GAME PERCENTAGE
Australia 497 23 19.12
china 543 10 54.3
France 713 28 25.46
Germany 937 24 39.04
Great Britain 847 28 30.25
Part 2
Question 11
Below is the table of summer Olympic medals and total game play by the 10 countries:
(a) By looking at the table, country who won least number of total medals from other ten
countries is Hungary. It won only 491 medal out of 8741 medals.
(b)The team that didn't competed in games are Soviet Union and China. The countries have
mainly competed in only 10 games.
(c)IN the above table, mode is 27 in total game column. It is repeating three time, the team
name are Sweden, United State and Italy.
(d)The of gold medal awarded is the difference between 1022- 147 = 875. ( highest – lowest)
(e) From the total team, 4 team has received bronze medal: Soviet union, Great Britain, US and
China.
(f) Apart from the United States, there are two countries winning more silver, gold and
bronze medal . Germany and Soviet Union are the countries who got more.
(g) highest number of medals won for each game should be computed in order to evaluate
whichever country did best. Similarly, given the infomation from the database above, it has
been calculated that by dividing the total number medals earned by total sum of games every
country has participate
TEAM MEDAL GAME PERCENTAGE
Australia 497 23 19.12
china 543 10 54.3
France 713 28 25.46
Germany 937 24 39.04
Great Britain 847 28 30.25
Paraphrase This Document
Need a fresh take? Get an instant paraphrase of this document with our AI Paraphraser
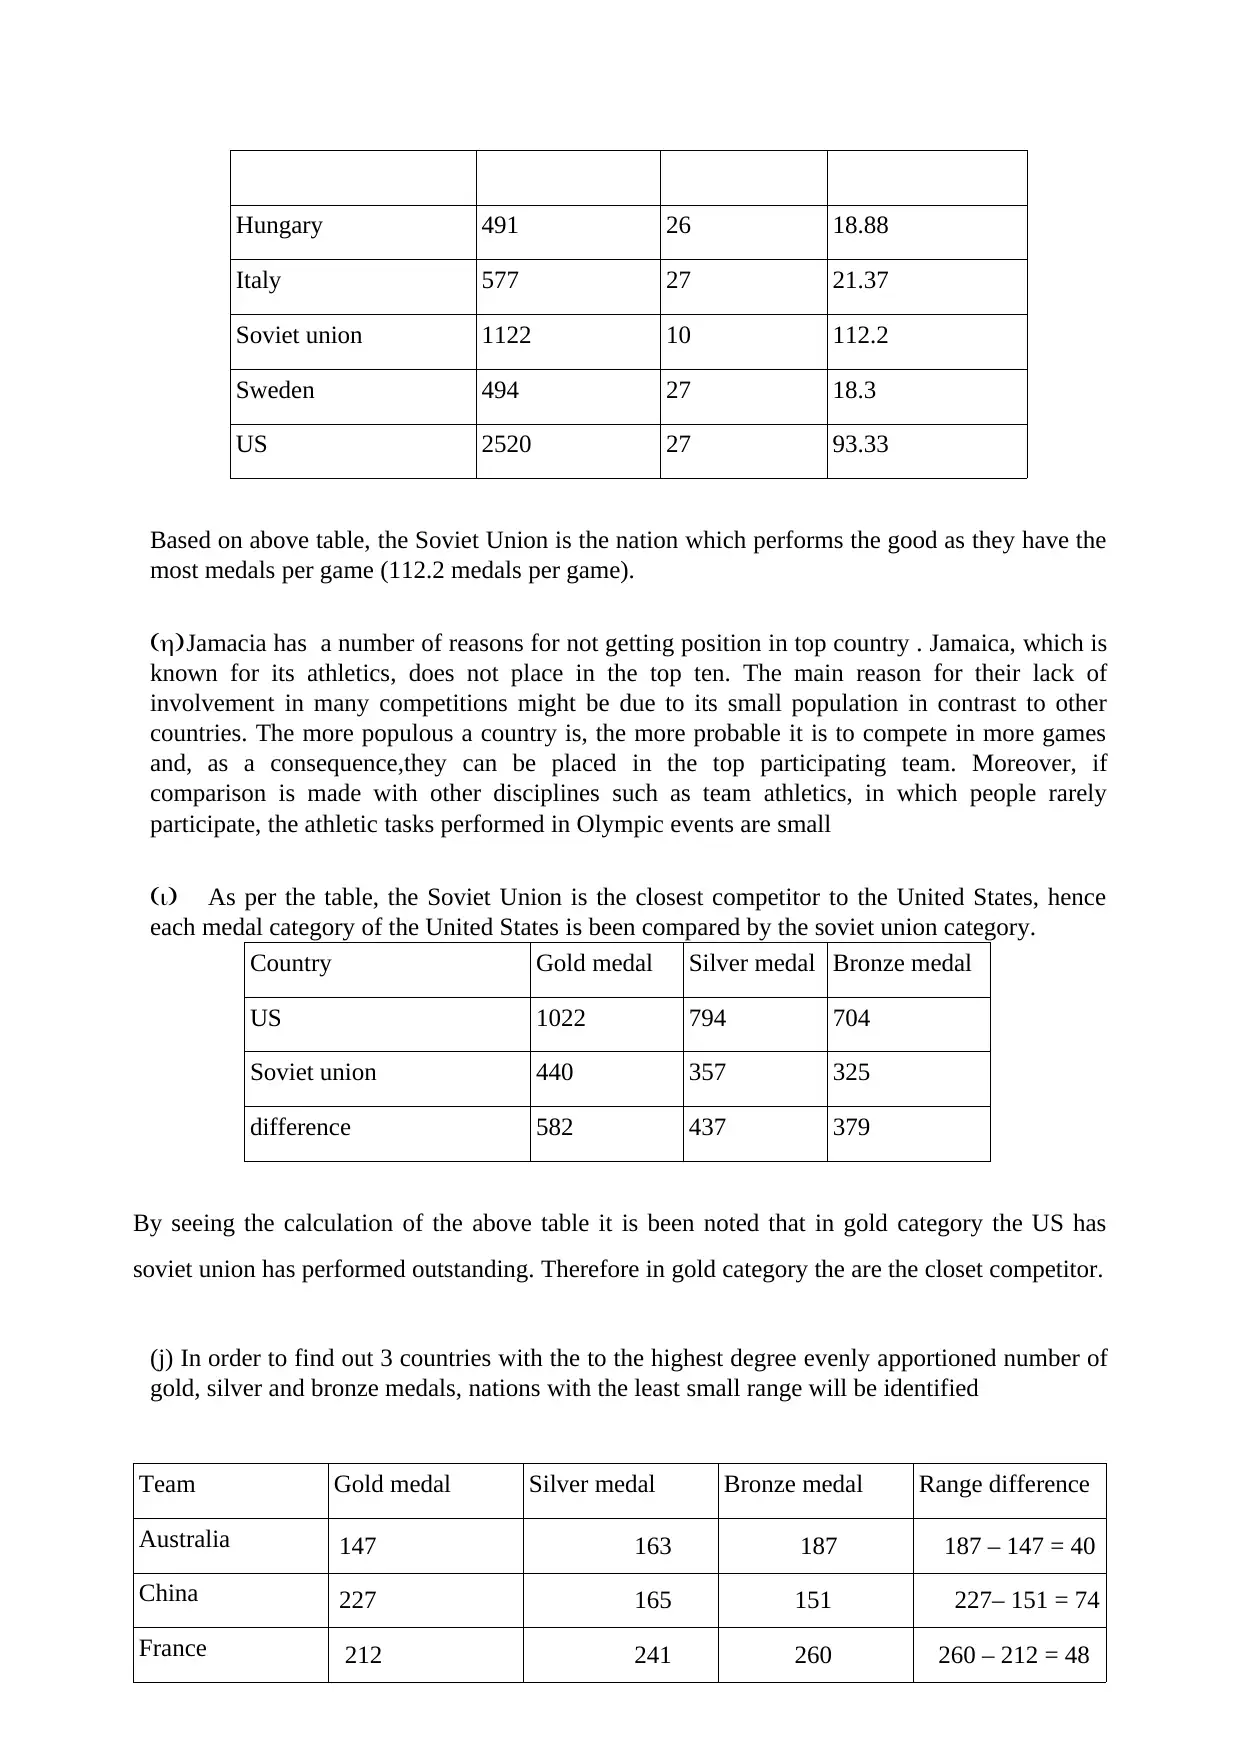
Hungary 491 26 18.88
Italy 577 27 21.37
Soviet union 1122 10 112.2
Sweden 494 27 18.3
US 2520 27 93.33
Based on above table, the Soviet Union is the nation which performs the good as they have the
most medals per game (112.2 medals per game).
(h)Jamacia has a number of reasons for not getting position in top country . Jamaica, which is
known for its athletics, does not place in the top ten. The main reason for their lack of
involvement in many competitions might be due to its small population in contrast to other
countries. The more populous a country is, the more probable it is to compete in more games
and, as a consequence,they can be placed in the top participating team. Moreover, if
comparison is made with other disciplines such as team athletics, in which people rarely
participate, the athletic tasks performed in Olympic events are small
(i) As per the table, the Soviet Union is the closest competitor to the United States, hence
each medal category of the United States is been compared by the soviet union category.
Country Gold medal Silver medal Bronze medal
US 1022 794 704
Soviet union 440 357 325
difference 582 437 379
By seeing the calculation of the above table it is been noted that in gold category the US has
soviet union has performed outstanding. Therefore in gold category the are the closet competitor.
(j) In order to find out 3 countries with the to the highest degree evenly apportioned number of
gold, silver and bronze medals, nations with the least small range will be identified
Team Gold medal Silver medal Bronze medal Range difference
Australia 147 163 187 187 – 147 = 40
China 227 165 151 227– 151 = 74
France 212 241 260 260 – 212 = 48
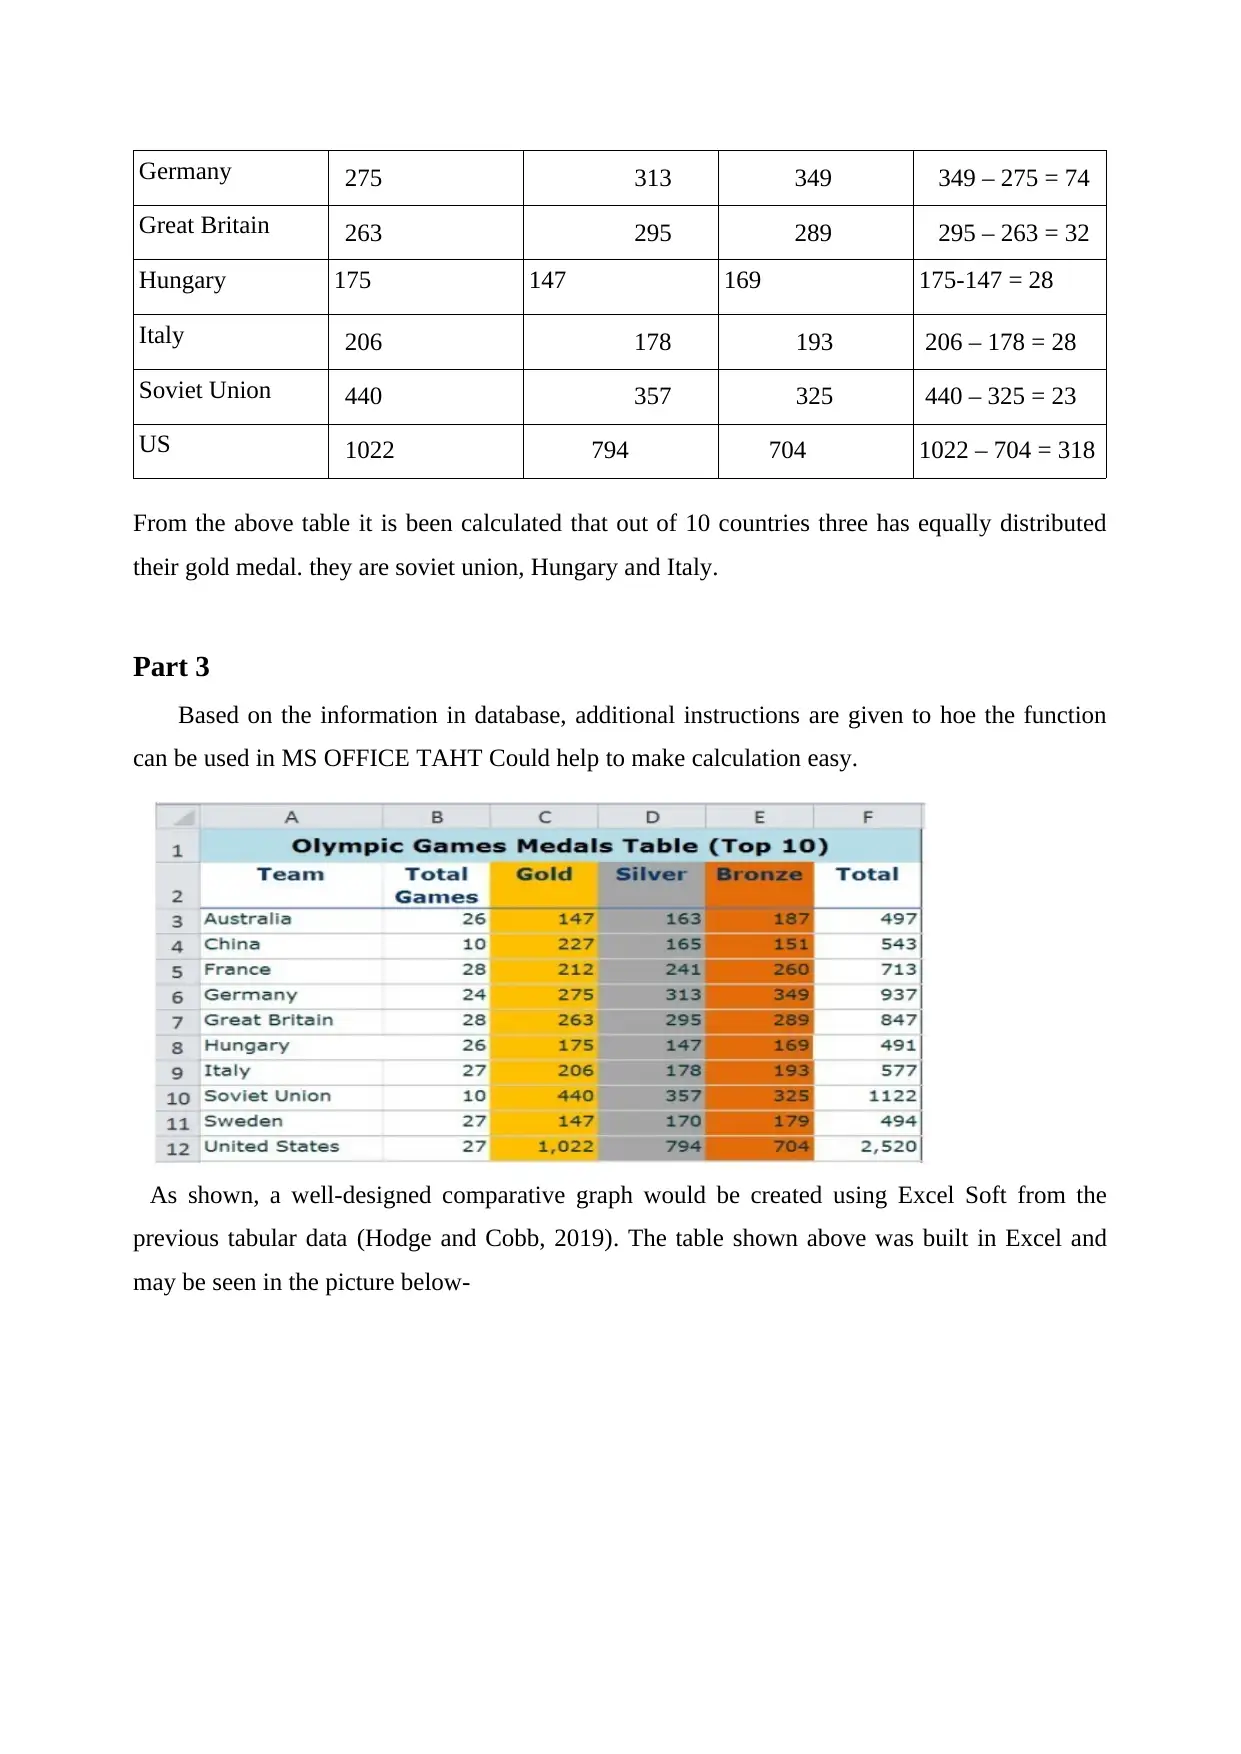
Germany 275 313 349 349 – 275 = 74
Great Britain 263 295 289 295 – 263 = 32
Hungary 175 147 169 175-147 = 28
Italy 206 178 193 206 – 178 = 28
Soviet Union 440 357 325 440 – 325 = 23
US 1022 794 704 1022 – 704 = 318
From the above table it is been calculated that out of 10 countries three has equally distributed
their gold medal. they are soviet union, Hungary and Italy.
Part 3
Based on the information in database, additional instructions are given to hoe the function
can be used in MS OFFICE TAHT Could help to make calculation easy.
As shown, a well-designed comparative graph would be created using Excel Soft from the
previous tabular data (Hodge and Cobb, 2019). The table shown above was built in Excel and
may be seen in the picture below-
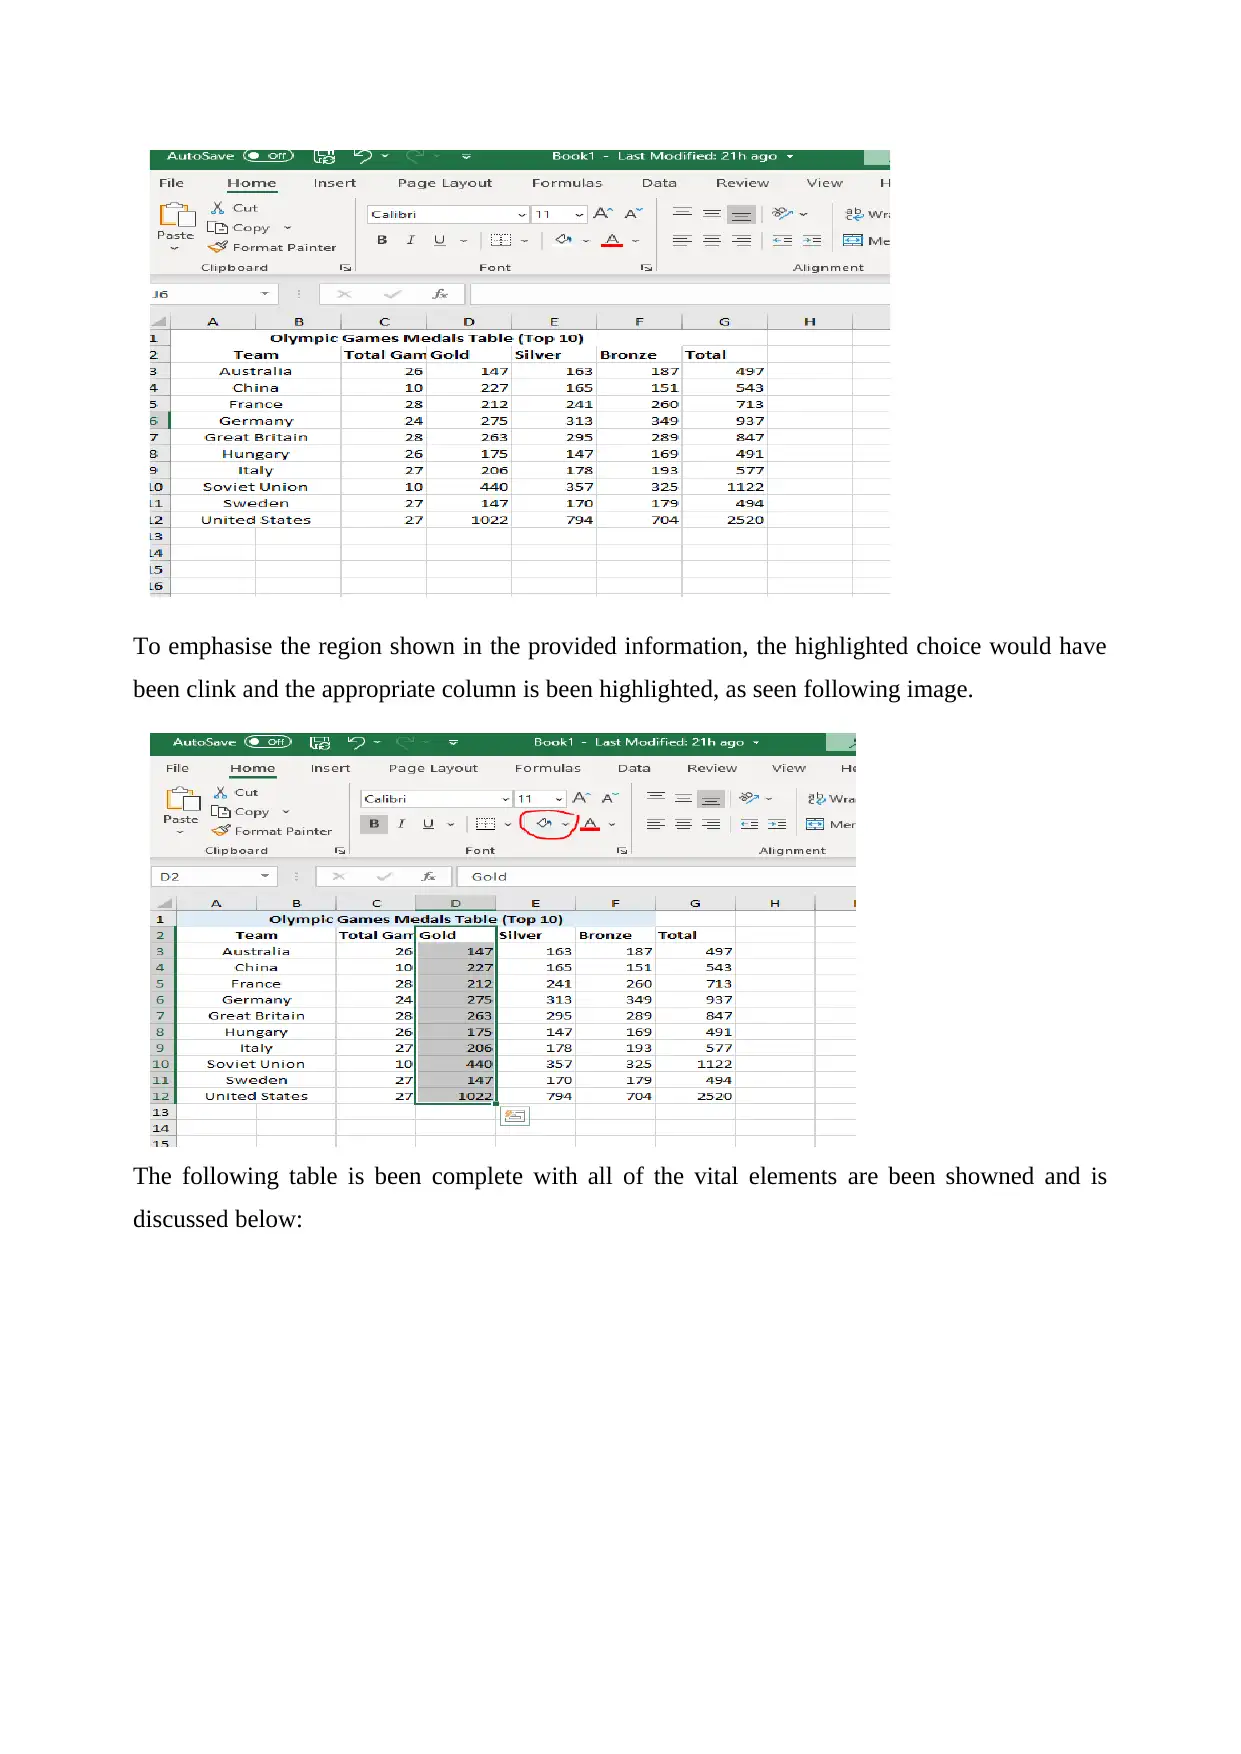
To emphasise the region shown in the provided information, the highlighted choice would have
been clink and the appropriate column is been highlighted, as seen following image.
The following table is been complete with all of the vital elements are been showned and is
discussed below:
been clink and the appropriate column is been highlighted, as seen following image.
The following table is been complete with all of the vital elements are been showned and is
discussed below:
Secure Best Marks with AI Grader
Need help grading? Try our AI Grader for instant feedback on your assignments.
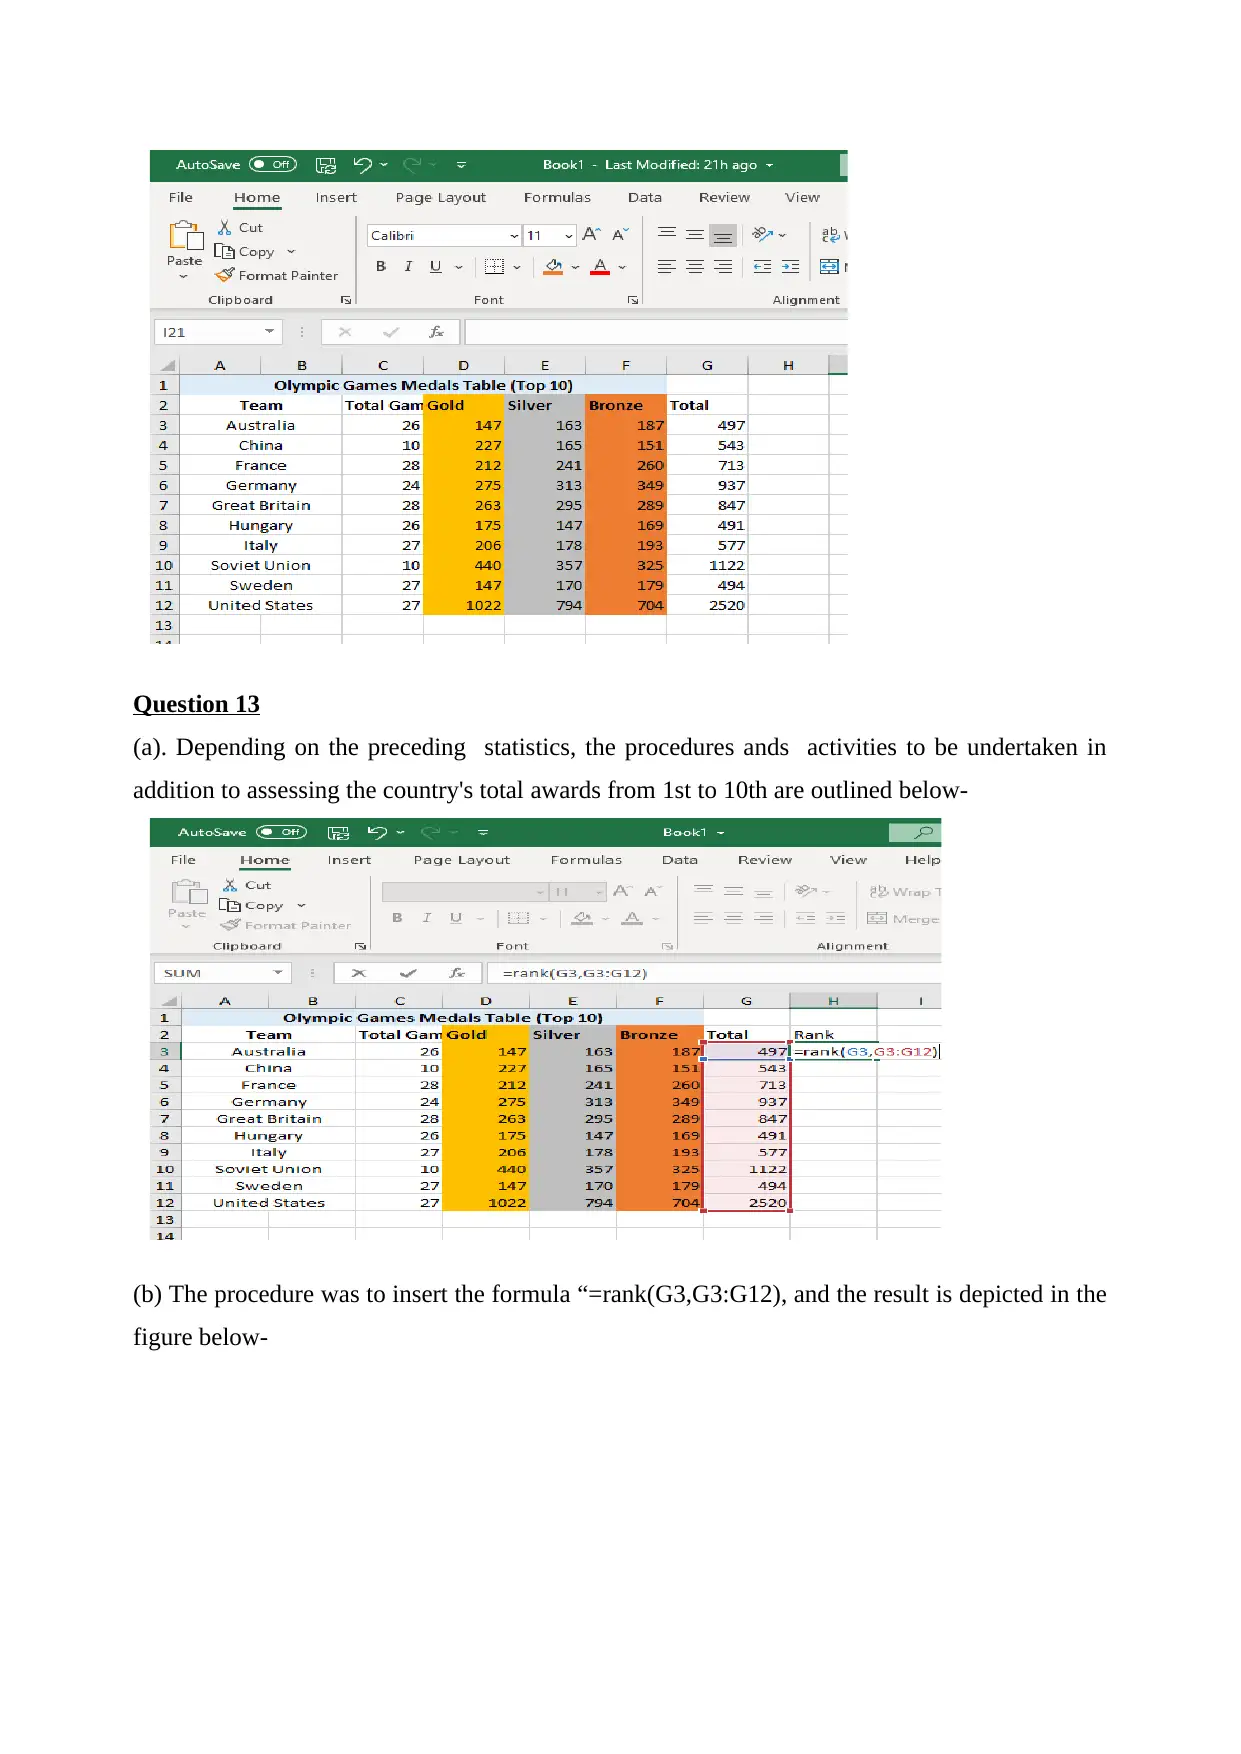
Question 13
(a). Depending on the preceding statistics, the procedures ands activities to be undertaken in
addition to assessing the country's total awards from 1st to 10th are outlined below-
(b) The procedure was to insert the formula “=rank(G3,G3:G12), and the result is depicted in the
figure below-
(a). Depending on the preceding statistics, the procedures ands activities to be undertaken in
addition to assessing the country's total awards from 1st to 10th are outlined below-
(b) The procedure was to insert the formula “=rank(G3,G3:G12), and the result is depicted in the
figure below-
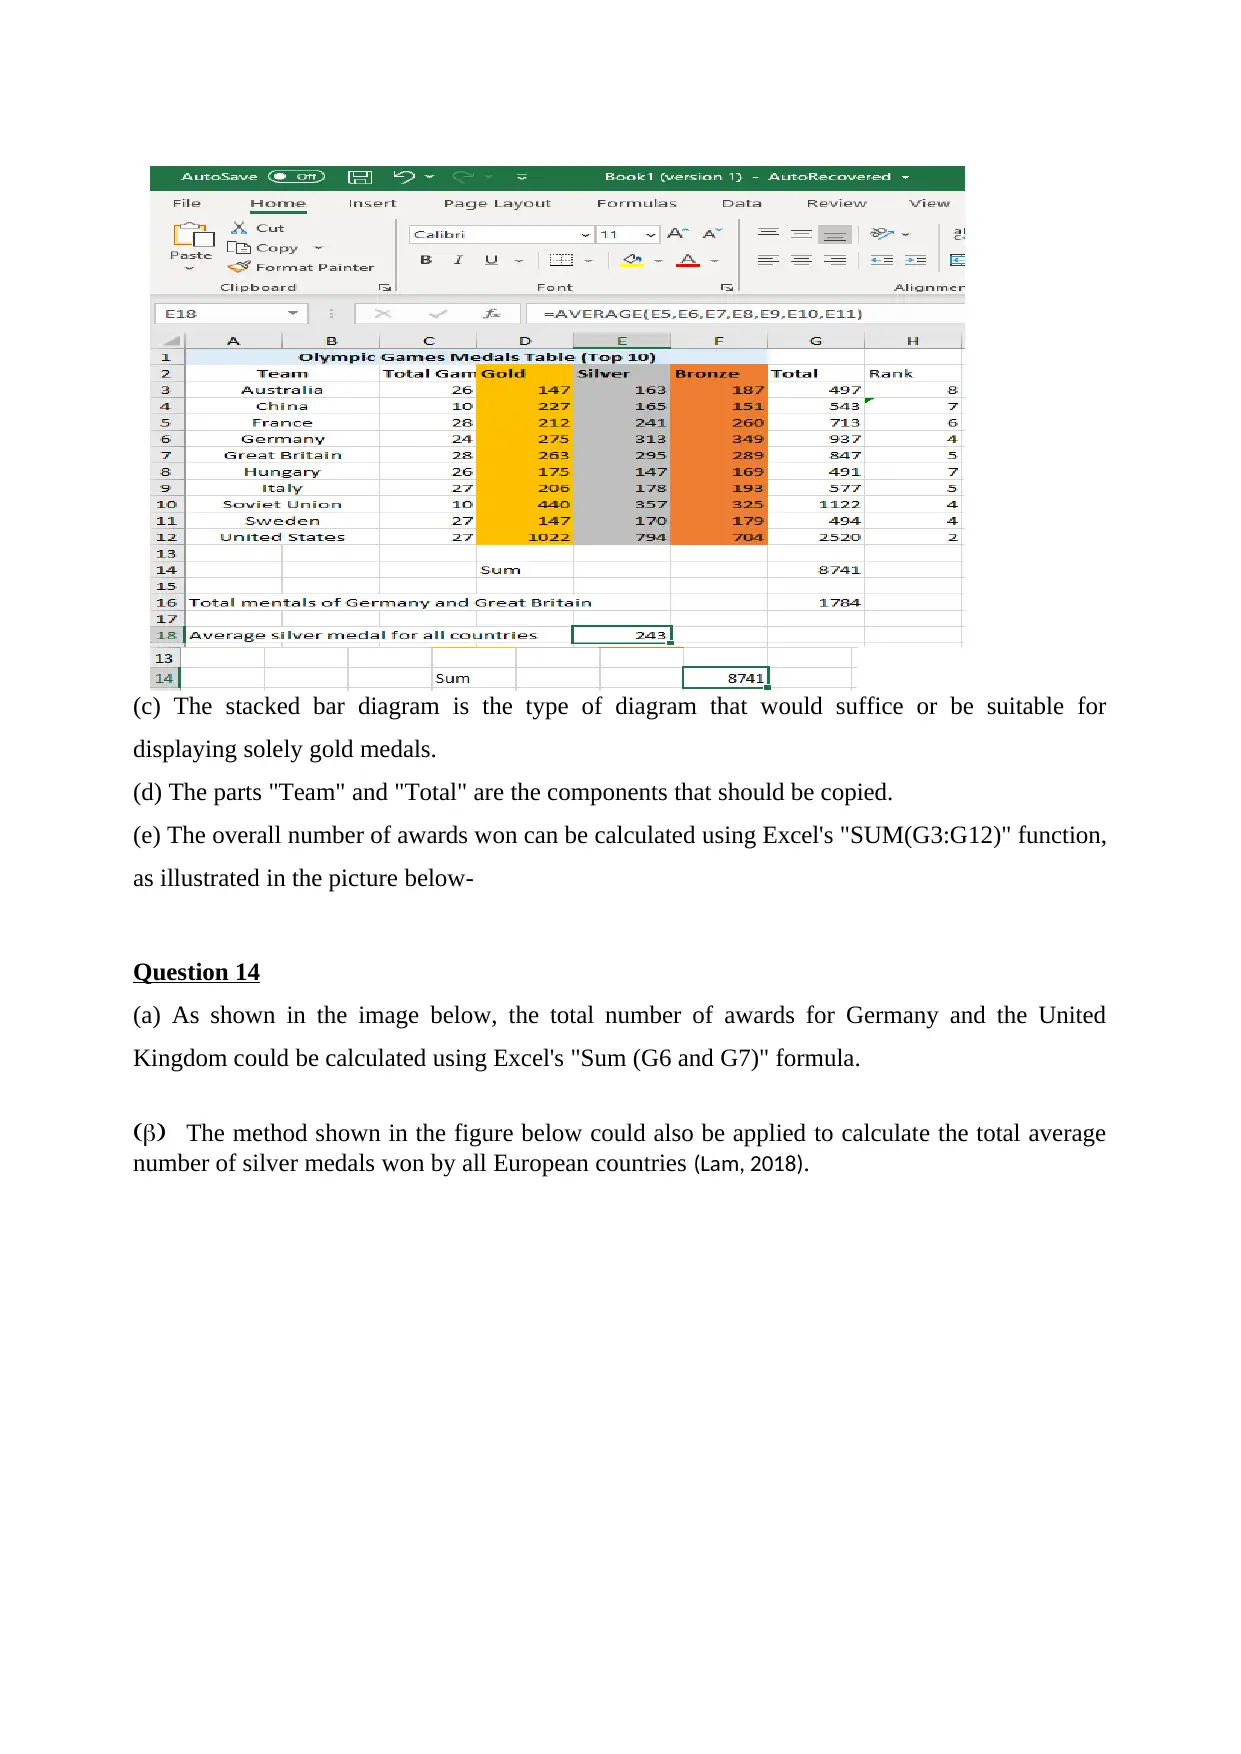
(c) The stacked bar diagram is the type of diagram that would suffice or be suitable for
displaying solely gold medals.
(d) The parts "Team" and "Total" are the components that should be copied.
(e) The overall number of awards won can be calculated using Excel's "SUM(G3:G12)" function,
as illustrated in the picture below-
Question 14
(a) As shown in the image below, the total number of awards for Germany and the United
Kingdom could be calculated using Excel's "Sum (G6 and G7)" formula.
(b) The method shown in the figure below could also be applied to calculate the total average
number of silver medals won by all European countries (Lam, 2018).
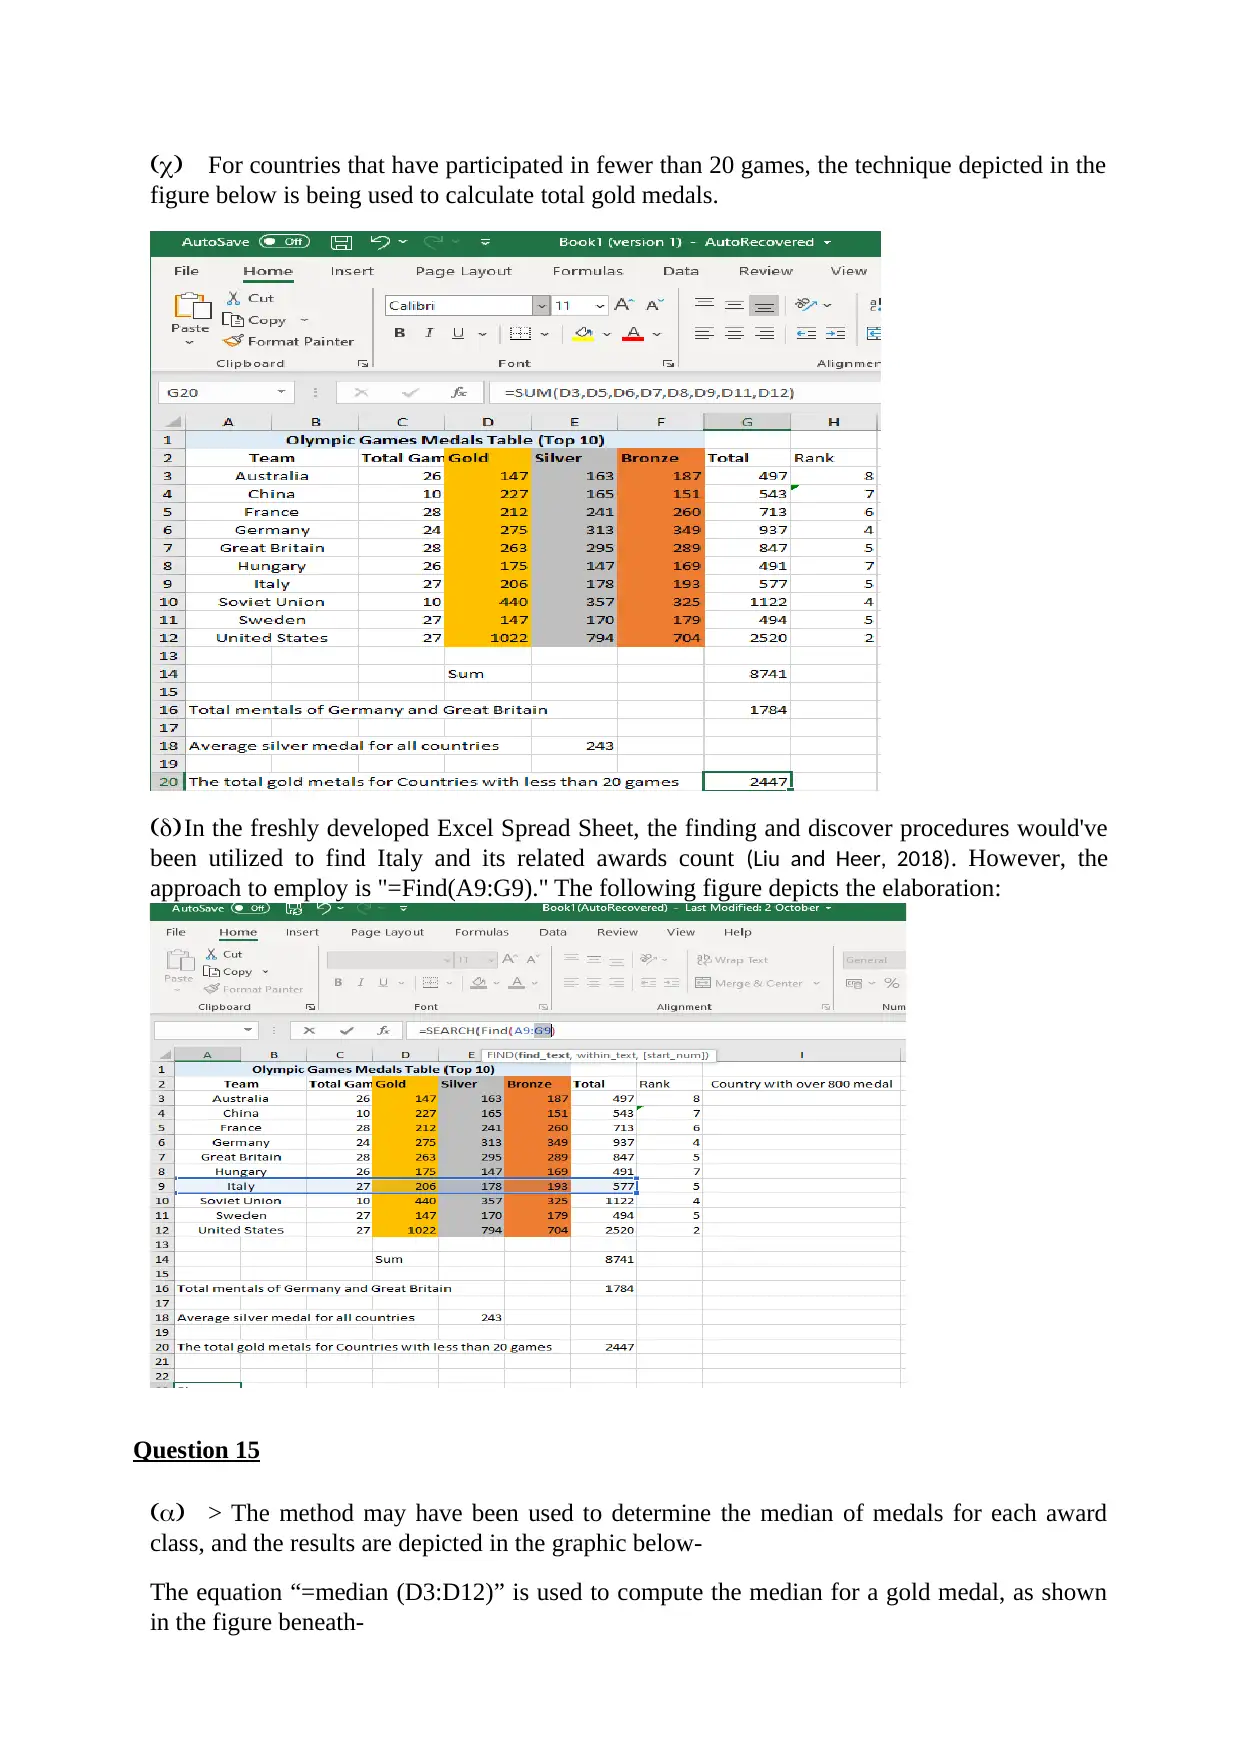
(c) For countries that have participated in fewer than 20 games, the technique depicted in the
figure below is being used to calculate total gold medals.
(d)In the freshly developed Excel Spread Sheet, the finding and discover procedures would've
been utilized to find Italy and its related awards count (Liu and Heer, 2018). However, the
approach to employ is "=Find(A9:G9)." The following figure depicts the elaboration:
Question 15
(a) > The method may have been used to determine the median of medals for each award
class, and the results are depicted in the graphic below-
The equation “=median (D3:D12)” is used to compute the median for a gold medal, as shown
in the figure beneath-
Paraphrase This Document
Need a fresh take? Get an instant paraphrase of this document with our AI Paraphraser
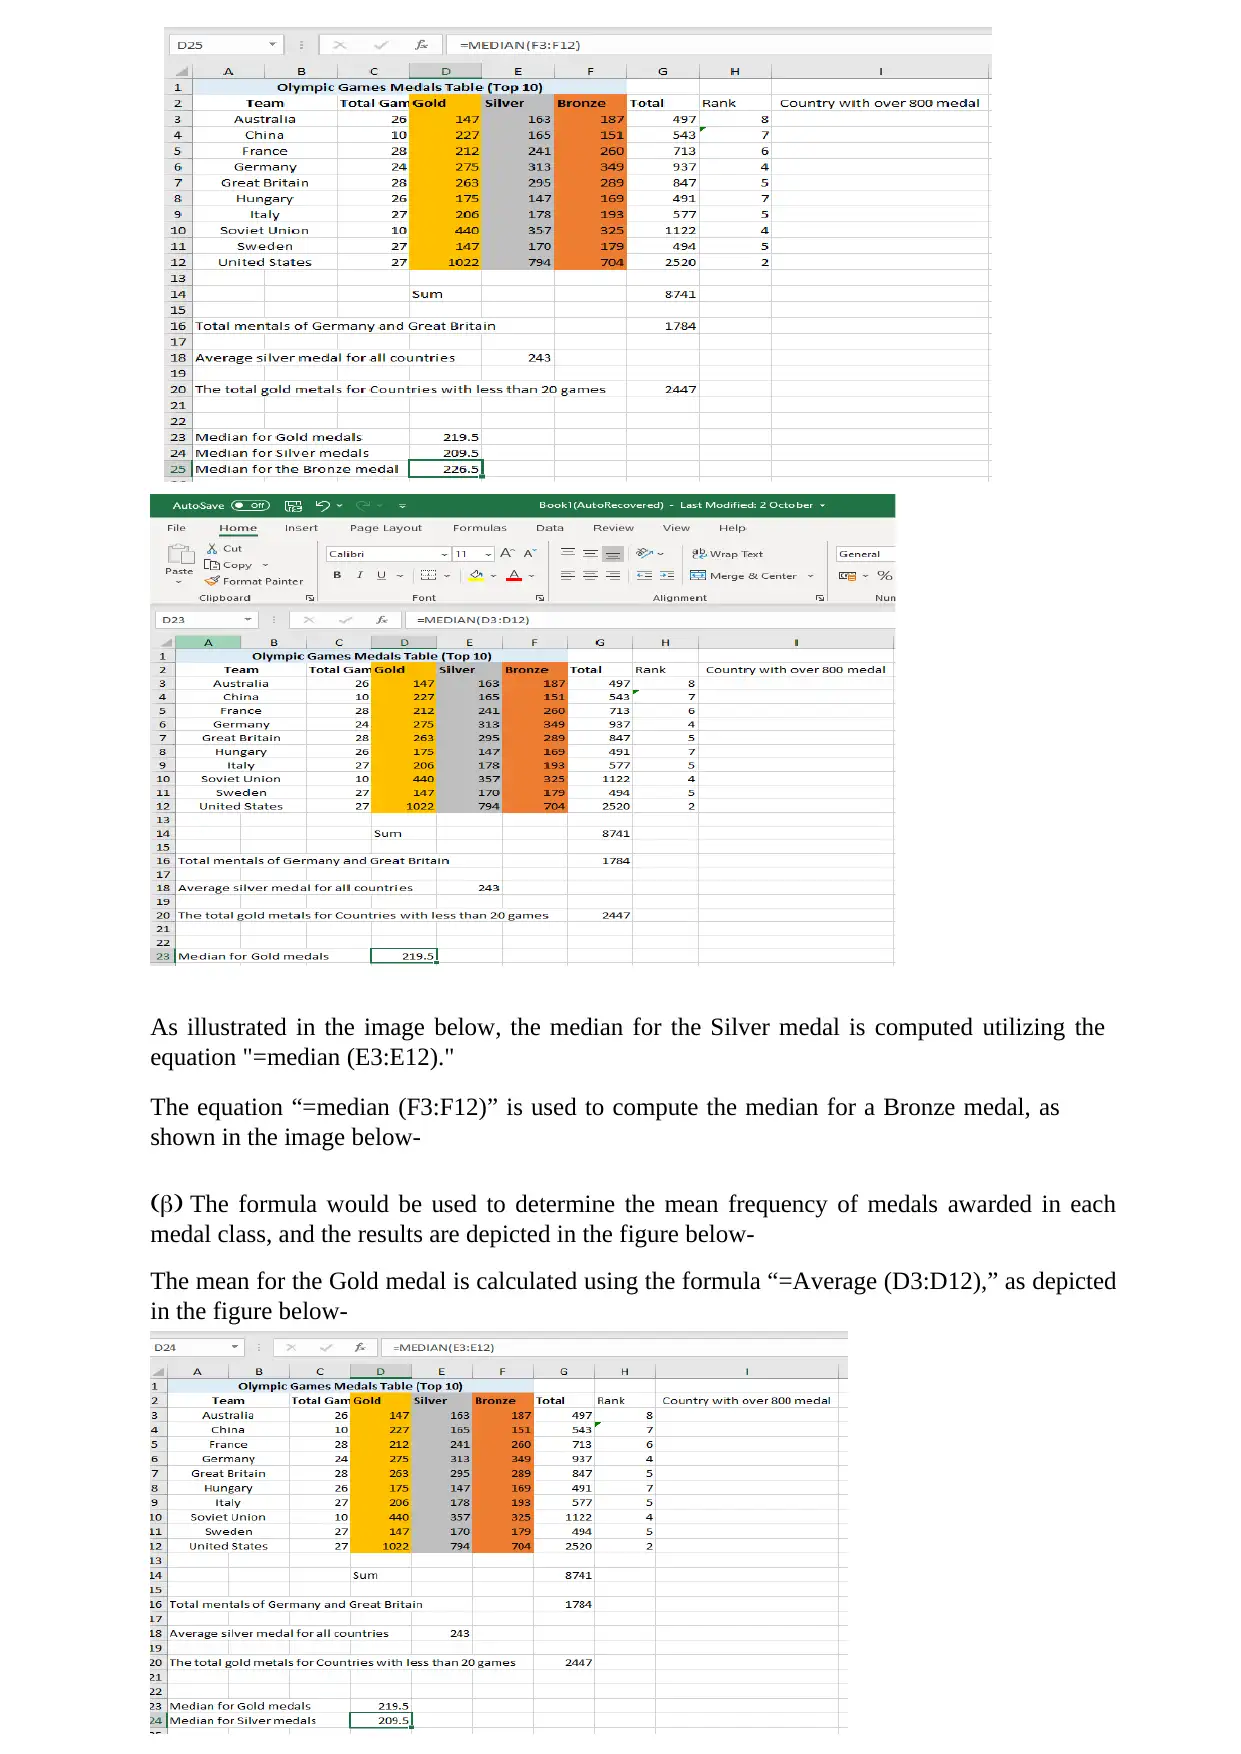
As illustrated in the image below, the median for the Silver medal is computed utilizing the
equation "=median (E3:E12)."
The equation “=median (F3:F12)” is used to compute the median for a Bronze medal, as
shown in the image below-
(b) The formula would be used to determine the mean frequency of medals awarded in each
medal class, and the results are depicted in the figure below-
The mean for the Gold medal is calculated using the formula “=Average (D3:D12),” as depicted
in the figure below-
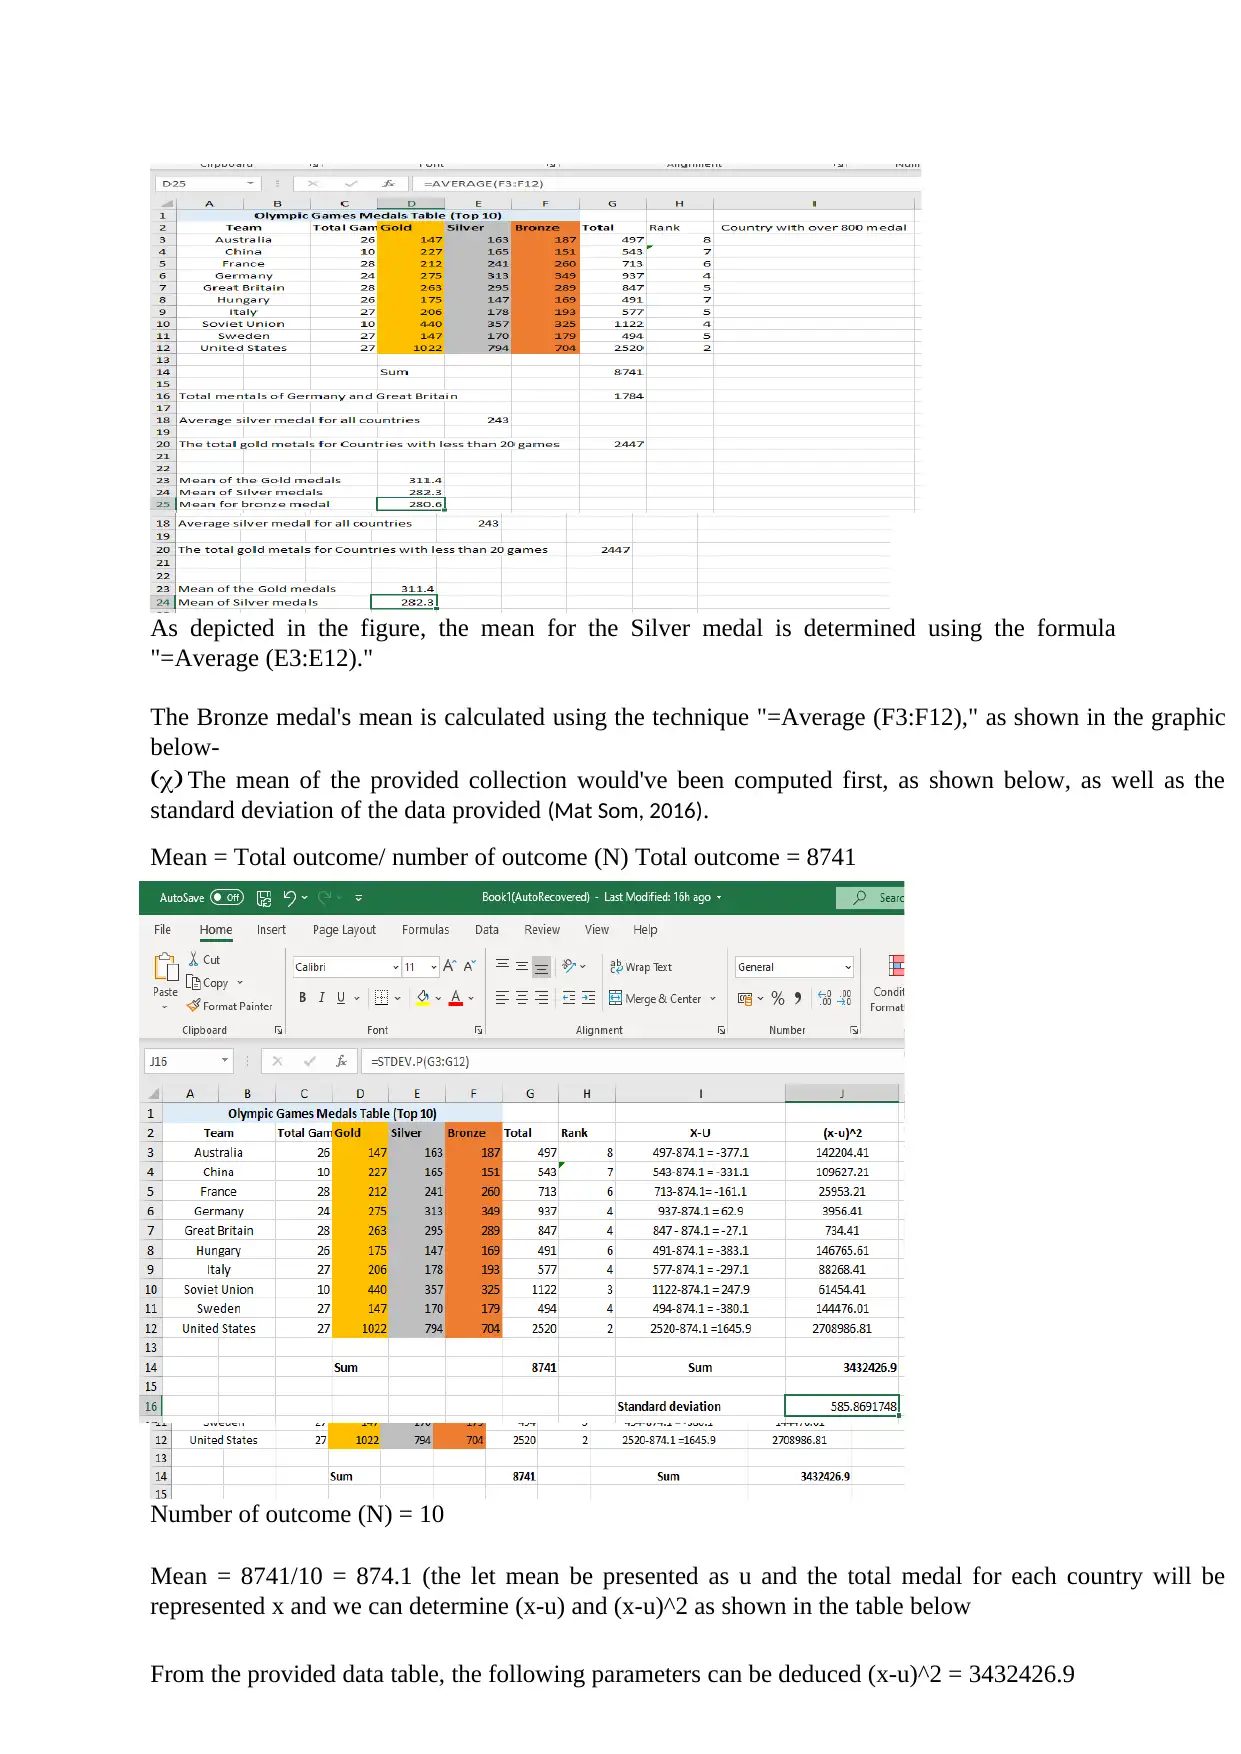
As depicted in the figure, the mean for the Silver medal is determined using the formula
"=Average (E3:E12)."
The Bronze medal's mean is calculated using the technique "=Average (F3:F12)," as shown in the graphic
below-
(c) The mean of the provided collection would've been computed first, as shown below, as well as the
standard deviation of the data provided (Mat Som, 2016).
Mean = Total outcome/ number of outcome (N) Total outcome = 8741
Number of outcome (N) = 10
Mean = 8741/10 = 874.1 (the let mean be presented as u and the total medal for each country will be
represented x and we can determine (x-u) and (x-u)^2 as shown in the table below
From the provided data table, the following parameters can be deduced (x-u)^2 = 3432426.9
√
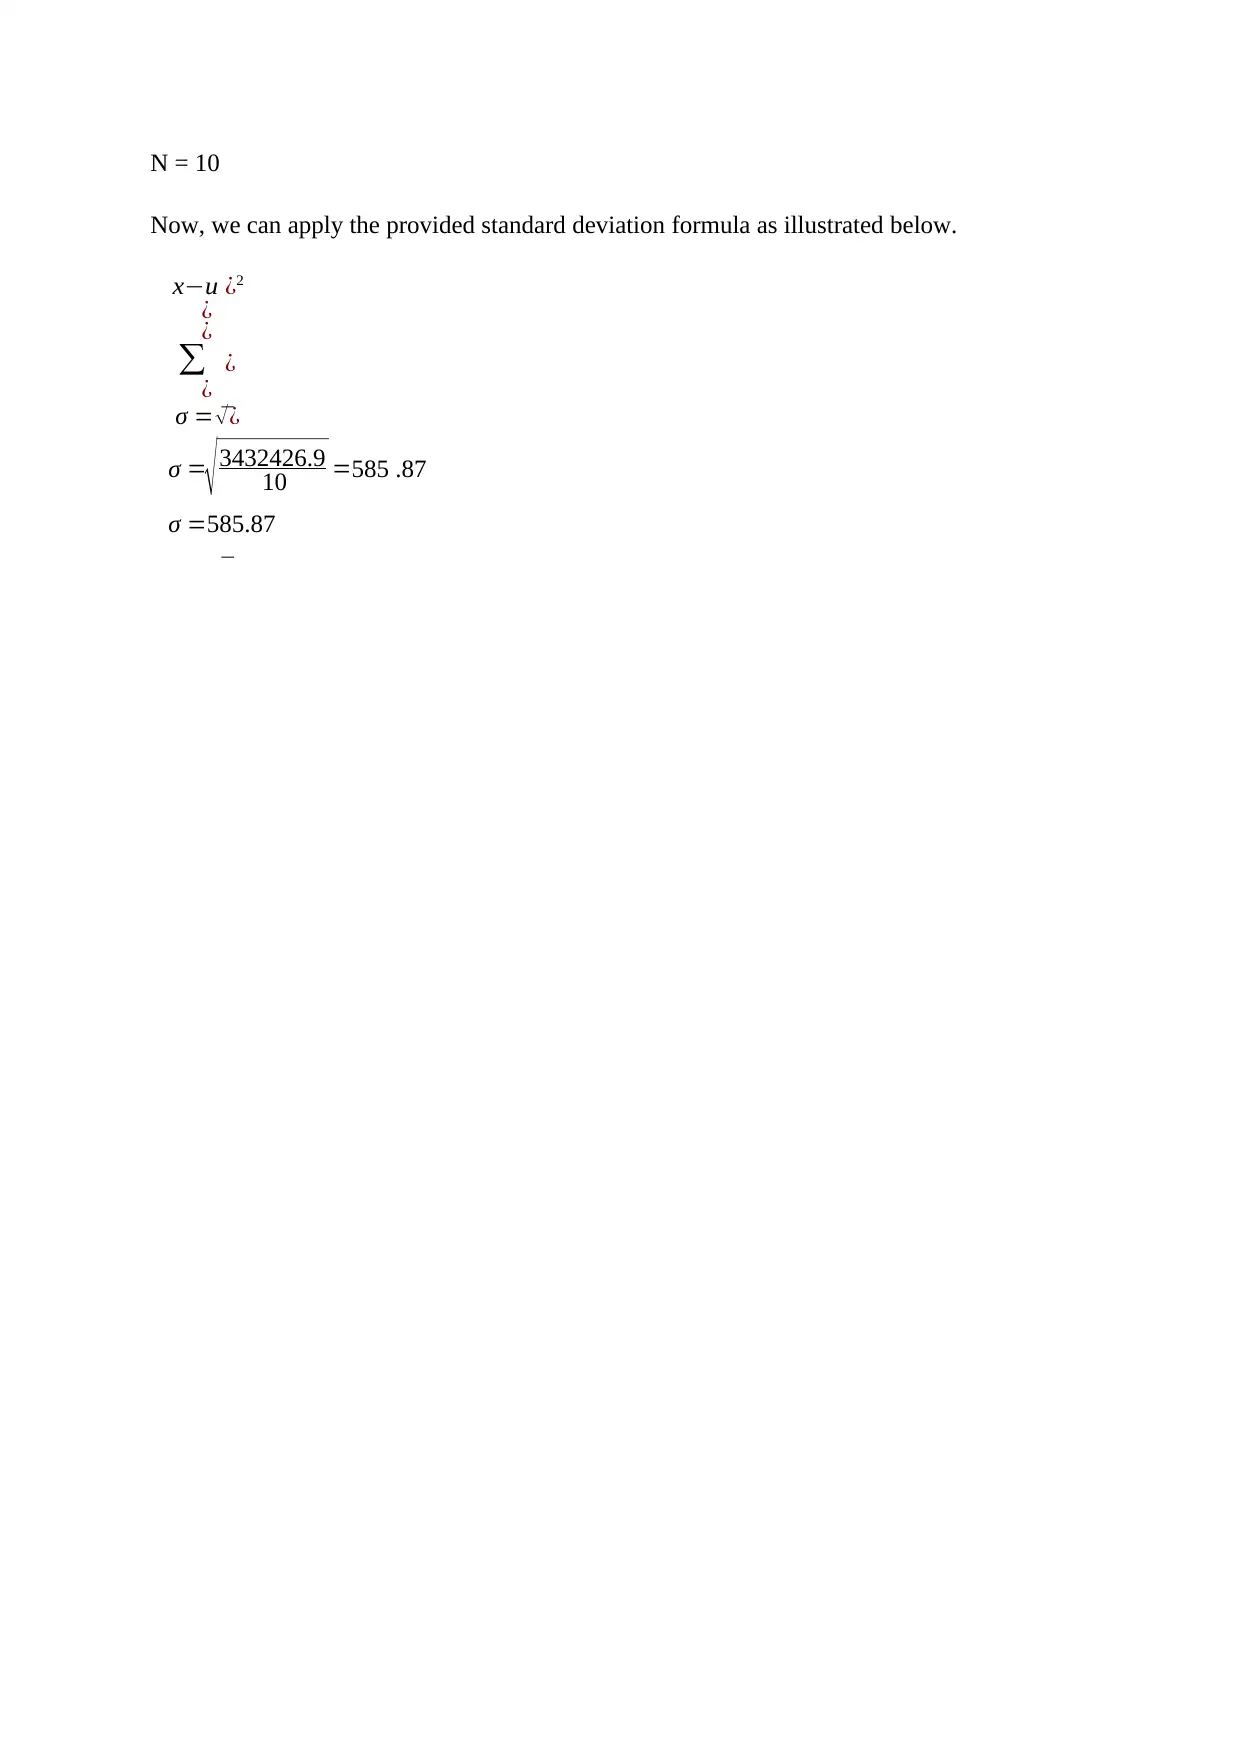
N = 10
Now, we can apply the provided standard deviation formula as illustrated below.
x−u ¿ 2
¿
¿
∑ ¿
¿
σ =√¿
σ = 3432426.9 =585 .8710
σ =585.87
N = 10
Now, we can apply the provided standard deviation formula as illustrated below.
x−u ¿ 2
¿
¿
∑ ¿
¿
σ =√¿
σ = 3432426.9 =585 .8710
σ =585.87
Secure Best Marks with AI Grader
Need help grading? Try our AI Grader for instant feedback on your assignments.
The "STDEVP" method in Excel would be used to verify and cross-check the calculated standard
deviation of medal count for each country, based on the data provided, with the results shown in
the graphic below-
The calculated standard deviation is 585.8691748, whereas the predicted standard deviation is
585.87, showing that the addition to actual is real and truthful (Metzenbaum, 2018).
(d) The projected standard deviation may be derived from the worksheet that it is crucial in
understanding the predictive method. The standard deviation is a measurement of how far a
given result deviates from the mean on average. According to the lower standard deviation it is
being determined that the results are near to mean and large deviation represent that the
information is spreading widely. In the case of supplied data, standard deviation of 585.87
indicates that the average of countries are 585.87 away from distribution's mean. In this data,
the standard deviation can be utilized to identify how far medal count of multiple countries,
such as the United States, the Soviet Union, and Australia deviate from the mean overall medal
(Sharma, Srivastava and Mago, 2019).
Question 16
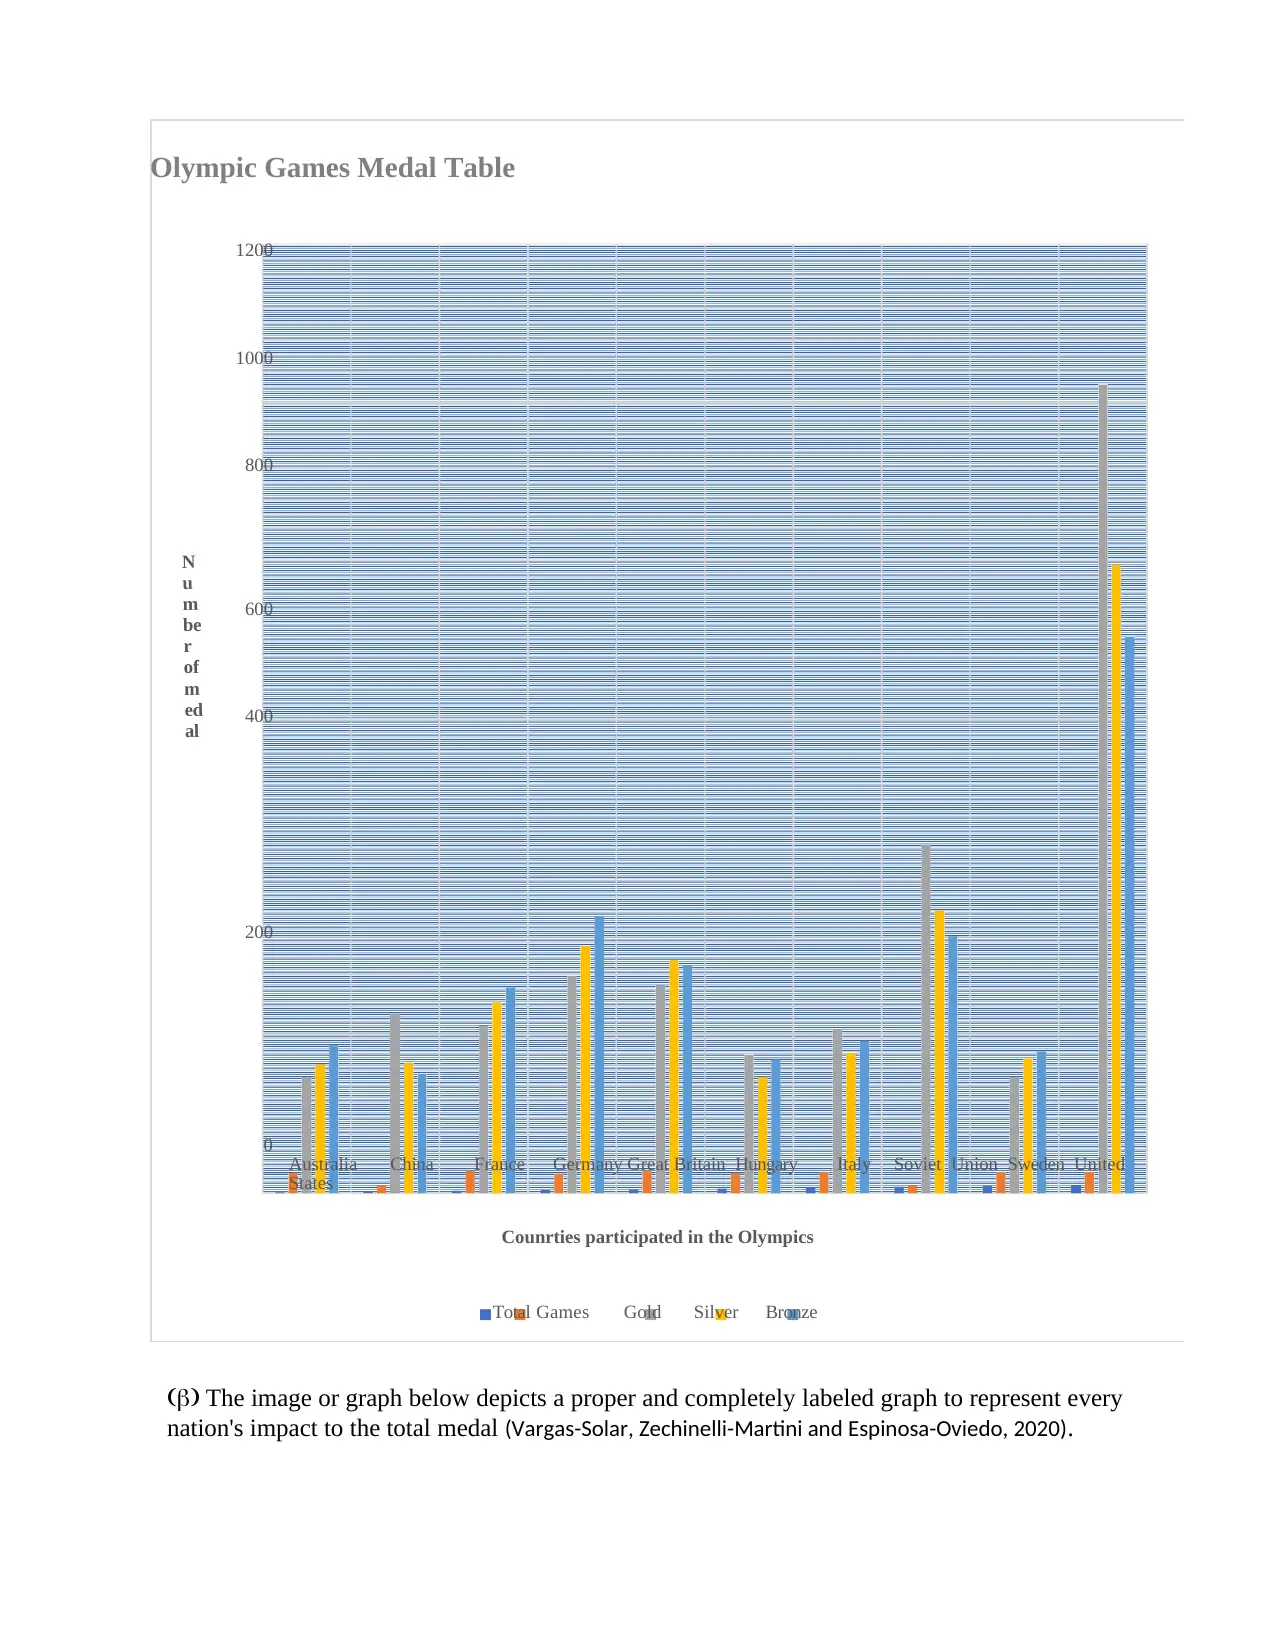
(a) > Appropriately labeled graph to contrast the 10 nations' overall gold, silver, and bronze
medals.
deviation of medal count for each country, based on the data provided, with the results shown in
the graphic below-
The calculated standard deviation is 585.8691748, whereas the predicted standard deviation is
585.87, showing that the addition to actual is real and truthful (Metzenbaum, 2018).
(d) The projected standard deviation may be derived from the worksheet that it is crucial in
understanding the predictive method. The standard deviation is a measurement of how far a
given result deviates from the mean on average. According to the lower standard deviation it is
being determined that the results are near to mean and large deviation represent that the
information is spreading widely. In the case of supplied data, standard deviation of 585.87
indicates that the average of countries are 585.87 away from distribution's mean. In this data,
the standard deviation can be utilized to identify how far medal count of multiple countries,
such as the United States, the Soviet Union, and Australia deviate from the mean overall medal
(Sharma, Srivastava and Mago, 2019).
Question 16
(a) > Appropriately labeled graph to contrast the 10 nations' overall gold, silver, and bronze
medals.
Olympic Games Medal Table
1200
1000
800
600
400
200
0
Australia China France Germany Great Britain Hungary Italy Soviet Union Sweden United
States
Counrties participated in the Olympics
Total Games Gold Silver Bronze
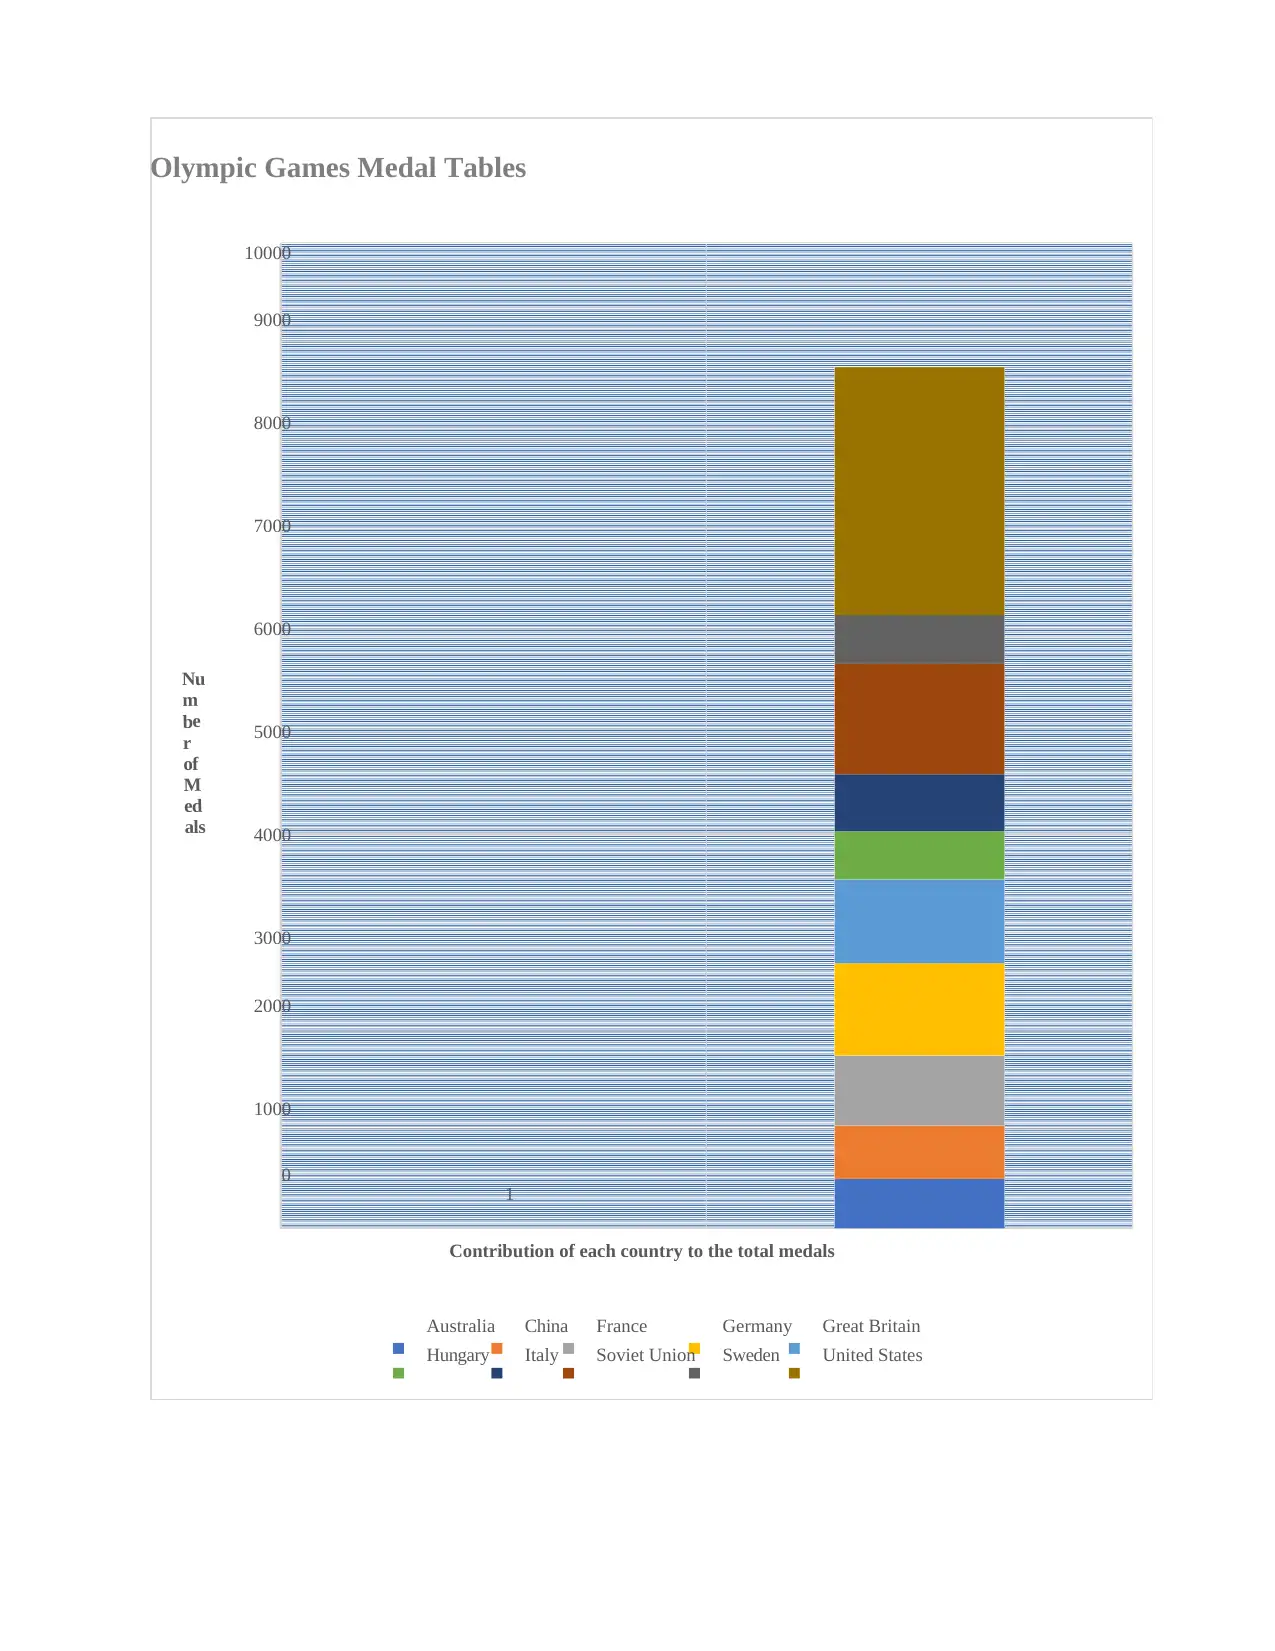
(b) The image or graph below depicts a proper and completely labeled graph to represent every
nation's impact to the total medal (Vargas-Solar, Zechinelli-Martini and Espinosa-Oviedo, 2020).
N
u
m
be
r
of
m
ed
al
1200
1000
800
600
400
200
0
Australia China France Germany Great Britain Hungary Italy Soviet Union Sweden United
States
Counrties participated in the Olympics
Total Games Gold Silver Bronze
(b) The image or graph below depicts a proper and completely labeled graph to represent every
nation's impact to the total medal (Vargas-Solar, Zechinelli-Martini and Espinosa-Oviedo, 2020).
N
u
m
be
r
of
m
ed
al
Olympic Games Medal Tables
10000
9000
8000
7000
6000
5000
4000
3000
2000
1000
0
1
Contribution of each country to the total medals
Australia China France Germany Great Britain
Hungary Italy Soviet Union Sweden United States
Nu
m
be
r
of
M
ed
als
10000
9000
8000
7000
6000
5000
4000
3000
2000
1000
0
1
Contribution of each country to the total medals
Australia China France Germany Great Britain
Hungary Italy Soviet Union Sweden United States
Nu
m
be
r
of
M
ed
als
Paraphrase This Document
Need a fresh take? Get an instant paraphrase of this document with our AI Paraphraser
Conclusion
The research provided the basic understading and assessment of the mathematics and IT
data. Quantitative competency is understood as the power to analyse and apply exact predictive
concepts. Basic numerical methods, such as dividing, multiplication, addition, and subtraction,
must be understood. Mathematics is required by person to develop logics thought and mental
skills in their everyday routines. The concept of numeracy is required for actions such as dining,
giving instructions, assessing bills, and gaming in order to keep offering answers to problems
and to develop mathematical knowledge, patterns, intervals, and shapes. Literacy and numeracy
are two concepts that could help people develop the essential abilities they really have to thrive
in society. There is a comprehensive technique for increasing arithmetic and linguistic abilities,
as well as supporting trainees in living a healthy and fulfilling life and contributing as an active
and well-informed person. This mathematics repertory is divided into three parts, each of which
must be performed separately.
References
Books and journals
Ascher, M., 2018. Mathematics elsewhere. Princeton University Press.
Craig, J., 2018. The promises of numeracy. Educational Studies in Mathematics, 99(1), pp.57-71.
Ho, F.M., Elmgren, M., Rodriguez, J.M.G., Bain, K.R. and Towns, M.H., 2019. Graphs:
Working with Models at the Crossroad between Chemistry and Mathematics. In It’s Just
Math: Research on Students’ Understanding of Chemistry and Mathematics (pp. 47-67).
American Chemical Society.
Hughes, T.J. and Sangalli, G., 2018. Mathematics of isogeometric analysis: a
conspectus. Encyclopedia of Computational Mechanics Second Edition. pp.1-40.
Kilpatrick, J., 2020. History of research in mathematics education. Encyclopedia of mathematics
education. pp.349-354.
O’Keeffe, L. and Paige, K., 2021. Re-highlighting the potential of critical
numeracy. Mathematics Education Research Journal. 33(2). pp.285-299.
Powell, S.R., Lembke, E.S., Ketterlin-Geller, L.R., Petscher, Y., Hwang, J., Bos, S.E., Cox, T.,
Hirt, S., Mason, E.N., Pruitt-Britton, T. and Thomas, E., 2021. Data-based
individualization in mathematics to support middleschool teachers and their students
with mathematics learning difficulty. Studies in Educational Evaluation. 69. p.100897.
Robson, E., 2020. Mathematics in ancient Iraq. Princeton University Press.
Rusli, R., Rahman, A. and Abdullah, H., 2020. Student perception data on online learning using
heutagogy approach in the Faculty of Mathematics and Natural Sciences of Universitas
Negeri Makassar, Indonesia. Data in brief. 29. p.105152.
Schaefer, M., 2018. Crossing numbers of graphs. CRC Press.
Sellars, M., 2018. Mathematics and Numeracy in a Global Society. In Numeracy in Authentic
Contexts (pp. 5-21). Springer, Singapore.
Tang, J.H., Ali, U., Javaid, M. and Shabbir, K., 2019. Zagreb connection indices of subdivision
and semi-total point operations on graphs. Journal of Chemistry. 2019.
Temnyh, V.I., Pushkaryeva, T.P., Kalitina, V.V. and Stepanova, T.A., 2020, July. Information
Technology in Mathematics Training. In Computer Science On-line Conference (pp.
329-339). Springer, Cham.
Yasukawa, K., Rogers, A., Jackson, K. and Street, B.V. eds., 2018. Numeracy as social practice:
global and local perspectives. Routledge.
1 out of 21
Related Documents


Your All-in-One AI-Powered Toolkit for Academic Success.
+13062052269
info@desklib.com
Available 24*7 on WhatsApp / Email
![[object Object]](/_next/static/media/star-bottom.7253800d.svg)
Unlock your academic potential
© 2024 | Zucol Services PVT LTD | All rights reserved.