Using Numeracy Data & IT Portfolio of Tasks
VerifiedAdded on 2023/06/15
|17
|4354
|287
AI Summary
This report covers the fundamentals of mathematics in relation to data and numeracy. It contains solutions to mathematical problems, effective use of data, forming charts, and applying excel functions. The report covers topics such as fractions, percentage, decimal, logical reasoning, mean, mode, median, and various excel functions with graphical representation.
Contribute Materials
Your contribution can guide someone’s learning journey. Share your
documents today.
Numeracy, Data & IT
Secure Best Marks with AI Grader
Need help grading? Try our AI Grader for instant feedback on your assignments.
Table of Contents
INTRODUCTION ..........................................................................................................................3
TASK ..............................................................................................................................................3
Part 1 Using Numeracy...............................................................................................................3
Part 2 Using Data........................................................................................................................7
Part 3 Information Technology...................................................................................................9
CONCLUSION .............................................................................................................................16
REFERENCES..............................................................................................................................17
INTRODUCTION
This report is based on the understanding of fundamentals of mathematics in relation to data
and numeracy. It will have solutions to some mathematical problems to know the basics of
mathematics and statistics and understand them better by doing. Use of spreadsheet is done
as the second and third part of this report talks about effectively using data, forming charts
and applying excel functions (Andrade, 2020). It contains topics such as, fractions,
percentage, decimal, logical reasoning, mean, mode, median and various excel function with
graphical representation.
TASK
Part 1 Using Numeracy
Question 1
Explain the terms
(a) Numerator: The word Numerator is derived from Latin verb,'enumerate' which means to
count (Bernard, and Senjayawati, 2019). It is the upper integer in the fraction which counts how
many units are considered from a whole. For example: 2/3 means the two units from a whole
which in total is divided into three units are considered. 2 here is the numerator.
(b) Denominator: The word Denominator is derived from the Latin word 'Nomen' which means
name (Harrisson, 2018). Hence the denominator of a fraction 'names' it. It is the lower part of the
fraction which tells in how much units is the whole divided. For example: 2/5 two-fifth of the
whole is considered. 5 here is the denominator, the whole is divided into 5 equal parts and only
two from these are considered.
Question 2
Express 24/40 and 18/42 in their simplest forms.
24/40 (dividing the fraction by 2)
24/40 = 12/20 = 6/10 = 3/5
3/5 is the simplest form of 24/40
18/42 (dividing the fraction by 2)
18/42= 9/21 (now dividing this further by 3)
9/21 = 3/7
3/7 is the simplest form of 18/42
Question 3
a) Express the fractions 2/3, 3/4 and 5/6 as equivalent fractions with a denominator of 12.
To convert each denominator into 12, multiplication of the whole fraction would be done
with an integer that would result in 12 as denominator.
2*4/ 3*4 = 8/12
3*3/ 4*3 = 9/12
5*2/ 6*2 = 10/12
Hence, the fractions 2/3, ¾ and 5/6 has converted with the denominator as 12 are
8/12, 9/12 and 10/12, respectively.
b) A library contains 60,000 books. 14,000 are on the subject of business, 22,000 are on
healthcare and 12,000 on psychology and law. What percentage of the library’s books is on
computing, if computing books make up two-thirds of the remainder?
Total Books in the library are= 60000
Business Books= 14000
Healthcare Books= 22000
Psychology and law books= 12000
Remaining books in the library are= 60000-(14000+22000+12000)
= 12000
Books on computing are= 12000*2/3 = 8000
Percentage of computing books in the library are= 8000/60000*100
= 13.3%
Question 4
A sports shop in Manchester is doing a sale on some merchandise. Liz hears about it and goes to
make a purchase of two pairs of running shoes. She gives the sales attendant in the store three
crisp £50 notes and is given change of £10.50. What is the price of each pair of running shoes?
Show your working.
Total amount given by her to the shop= 50* 3= £150
Change she received= £10.50
Total cost of two pair of shoes= £150-£10.50 = £139.5
Cost per pair of shoes= £139.5/2 = £69.75
Secure Best Marks with AI Grader
Need help grading? Try our AI Grader for instant feedback on your assignments.
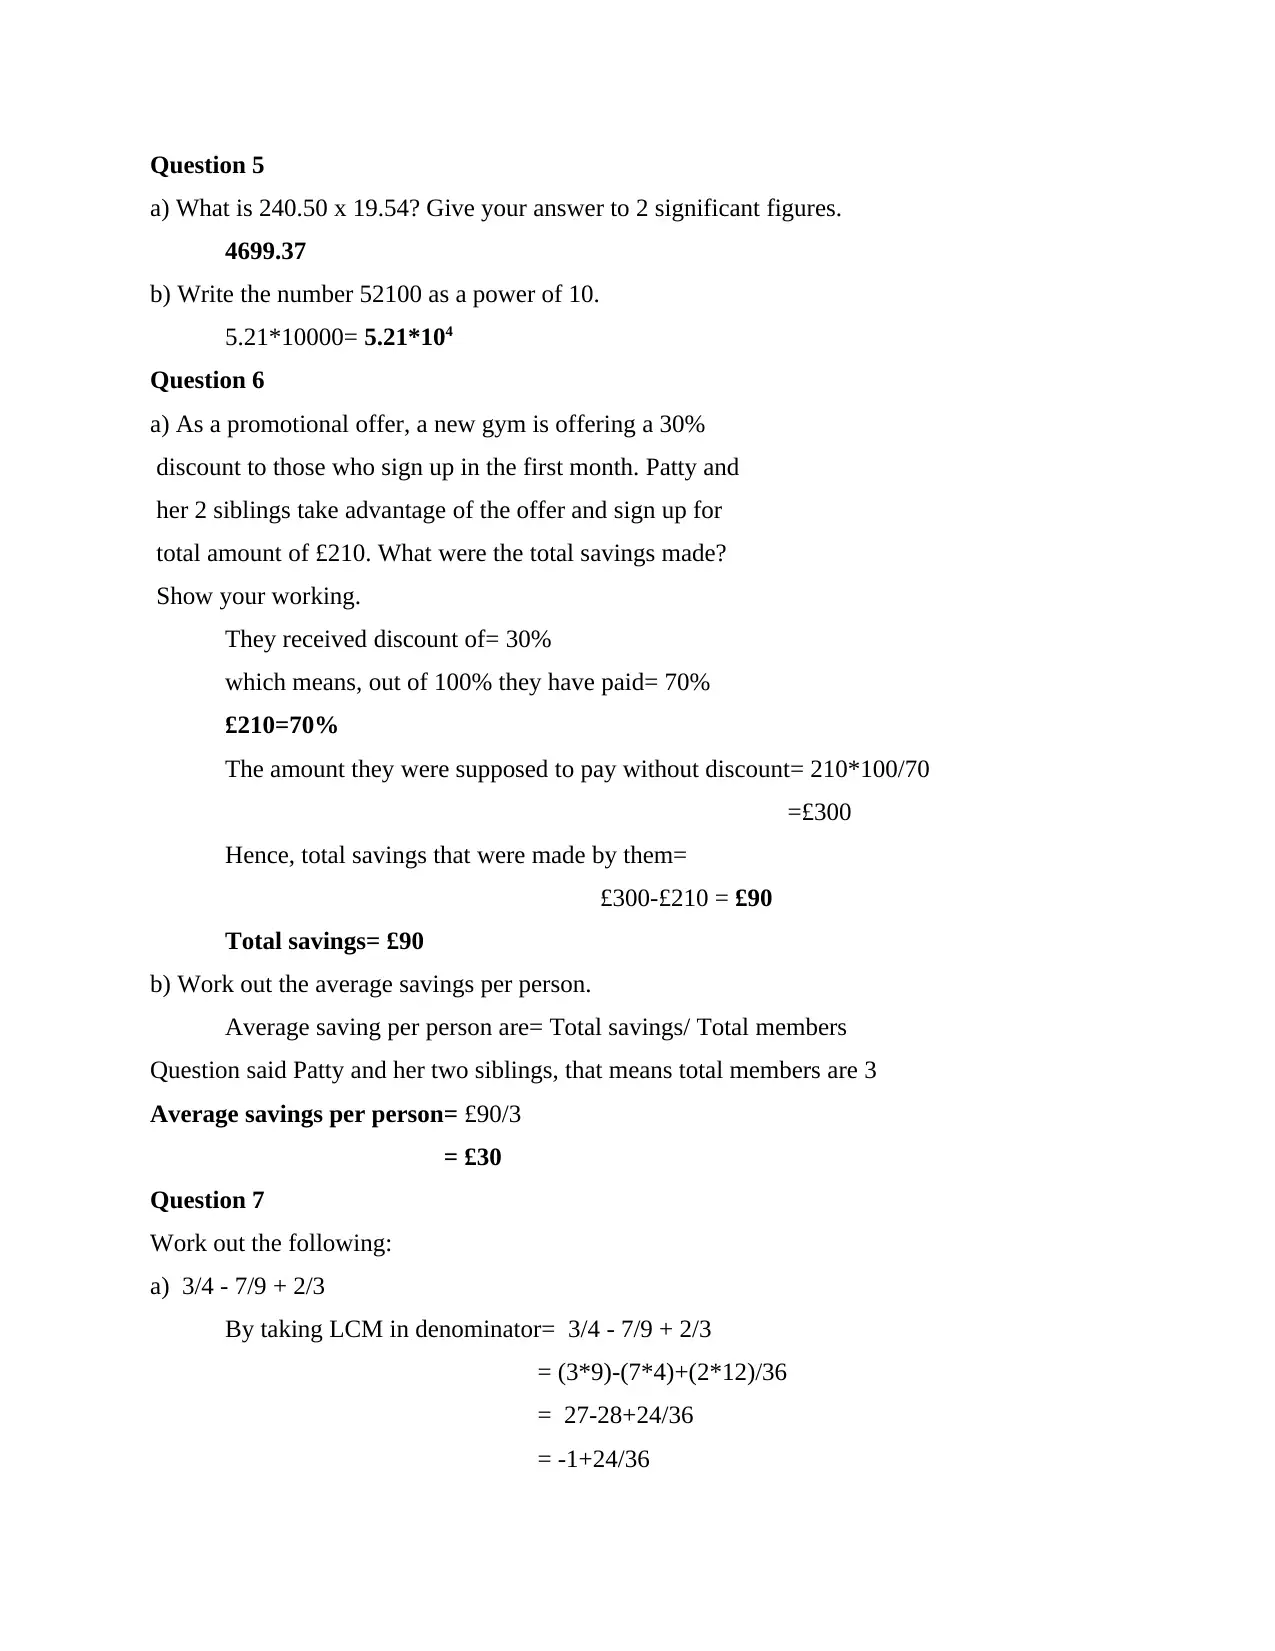
Question 5
a) What is 240.50 x 19.54? Give your answer to 2 significant figures.
4699.37
b) Write the number 52100 as a power of 10.
5.21*10000= 5.21*104
Question 6
a) As a promotional offer, a new gym is offering a 30%
discount to those who sign up in the first month. Patty and
her 2 siblings take advantage of the offer and sign up for
total amount of £210. What were the total savings made?
Show your working.
They received discount of= 30%
which means, out of 100% they have paid= 70%
£210=70%
The amount they were supposed to pay without discount= 210*100/70
=£300
Hence, total savings that were made by them=
£300-£210 = £90
Total savings= £90
b) Work out the average savings per person.
Average saving per person are= Total savings/ Total members
Question said Patty and her two siblings, that means total members are 3
Average savings per person= £90/3
= £30
Question 7
Work out the following:
a) 3/4 - 7/9 + 2/3
By taking LCM in denominator= 3/4 - 7/9 + 2/3
= (3*9)-(7*4)+(2*12)/36
= 27-28+24/36
= -1+24/36
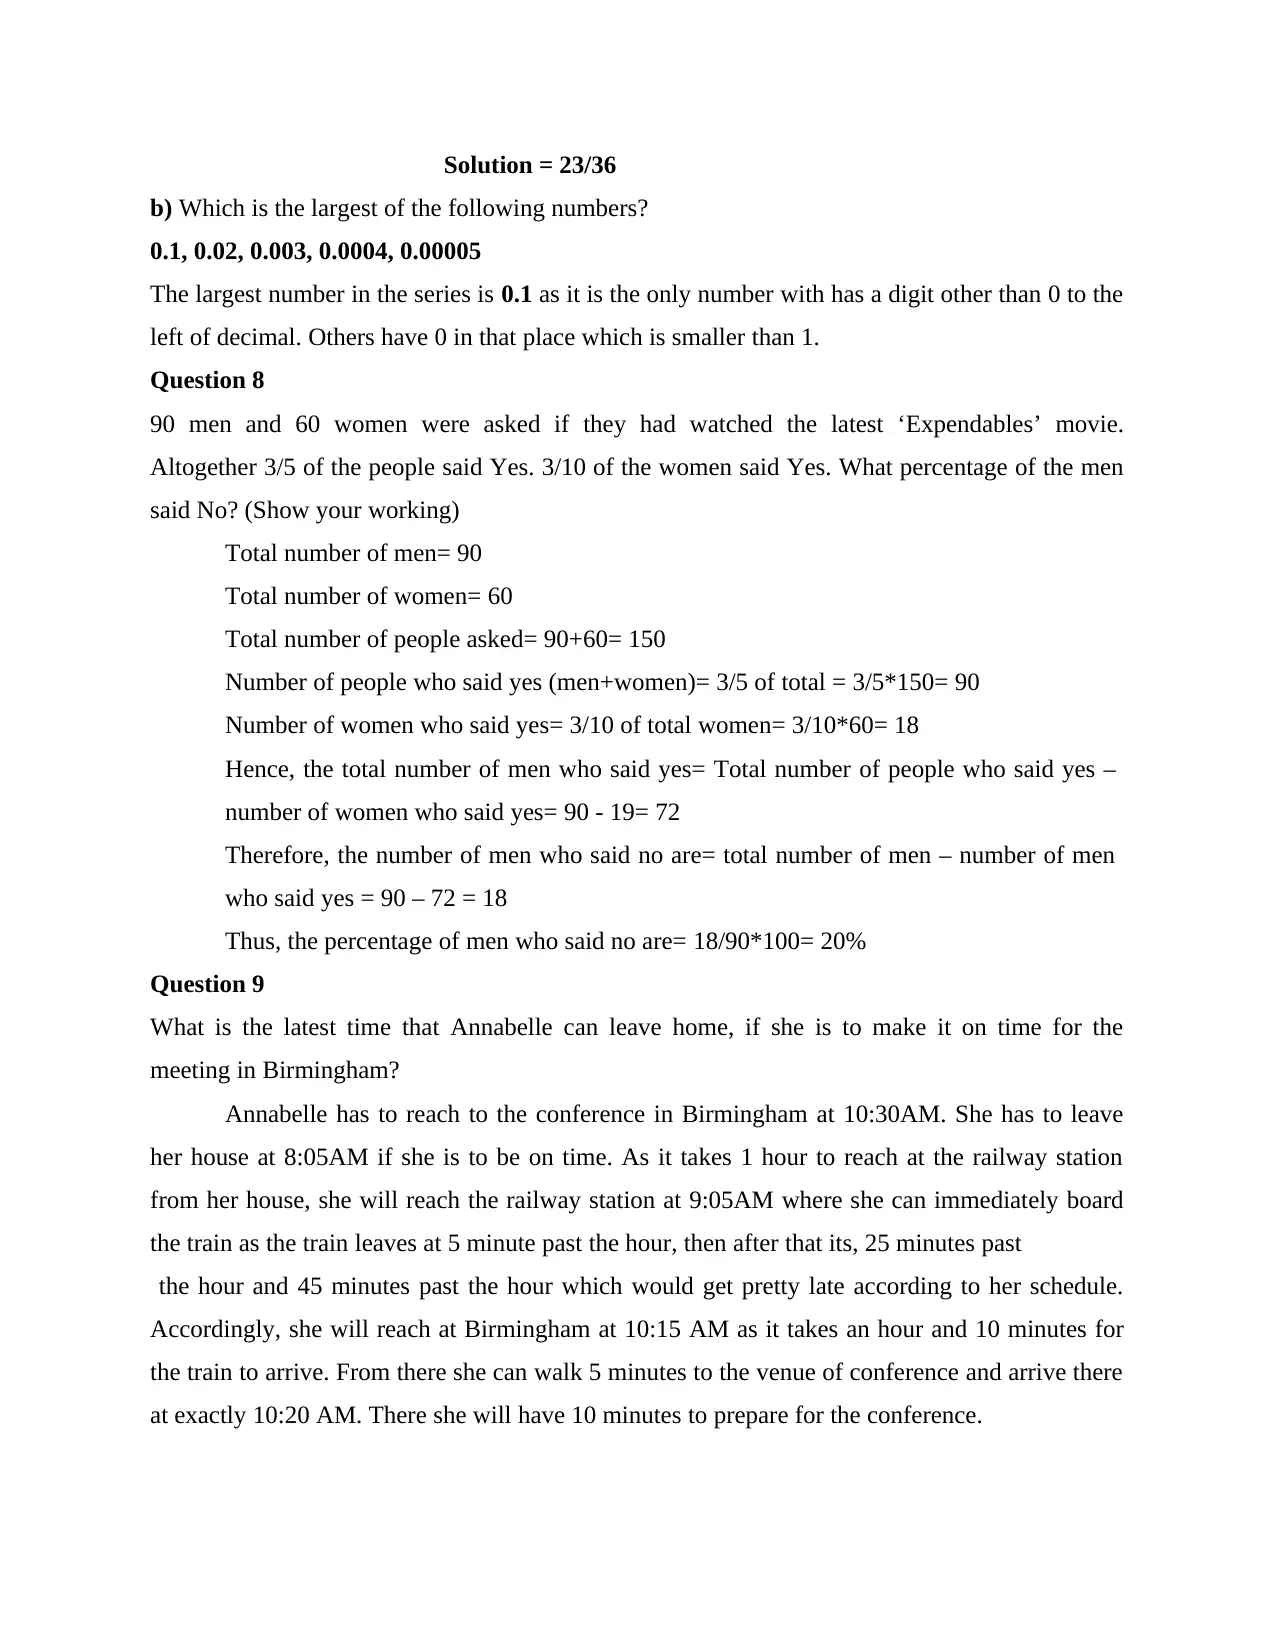
Solution = 23/36
b) Which is the largest of the following numbers?
0.1, 0.02, 0.003, 0.0004, 0.00005
The largest number in the series is 0.1 as it is the only number with has a digit other than 0 to the
left of decimal. Others have 0 in that place which is smaller than 1.
Question 8
90 men and 60 women were asked if they had watched the latest ‘Expendables’ movie.
Altogether 3/5 of the people said Yes. 3/10 of the women said Yes. What percentage of the men
said No? (Show your working)
Total number of men= 90
Total number of women= 60
Total number of people asked= 90+60= 150
Number of people who said yes (men+women)= 3/5 of total = 3/5*150= 90
Number of women who said yes= 3/10 of total women= 3/10*60= 18
Hence, the total number of men who said yes= Total number of people who said yes –
number of women who said yes= 90 - 19= 72
Therefore, the number of men who said no are= total number of men – number of men
who said yes = 90 – 72 = 18
Thus, the percentage of men who said no are= 18/90*100= 20%
Question 9
What is the latest time that Annabelle can leave home, if she is to make it on time for the
meeting in Birmingham?
Annabelle has to reach to the conference in Birmingham at 10:30AM. She has to leave
her house at 8:05AM if she is to be on time. As it takes 1 hour to reach at the railway station
from her house, she will reach the railway station at 9:05AM where she can immediately board
the train as the train leaves at 5 minute past the hour, then after that its, 25 minutes past
the hour and 45 minutes past the hour which would get pretty late according to her schedule.
Accordingly, she will reach at Birmingham at 10:15 AM as it takes an hour and 10 minutes for
the train to arrive. From there she can walk 5 minutes to the venue of conference and arrive there
at exactly 10:20 AM. There she will have 10 minutes to prepare for the conference.
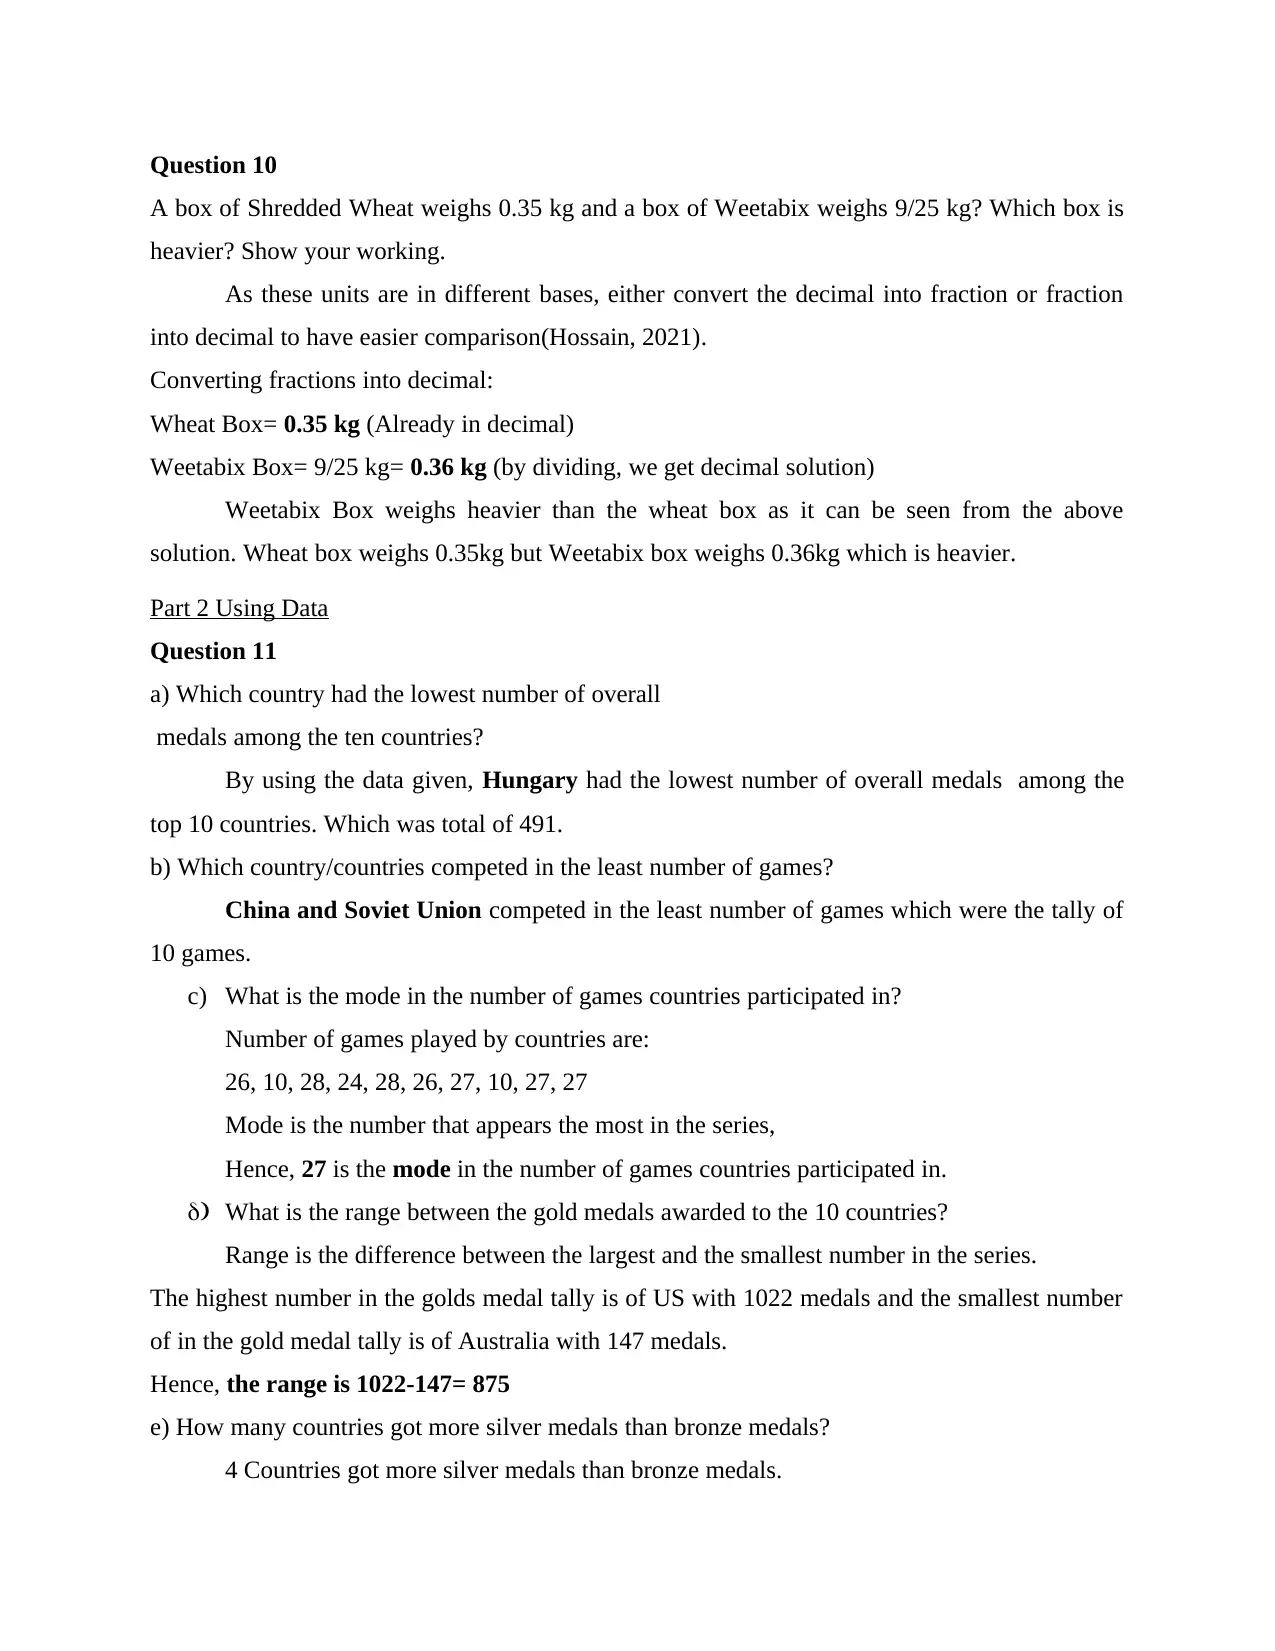
Question 10
A box of Shredded Wheat weighs 0.35 kg and a box of Weetabix weighs 9/25 kg? Which box is
heavier? Show your working.
As these units are in different bases, either convert the decimal into fraction or fraction
into decimal to have easier comparison(Hossain, 2021).
Converting fractions into decimal:
Wheat Box= 0.35 kg (Already in decimal)
Weetabix Box= 9/25 kg= 0.36 kg (by dividing, we get decimal solution)
Weetabix Box weighs heavier than the wheat box as it can be seen from the above
solution. Wheat box weighs 0.35kg but Weetabix box weighs 0.36kg which is heavier.
Part 2 Using Data
Question 11
a) Which country had the lowest number of overall
medals among the ten countries?
By using the data given, Hungary had the lowest number of overall medals among the
top 10 countries. Which was total of 491.
b) Which country/countries competed in the least number of games?
China and Soviet Union competed in the least number of games which were the tally of
10 games.
c) What is the mode in the number of games countries participated in?
Number of games played by countries are:
26, 10, 28, 24, 28, 26, 27, 10, 27, 27
Mode is the number that appears the most in the series,
Hence, 27 is the mode in the number of games countries participated in.
d) What is the range between the gold medals awarded to the 10 countries?
Range is the difference between the largest and the smallest number in the series.
The highest number in the golds medal tally is of US with 1022 medals and the smallest number
of in the gold medal tally is of Australia with 147 medals.
Hence, the range is 1022-147= 875
e) How many countries got more silver medals than bronze medals?
4 Countries got more silver medals than bronze medals.
Paraphrase This Document
Need a fresh take? Get an instant paraphrase of this document with our AI Paraphraser
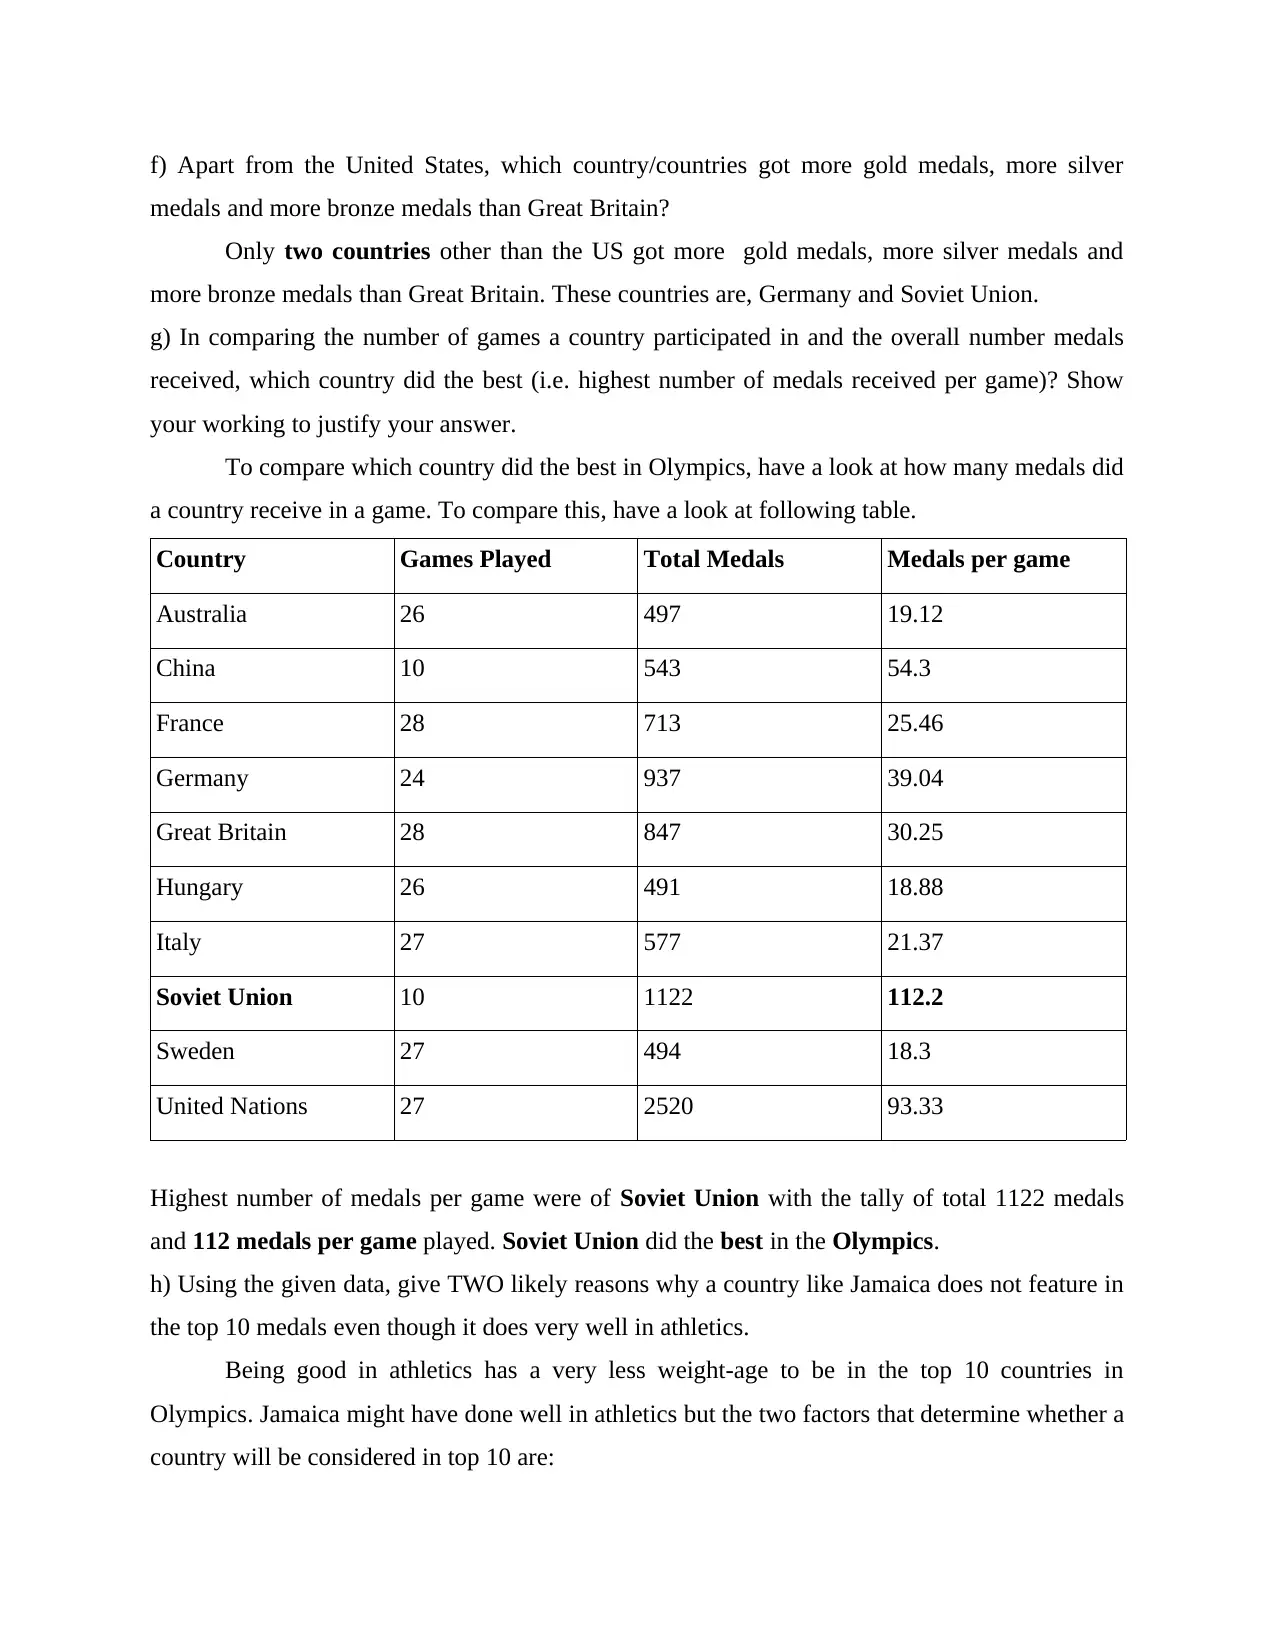
f) Apart from the United States, which country/countries got more gold medals, more silver
medals and more bronze medals than Great Britain?
Only two countries other than the US got more gold medals, more silver medals and
more bronze medals than Great Britain. These countries are, Germany and Soviet Union.
g) In comparing the number of games a country participated in and the overall number medals
received, which country did the best (i.e. highest number of medals received per game)? Show
your working to justify your answer.
To compare which country did the best in Olympics, have a look at how many medals did
a country receive in a game. To compare this, have a look at following table.
Country Games Played Total Medals Medals per game
Australia 26 497 19.12
China 10 543 54.3
France 28 713 25.46
Germany 24 937 39.04
Great Britain 28 847 30.25
Hungary 26 491 18.88
Italy 27 577 21.37
Soviet Union 10 1122 112.2
Sweden 27 494 18.3
United Nations 27 2520 93.33
Highest number of medals per game were of Soviet Union with the tally of total 1122 medals
and 112 medals per game played. Soviet Union did the best in the Olympics.
h) Using the given data, give TWO likely reasons why a country like Jamaica does not feature in
the top 10 medals even though it does very well in athletics.
Being good in athletics has a very less weight-age to be in the top 10 countries in
Olympics. Jamaica might have done well in athletics but the two factors that determine whether a
country will be considered in top 10 are:
The total number of medals won in the Olympics
Number games played in the Olympics and medals per games.
Jamaica has lower of two so it was not considered in the top 10 countries in Olympics.
I) Using the given information, determine the medal category in which the United States far
outperformed its closest competitor. Show your working to justify your answer.
United Nations closest competitor is Soviet Union with 1122 total medals tally.
By comparing the medals won by US and Soviet Union, US has 1022 gold medals but Soviet
Union only won 440 gold medals, US is 582 medals higher than its closest competitor. US won
794 silver medals but Soviet Union has only won 357, which is 437 medals less than the US. US
won 704 bronze medal while soviet union was at 325 tally, being 379 medals less. That being
mentioned, US outperformed its closest competitor Soviet Union in the gold medals tally with
the difference being 582 medals.
J) Which 3 countries had the most evenly distributed number of gold, silver and bronze medals
(i.e. smallest range) ? Show your working.
The three countries that have the most evenly distributed number of gold, silver and bronze
medals are, Hungary, Italy with range of 28 between the medal count, Great Britain and Sweden
with the range of 32 each between the medal counts. These countries have evenly distributed
number of medals. The answer is achieved by calculating the range of each countries medal
count with highest and lowest medals from gold, silver and bronze. Range is calculated as
Highest medal count of a country less the lowest medal count of the same counrty.
Hungary=175-169= 28
Italy= 206-178= 28
Great Britain= 295-263= 32
Sweden= 179-147= 32
Part 3 Information Technology
Question 12.
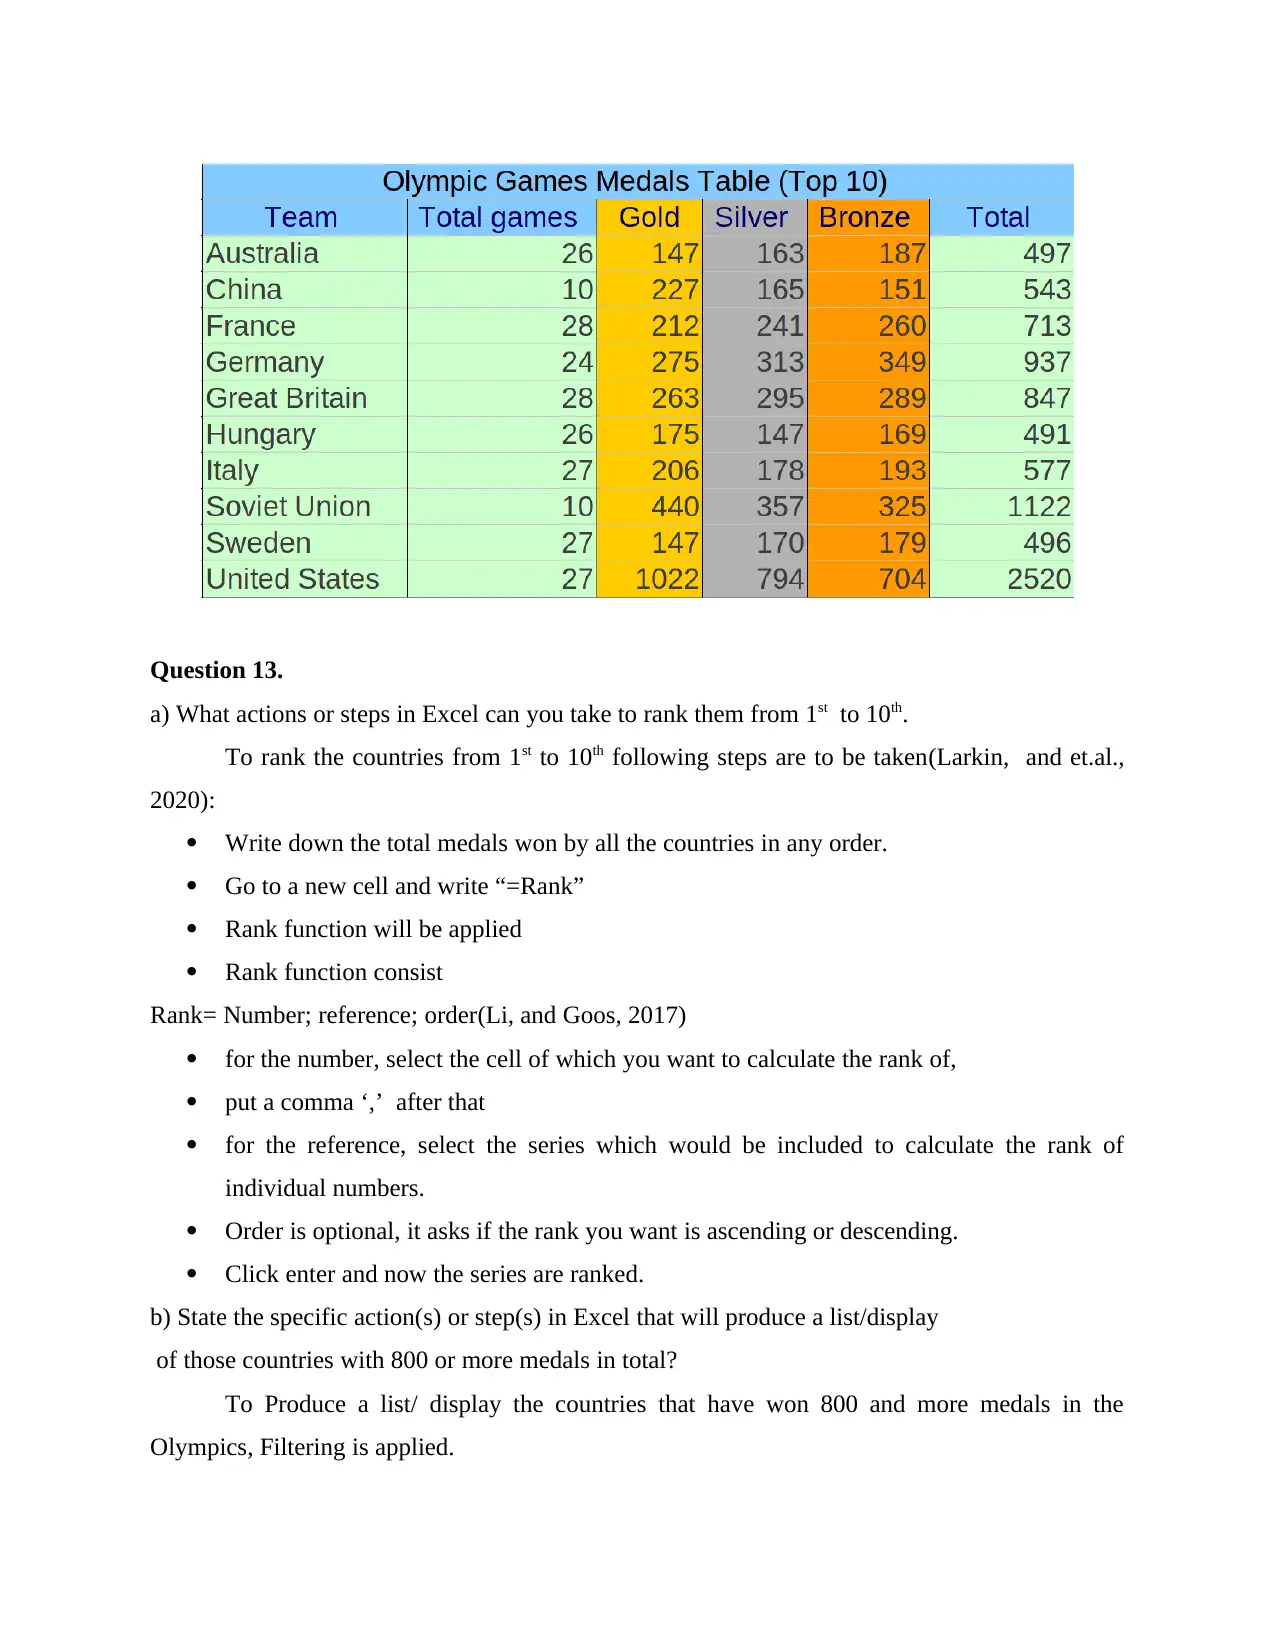
Create the spreadsheet below using Excel. Include the rows and columns identifiers, text
formatting and column highlighting as shown.
Number games played in the Olympics and medals per games.
Jamaica has lower of two so it was not considered in the top 10 countries in Olympics.
I) Using the given information, determine the medal category in which the United States far
outperformed its closest competitor. Show your working to justify your answer.
United Nations closest competitor is Soviet Union with 1122 total medals tally.
By comparing the medals won by US and Soviet Union, US has 1022 gold medals but Soviet
Union only won 440 gold medals, US is 582 medals higher than its closest competitor. US won
794 silver medals but Soviet Union has only won 357, which is 437 medals less than the US. US
won 704 bronze medal while soviet union was at 325 tally, being 379 medals less. That being
mentioned, US outperformed its closest competitor Soviet Union in the gold medals tally with
the difference being 582 medals.
J) Which 3 countries had the most evenly distributed number of gold, silver and bronze medals
(i.e. smallest range) ? Show your working.
The three countries that have the most evenly distributed number of gold, silver and bronze
medals are, Hungary, Italy with range of 28 between the medal count, Great Britain and Sweden
with the range of 32 each between the medal counts. These countries have evenly distributed
number of medals. The answer is achieved by calculating the range of each countries medal
count with highest and lowest medals from gold, silver and bronze. Range is calculated as
Highest medal count of a country less the lowest medal count of the same counrty.
Hungary=175-169= 28
Italy= 206-178= 28
Great Britain= 295-263= 32
Sweden= 179-147= 32
Part 3 Information Technology
Question 12.
Create the spreadsheet below using Excel. Include the rows and columns identifiers, text
formatting and column highlighting as shown.
Question 13.
a) What actions or steps in Excel can you take to rank them from 1st to 10th.
To rank the countries from 1st to 10th following steps are to be taken(Larkin, and et.al.,
2020):
Write down the total medals won by all the countries in any order.
Go to a new cell and write “=Rank”
Rank function will be applied
Rank function consist
Rank= Number; reference; order(Li, and Goos, 2017)
for the number, select the cell of which you want to calculate the rank of,
put a comma ‘,’ after that
for the reference, select the series which would be included to calculate the rank of
individual numbers.
Order is optional, it asks if the rank you want is ascending or descending.
Click enter and now the series are ranked.
b) State the specific action(s) or step(s) in Excel that will produce a list/display
of those countries with 800 or more medals in total?
To Produce a list/ display the countries that have won 800 and more medals in the
Olympics, Filtering is applied.
Secure Best Marks with AI Grader
Need help grading? Try our AI Grader for instant feedback on your assignments.
To apply Filters, following steps are done(Obersteiner, and et.al., 2019)
First select the series of total medals won from above
Then go to “DATA” which is above tool bar
From there, go to filter and apply filter.
Then click on the arrow above the series
Then go to number filters and select “Greater than or equal to”
The custom auto filter bar would appear, in that write 800 against the greater than or
equal to. This would give the filter an insight what is being asked
Click enter and the cells with more than 800 in the series would appear.
There are 4 countries who won more than 800 medals in total.
c) Which type of graph will be suitable for representing only gold medals information?
As the question is asking just for the gold medals, regular bar graph would be suitable as
there are only two set of information, countries and gold medals won by them. For these two set
of information bar graph would be sufficient.
d) What Excel formula can be used to calculate the overall total medals awarded?
To calculate the overall total medals awarded to the countries, SUM function would be
applied in the series of total medals won. SUM would be applied(Ramachandran, and Tsokos,
2020) and all the cells containing the number of total medals won by a country would be selected
and the answer, i.e. 8743 would be received.
Question 14.
Write the Excel functions for the following
a) Give the total number of medals for Germany and Great Britain.
The total number of medals won by Germany and Great Britain are, 1784
And the excel function to reach the answer is:
=G6+G7
b) Give the average number of silver medals for a European country
The average number of silver medals for a European country are 13.22 which will be considered
as 13. The function done in excel to calculate this is:
=total number of silver medals won by Soviet Union/total countries
=E10/27
=357/27
Note: it is assumed that currently there are 27 countries in Soviet Union
c) Sum the Medals Total for Gold for those countries with less than 20
games involvement.
The sum of the gold medals tally for those countries with less than 20 games involvement
are 667. China and Soviet Union had 10 games involvement and the total of their gold medals is
667.
The function used in excel to come up with this answer is SUMIF, following is the function we
used.
=SUMIF(C3:C12,"<20",D3:D12)
d) Search the database (the whole spreadsheet) to find ‘Italy’ and also the
corresponding Medals Total.
To find Italy in the whole spreadsheet, following steps will be followed:
Go to home in the toolbar
From there tap on find and select
Go to find
In find what write, Italy
Italy will be highlighted and its corresponding medals values will be found.
Question 15.
By using Microsoft Excel and provide screenshots:
a) Calculate the median number of medals for each medal type, stating the formula you would
use for determining the median for the gold medals.
Median is the value separating the higher half from the lower half of a set of data.
For this, Median function in the excel is used.
Median for Gold medals is: 219.5
Median for Silver medal is 209.5
Median for Bronze medals is 226.5
Median function used for Gold medals = MEDIAN(D3:D12)
b) Calculate the mean number of medals for each of the 3 medal types, stating the formula you
would use for determining the mean for the bronze medals.
Mean is the average of the most common vale in the series.
Function that is used in excel to calculate mean is AVERAGE.
Mean of Gold medals is 311.4
Mean of silver medals is 282.3
Mean for bronze medals is 280.6
Mean function used for Bronze medals is =AVERAGE(F3:F12)
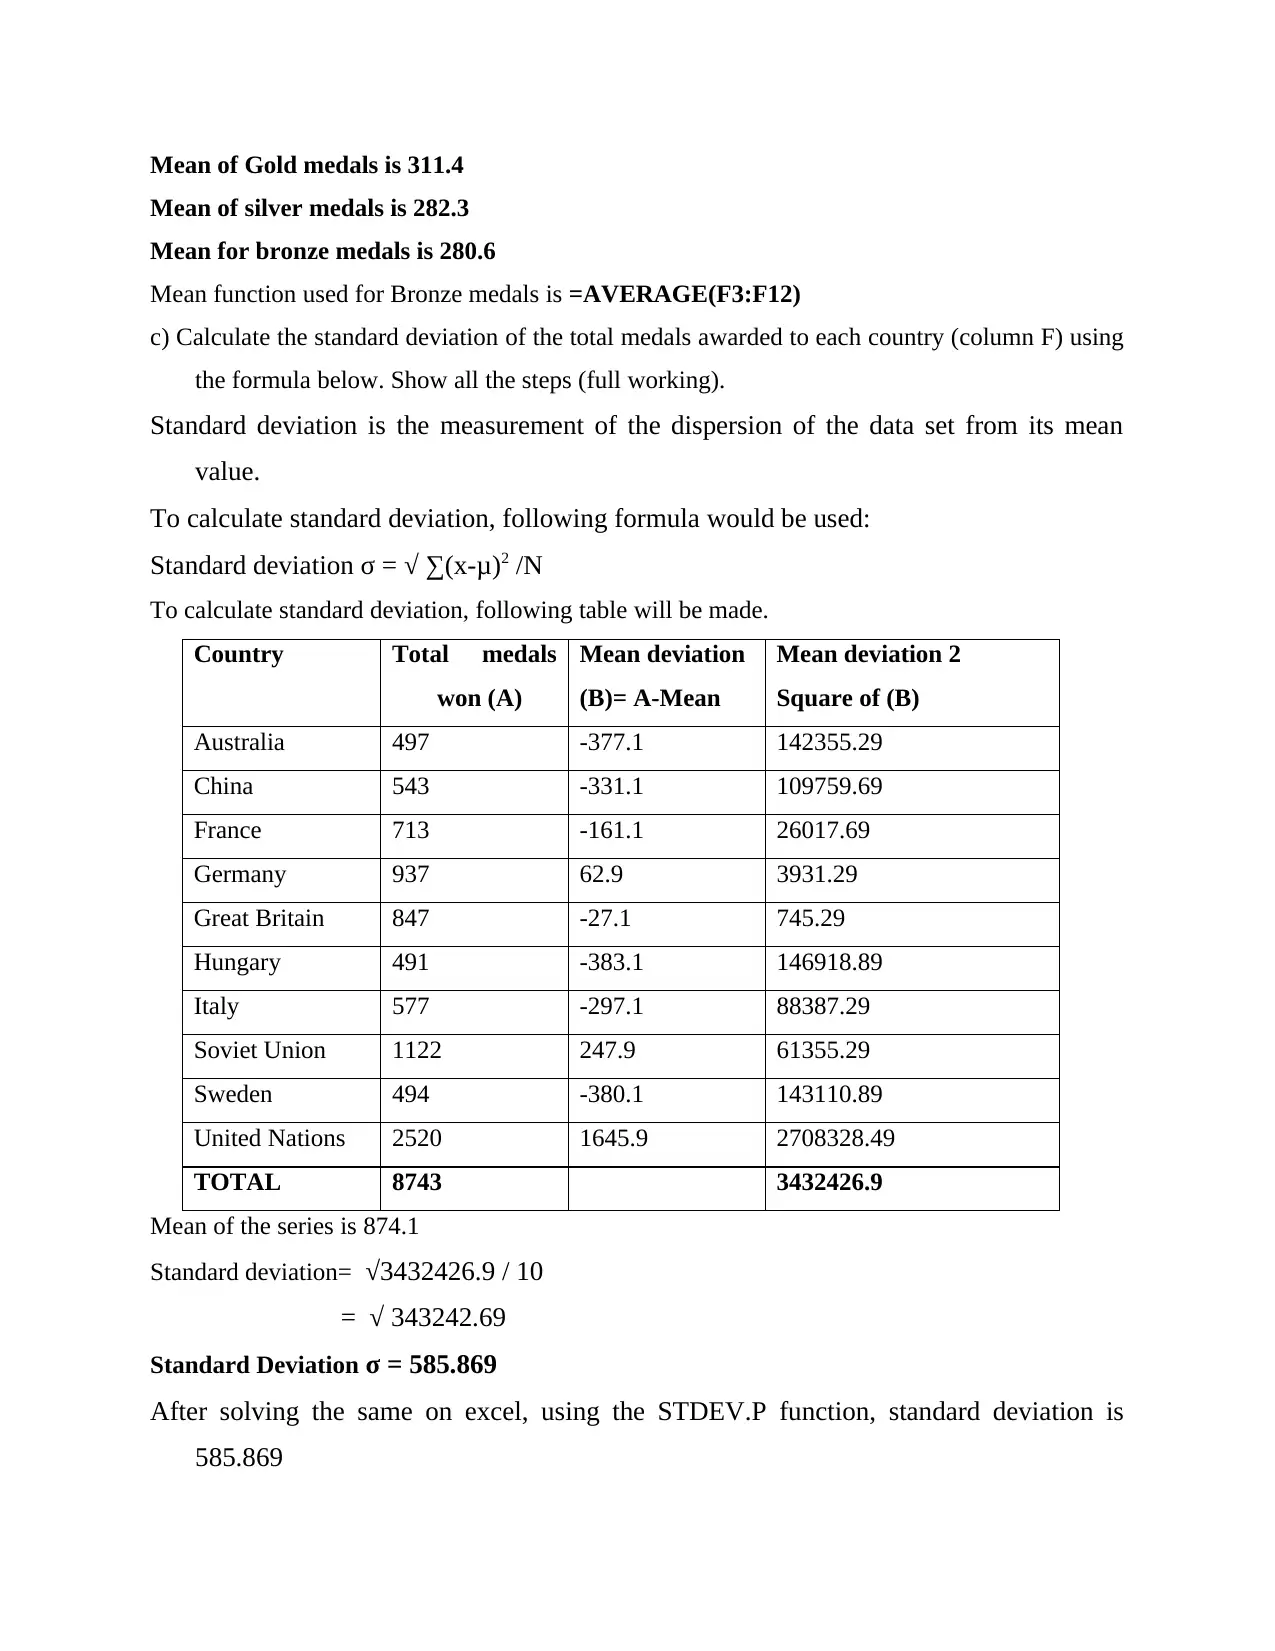
c) Calculate the standard deviation of the total medals awarded to each country (column F) using
the formula below. Show all the steps (full working).
Standard deviation is the measurement of the dispersion of the data set from its mean
value.
To calculate standard deviation, following formula would be used:
Standard deviation σ = √ ∑(x-μ)2 /N
To calculate standard deviation, following table will be made.
Country Total medals
won (A)
Mean deviation
(B)= A-Mean
Mean deviation 2
Square of (B)
Australia 497 -377.1 142355.29
China 543 -331.1 109759.69
France 713 -161.1 26017.69
Germany 937 62.9 3931.29
Great Britain 847 -27.1 745.29
Hungary 491 -383.1 146918.89
Italy 577 -297.1 88387.29
Soviet Union 1122 247.9 61355.29
Sweden 494 -380.1 143110.89
United Nations 2520 1645.9 2708328.49
TOTAL 8743 3432426.9
Mean of the series is 874.1
Standard deviation= √3432426.9 / 10
= √ 343242.69
Standard Deviation σ = 585.869
After solving the same on excel, using the STDEV.P function, standard deviation is
585.869
Mean of silver medals is 282.3
Mean for bronze medals is 280.6
Mean function used for Bronze medals is =AVERAGE(F3:F12)
c) Calculate the standard deviation of the total medals awarded to each country (column F) using
the formula below. Show all the steps (full working).
Standard deviation is the measurement of the dispersion of the data set from its mean
value.
To calculate standard deviation, following formula would be used:
Standard deviation σ = √ ∑(x-μ)2 /N
To calculate standard deviation, following table will be made.
Country Total medals
won (A)
Mean deviation
(B)= A-Mean
Mean deviation 2
Square of (B)
Australia 497 -377.1 142355.29
China 543 -331.1 109759.69
France 713 -161.1 26017.69
Germany 937 62.9 3931.29
Great Britain 847 -27.1 745.29
Hungary 491 -383.1 146918.89
Italy 577 -297.1 88387.29
Soviet Union 1122 247.9 61355.29
Sweden 494 -380.1 143110.89
United Nations 2520 1645.9 2708328.49
TOTAL 8743 3432426.9
Mean of the series is 874.1
Standard deviation= √3432426.9 / 10
= √ 343242.69
Standard Deviation σ = 585.869
After solving the same on excel, using the STDEV.P function, standard deviation is
585.869
Paraphrase This Document
Need a fresh take? Get an instant paraphrase of this document with our AI Paraphraser
To apply STDEV.P function in excel:
apply the function =STDEV.P
Select the set of data that is required to calculate standard deviation\
click enter.
d) Using the given spreadsheet as a basis, discuss the
usefulness of a standard deviation in a given dataset.
You need to cite any literature sources you use
Standard deviation is a measure of how spread the data set is (Sarka, 2021). Standard deviation is
more than just mean. It calculates how much the values in a series are deviated from the set
mean on average. This makes the basis of standard deviation. In the given set of data,
standard deviation is useful to measure how the total medals won by the countries are
getting deviated from the mean on average . The more deviation there is means that the
dataset is spread more. Standard deviation like any other tool in statistics is useful to analyse
the data. In the above series it helped to identify how much deviation is there among the
individual countries from the mean of the medals won by all of them together. A smaller
standard deviation means that your data is more assembled around the mean. A larger
standard deviation means that your data tends to be more dispersed out from the mean
(Zorić, 2021). It can help to show how ‘extreme’ an observation is. Here, US and Hungary
are highly dispersed.
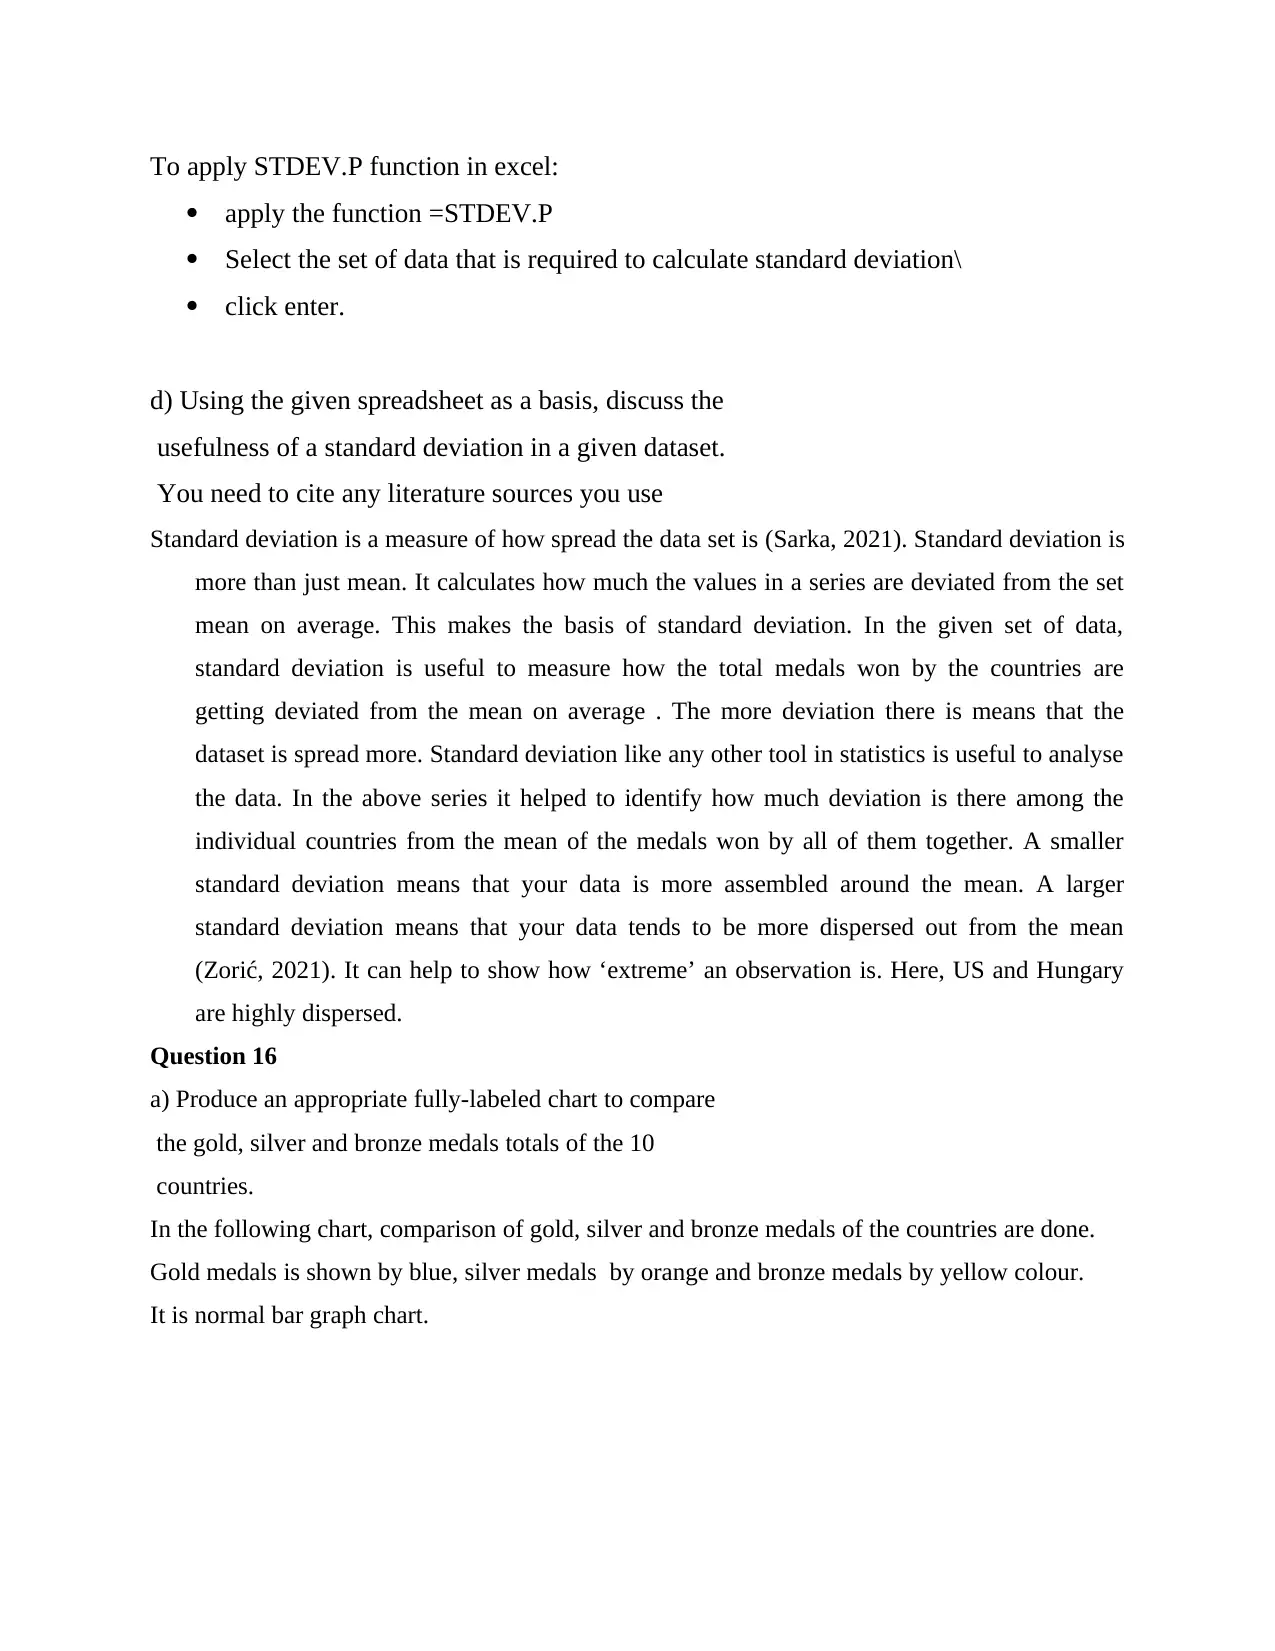
Question 16
a) Produce an appropriate fully-labeled chart to compare
the gold, silver and bronze medals totals of the 10
countries.
In the following chart, comparison of gold, silver and bronze medals of the countries are done.
Gold medals is shown by blue, silver medals by orange and bronze medals by yellow colour.
It is normal bar graph chart.
apply the function =STDEV.P
Select the set of data that is required to calculate standard deviation\
click enter.
d) Using the given spreadsheet as a basis, discuss the
usefulness of a standard deviation in a given dataset.
You need to cite any literature sources you use
Standard deviation is a measure of how spread the data set is (Sarka, 2021). Standard deviation is
more than just mean. It calculates how much the values in a series are deviated from the set
mean on average. This makes the basis of standard deviation. In the given set of data,
standard deviation is useful to measure how the total medals won by the countries are
getting deviated from the mean on average . The more deviation there is means that the
dataset is spread more. Standard deviation like any other tool in statistics is useful to analyse
the data. In the above series it helped to identify how much deviation is there among the
individual countries from the mean of the medals won by all of them together. A smaller
standard deviation means that your data is more assembled around the mean. A larger
standard deviation means that your data tends to be more dispersed out from the mean
(Zorić, 2021). It can help to show how ‘extreme’ an observation is. Here, US and Hungary
are highly dispersed.
Question 16
a) Produce an appropriate fully-labeled chart to compare
the gold, silver and bronze medals totals of the 10
countries.
In the following chart, comparison of gold, silver and bronze medals of the countries are done.
Gold medals is shown by blue, silver medals by orange and bronze medals by yellow colour.
It is normal bar graph chart.
X-axis- Medals won
Y-axis- Countries
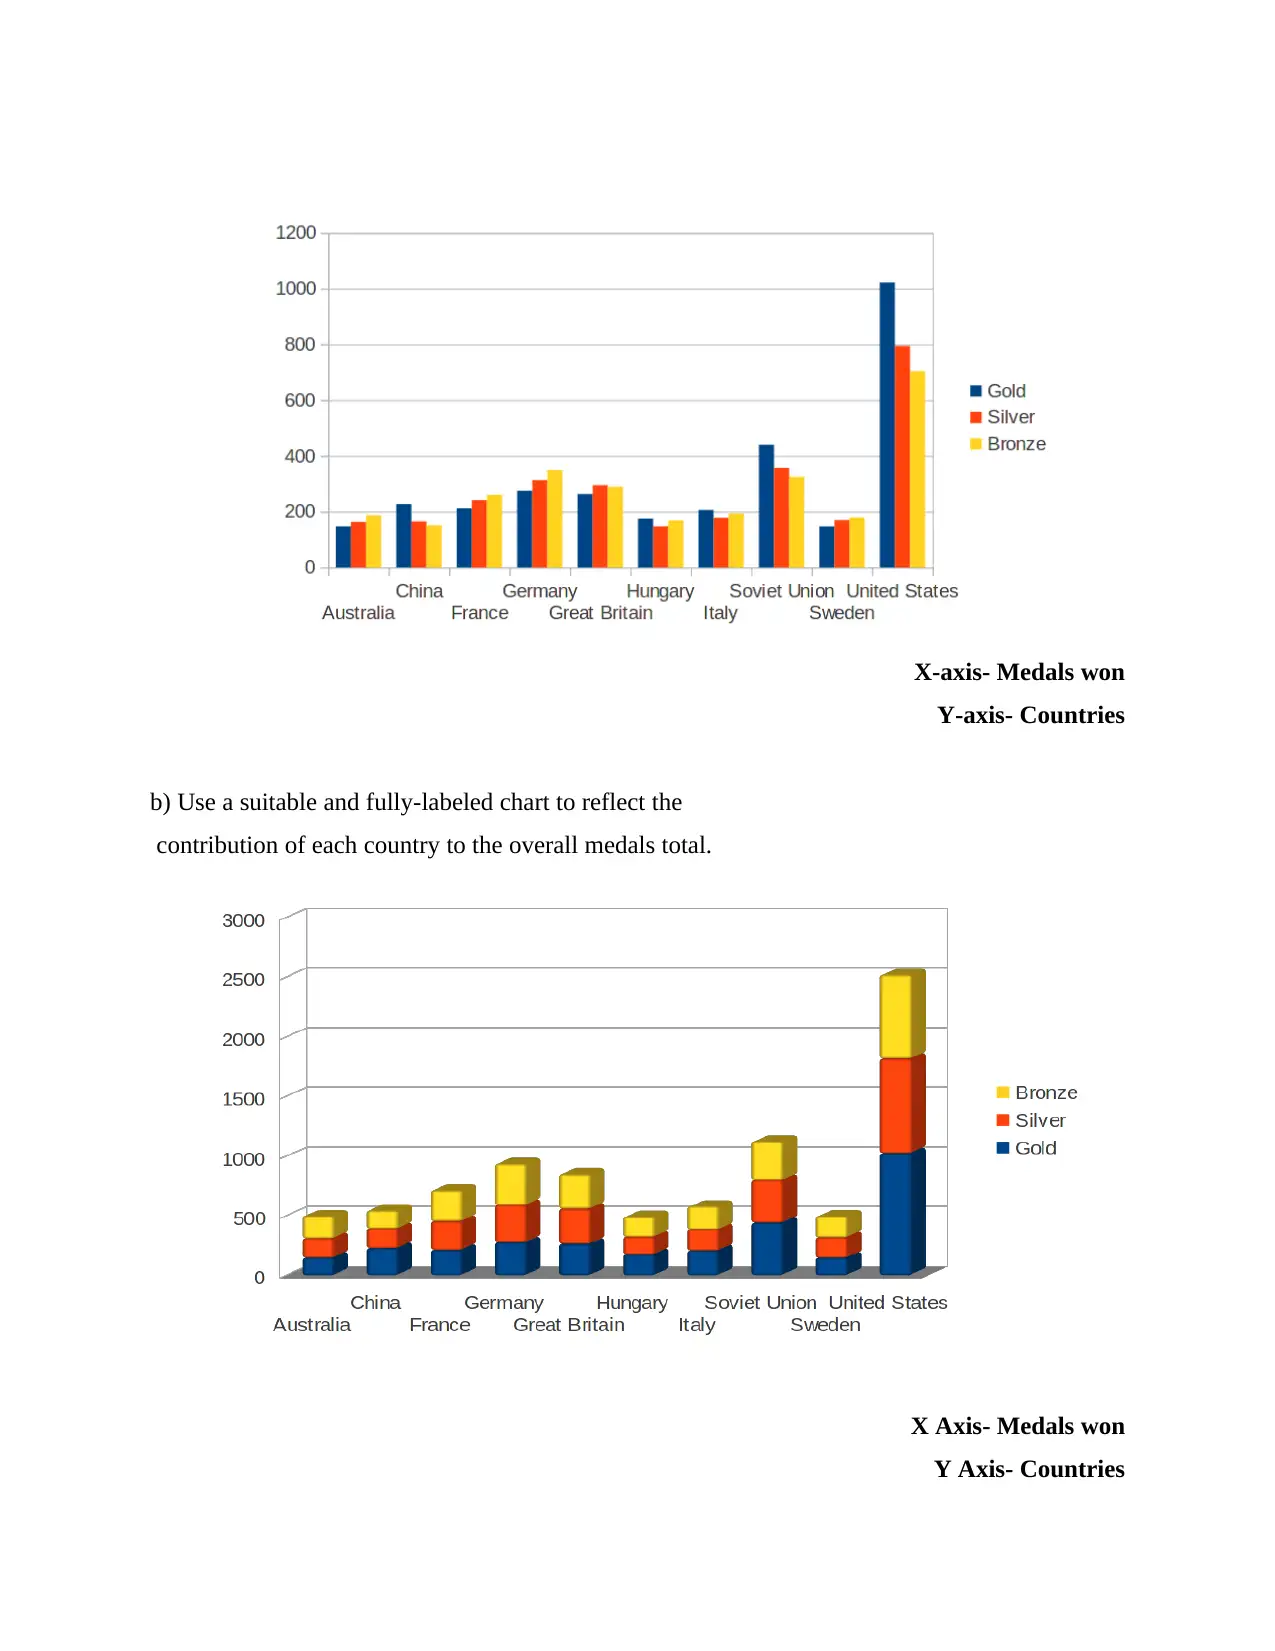
b) Use a suitable and fully-labeled chart to reflect the
contribution of each country to the overall medals total.
X Axis- Medals won
Y Axis- Countries
Y-axis- Countries
b) Use a suitable and fully-labeled chart to reflect the
contribution of each country to the overall medals total.
X Axis- Medals won
Y Axis- Countries
It is a stacked bar graph which shows all the three segments and contribution of the countries in
the Olympics. Hungary is at the lowest and US won the most medals.
CONCLUSION
This report discussed many concepts related to mathematics and statistics which were both,
basics and in depth of the topics. First part of the report, Numeracy, discussed the basics of
fractions, decimals, percentages with the help of many numericals which were focused to
provide in depth knowledge about the said concepts. The second part, Data, talked about how
data analysis is pursued in accordance to have better understanding of the provided data. All set
of data analysis tools were used. In the third part, IT, has given a better understanding of the MS
EXCEL and the functions and tools that are ready to be used to have easier way of analysing a
given set of data. Standard deviation, mean, mode, median were also calculated in it using the
tools in Excel. All the steps done to calculate them are mentioned in there.
Secure Best Marks with AI Grader
Need help grading? Try our AI Grader for instant feedback on your assignments.
REFERENCES
Books and Journals
Andrade, C., 2020. Understanding the difference between standard deviation and standard error
of the mean, and knowing when to use which. Indian Journal of Psychological
Medicine, 42(4), pp.409-410.
Bernard, M. and Senjayawati, E., 2019. Developing the Students’ Ability in Understanding
Mathematics and Self-confidence with VBA for Excel. JRAMathEdu (Journal of
Research and Advances in Mathematics Education), 4(1), pp.45-56.
Harrisson, S., 2018. The downside of dispersity: why the standard deviation is a better measure
of dispersion in precision polymerization. Polymer Chemistry, 9(12), pp.1366-1370.
Hossain, E., 2021. MS Excel Functions and Formulae. In Excel Crash Course for Engineers (pp.
117-141). Springer, Cham.
Larkin, K., and et.al., 2020. Maths and numeracy. In Teaching Primary Years (pp. 152-178).
Routledge.
Li, W.K. and Goos, M., 2017. Factors influencing social processes of statistics learning within
an IT environment. International Journal of Science, Mathematics, and Technology
Learning, 24(2), p.21.
Obersteiner, A., and et.al., 2019. Understanding fractions: Integrating results from mathematics
education, cognitive psychology, and neuroscience. In Constructing number (pp. 135-
162). Springer, Cham.
Ramachandran, K.M. and Tsokos, C.P., 2020. Mathematical statistics with applications in R.
Academic Press.
Sarka, D., 2021. Descriptive statistics. In Advanced Analytics with Transact-SQL (pp. 3-29).
Apress, Berkeley, CA.
Zorić, A.B., 2021. Applied Statistics: Basic Principles and Application. International Journal of
Innovation and Economic Development, 7(3), pp.27-33.
1 out of 17
Related Documents


Your All-in-One AI-Powered Toolkit for Academic Success.
+13062052269
info@desklib.com
Available 24*7 on WhatsApp / Email
![[object Object]](/_next/static/media/star-bottom.7253800d.svg)
Unlock your academic potential
© 2024 | Zucol Services PVT LTD | All rights reserved.