Heart Disease Prediction Using Neural Networks
VerifiedAdded on 2020/05/11
|15
|1503
|80
AI Summary
This solved assignment focuses on predicting heart disease utilizing neural networks implemented within the WEKA software environment. It involves analyzing a provided dataset of patient information, training a multi-layered feedforward neural network model, and evaluating its performance in accurately classifying patients as having or not having heart disease. The assignment explores key concepts in machine learning and demonstrates practical application using WEKA's powerful tools.
Contribute Materials
Your contribution can guide someone’s learning journey. Share your
documents today.

Secure Best Marks with AI Grader
Need help grading? Try our AI Grader for instant feedback on your assignments.

Table of Contents
Part 2 – Numeric Prediction using Neural Network.......................................................................2
Part 3 - Data Mining.........................................................................................................................11
Weka Results.....................................................................................................................................15
References.........................................................................................................................................16
1

Part 2 – Numeric Prediction using Neural Network
Choosing a New Project
The above window shows the wizard of neural networks for choosing a new project. The
project gets opened by clicking on the File > New Project.
Saving the project
2
Choosing a New Project
The above window shows the wizard of neural networks for choosing a new project. The
project gets opened by clicking on the File > New Project.
Saving the project
2
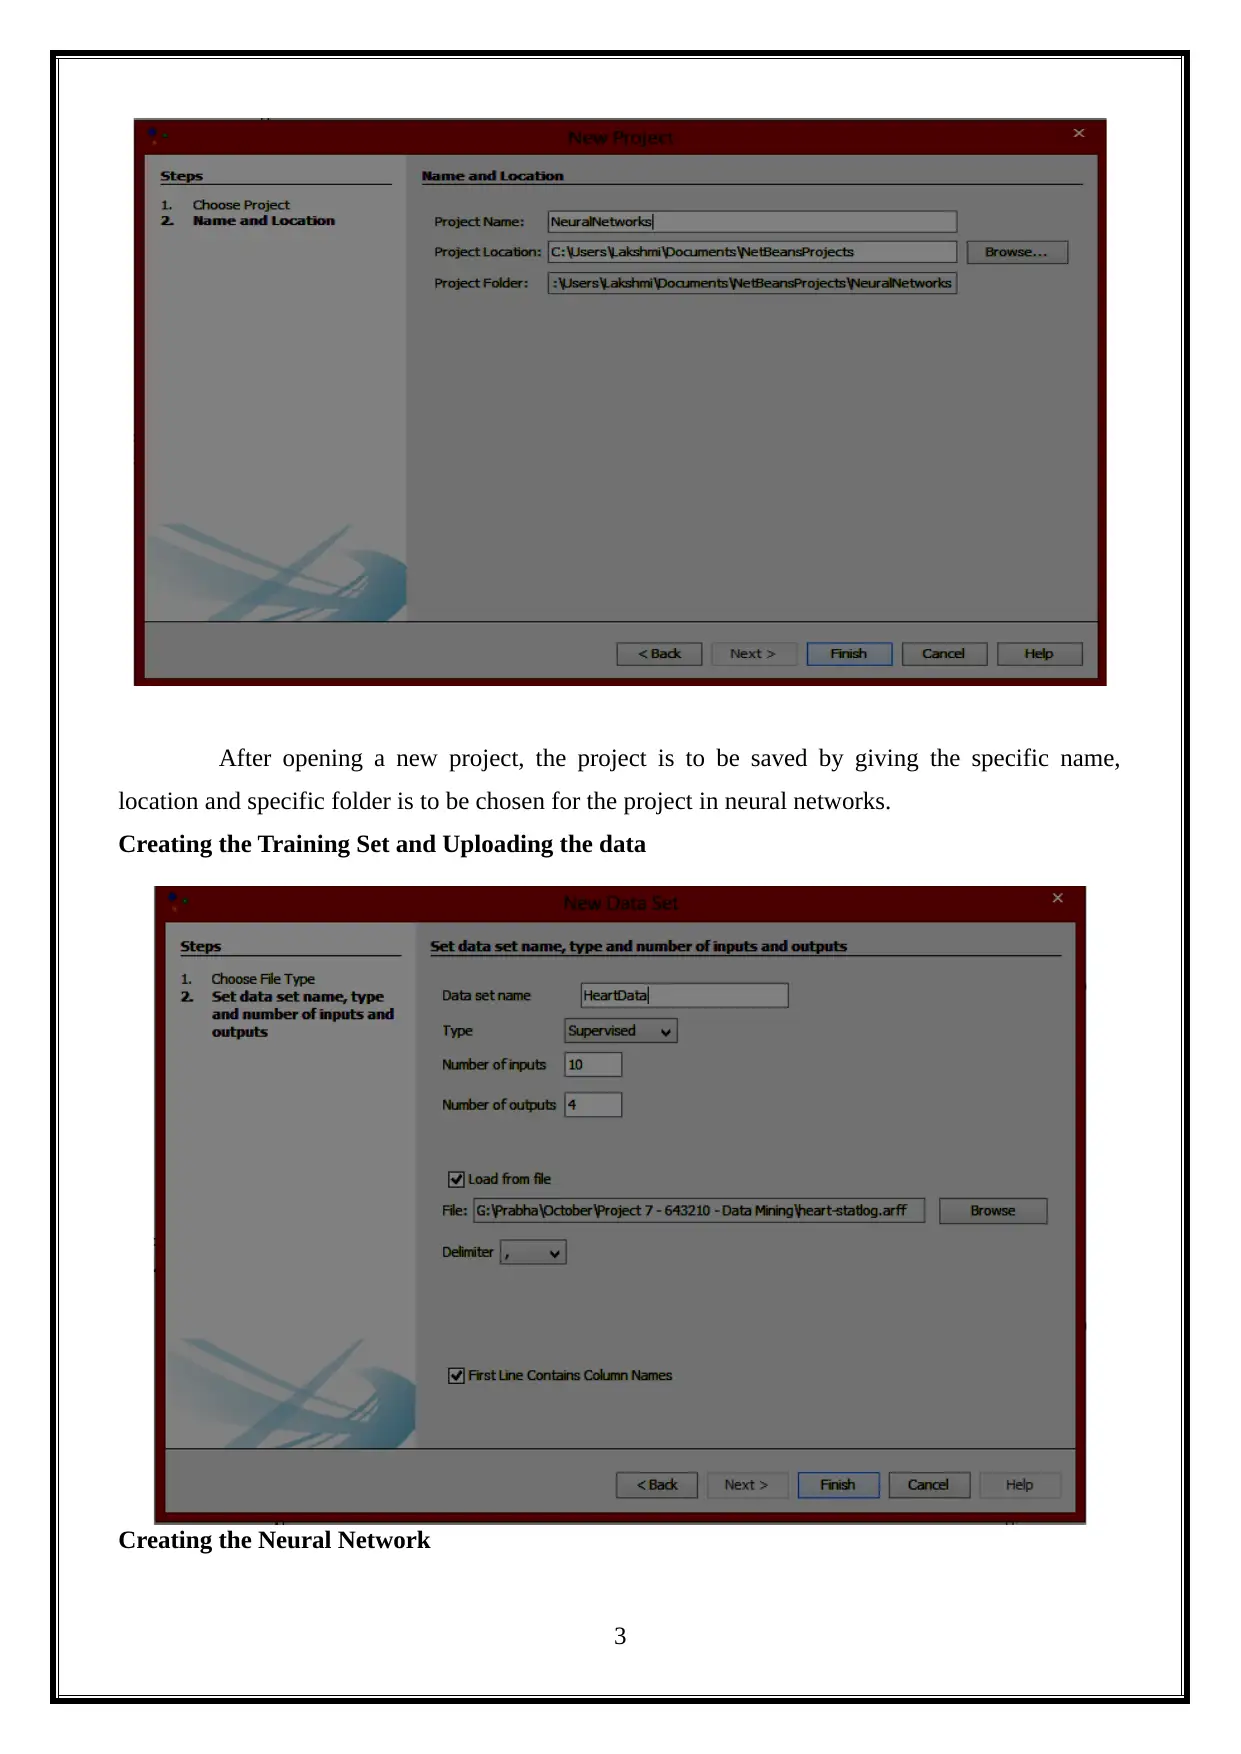
After opening a new project, the project is to be saved by giving the specific name,
location and specific folder is to be chosen for the project in neural networks.
Creating the Training Set and Uploading the data
Creating the Neural Network
3
location and specific folder is to be chosen for the project in neural networks.
Creating the Training Set and Uploading the data
Creating the Neural Network
3
Secure Best Marks with AI Grader
Need help grading? Try our AI Grader for instant feedback on your assignments.
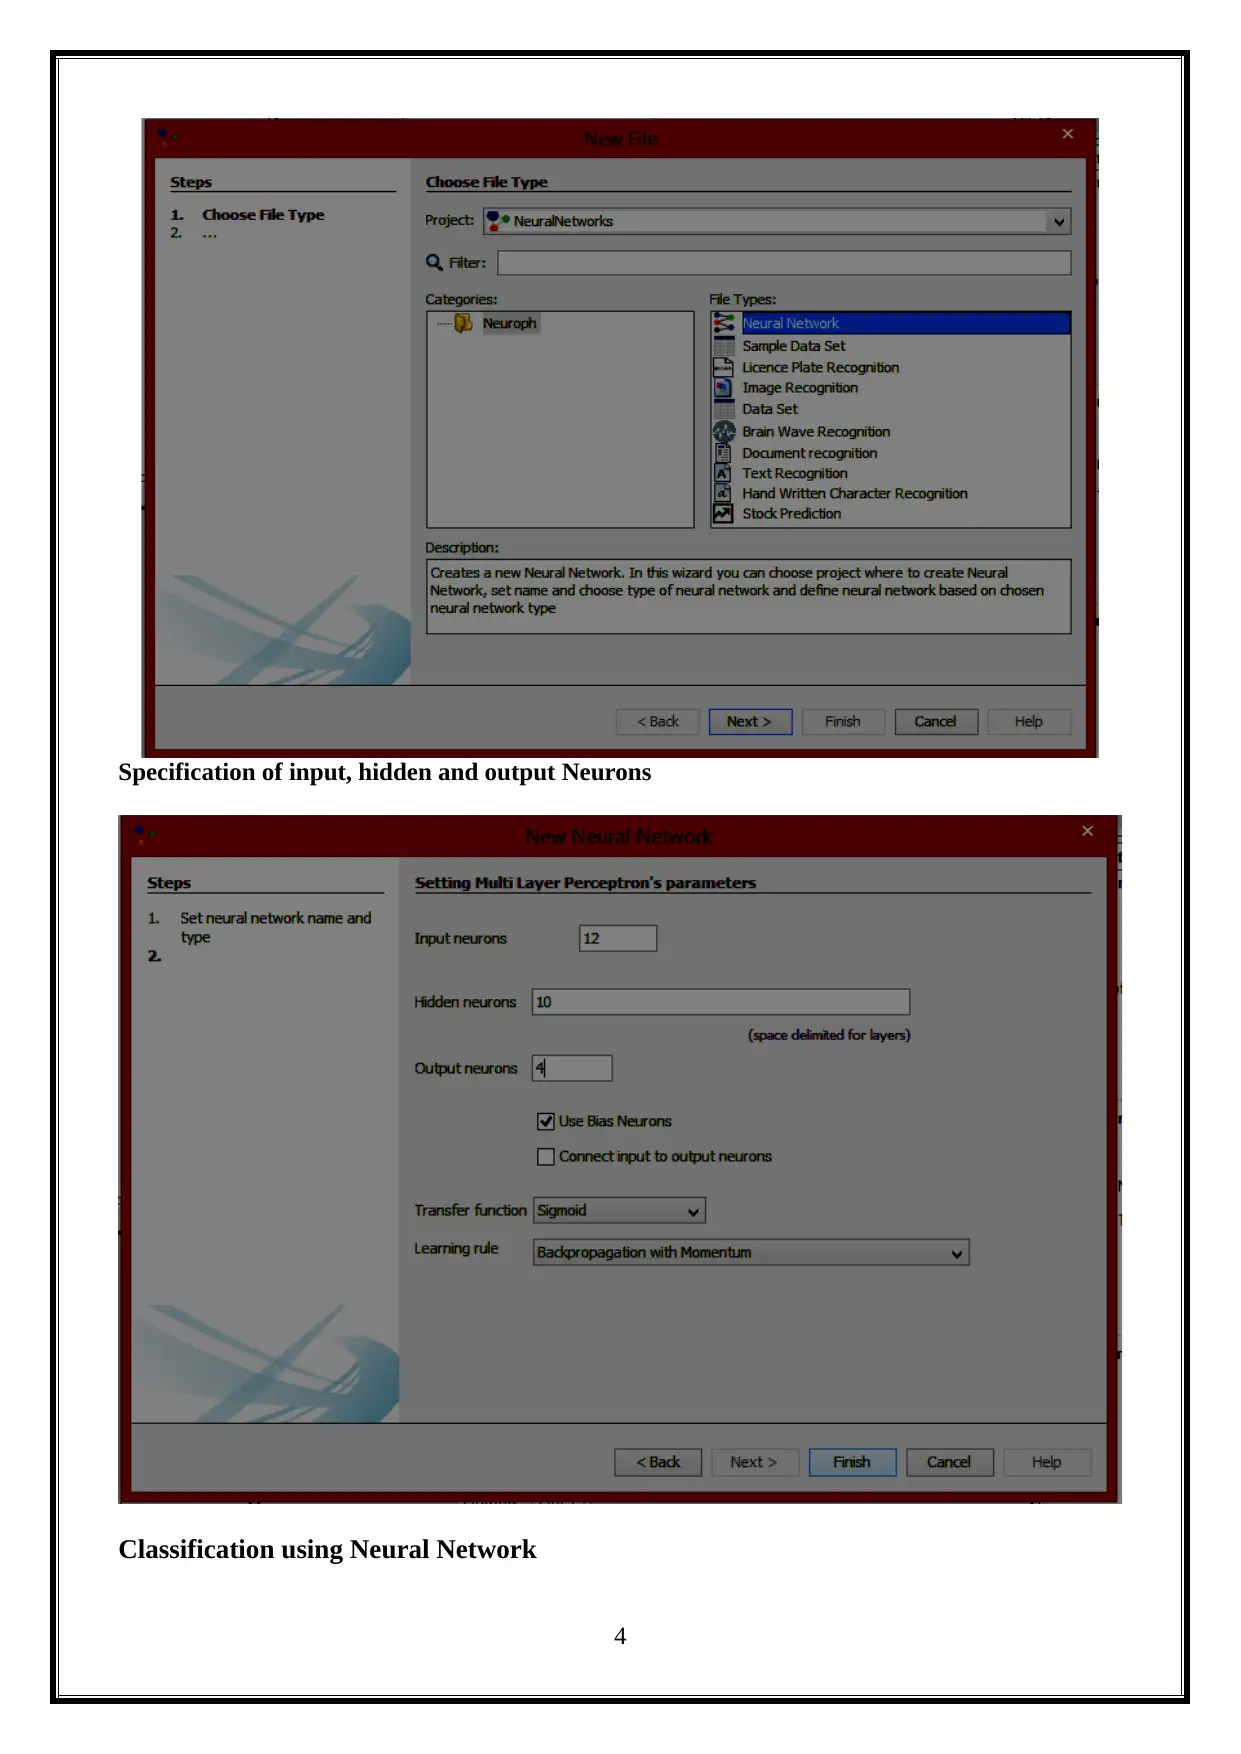
Specification of input, hidden and output Neurons
Classification using Neural Network
4
Classification using Neural Network
4
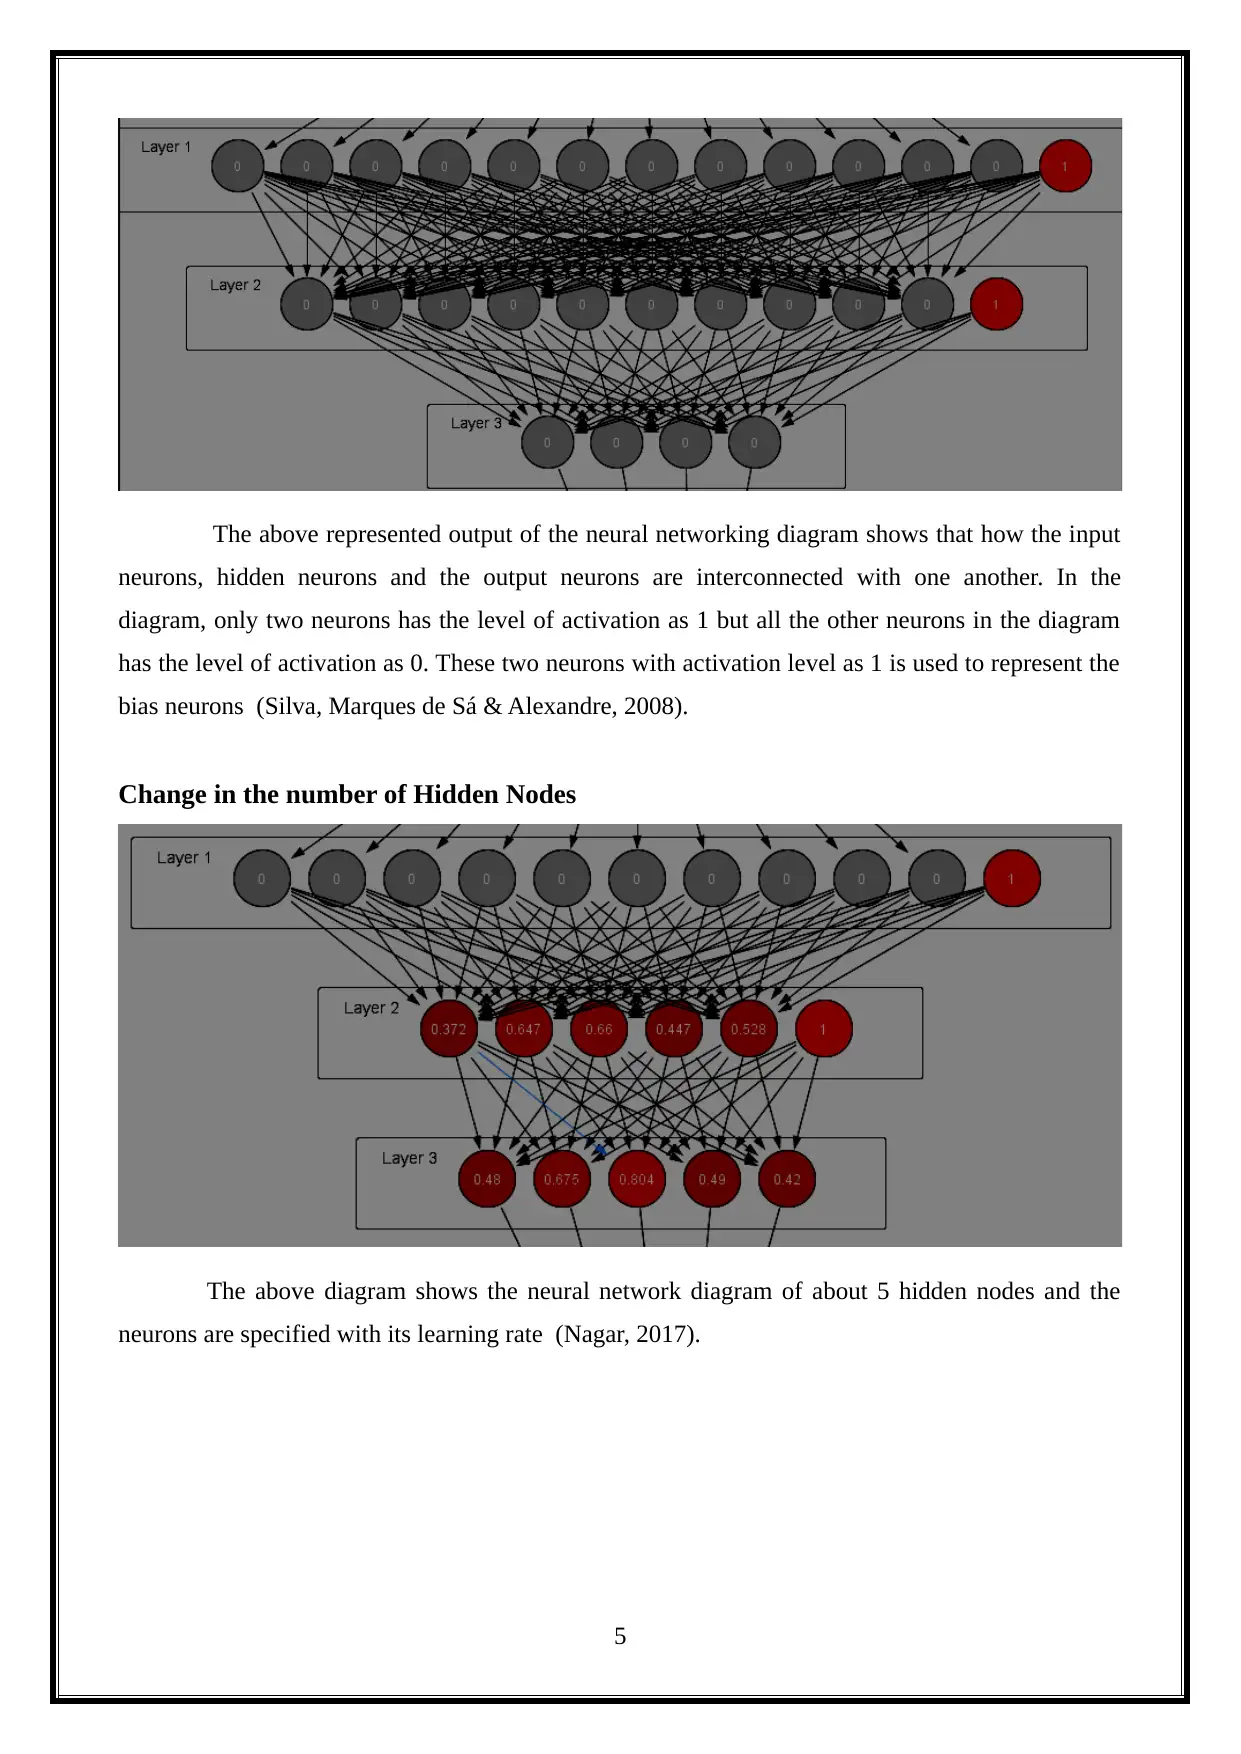
The above represented output of the neural networking diagram shows that how the input
neurons, hidden neurons and the output neurons are interconnected with one another. In the
diagram, only two neurons has the level of activation as 1 but all the other neurons in the diagram
has the level of activation as 0. These two neurons with activation level as 1 is used to represent the
bias neurons (Silva, Marques de Sá & Alexandre, 2008).
Change in the number of Hidden Nodes
The above diagram shows the neural network diagram of about 5 hidden nodes and the
neurons are specified with its learning rate (Nagar, 2017).
5
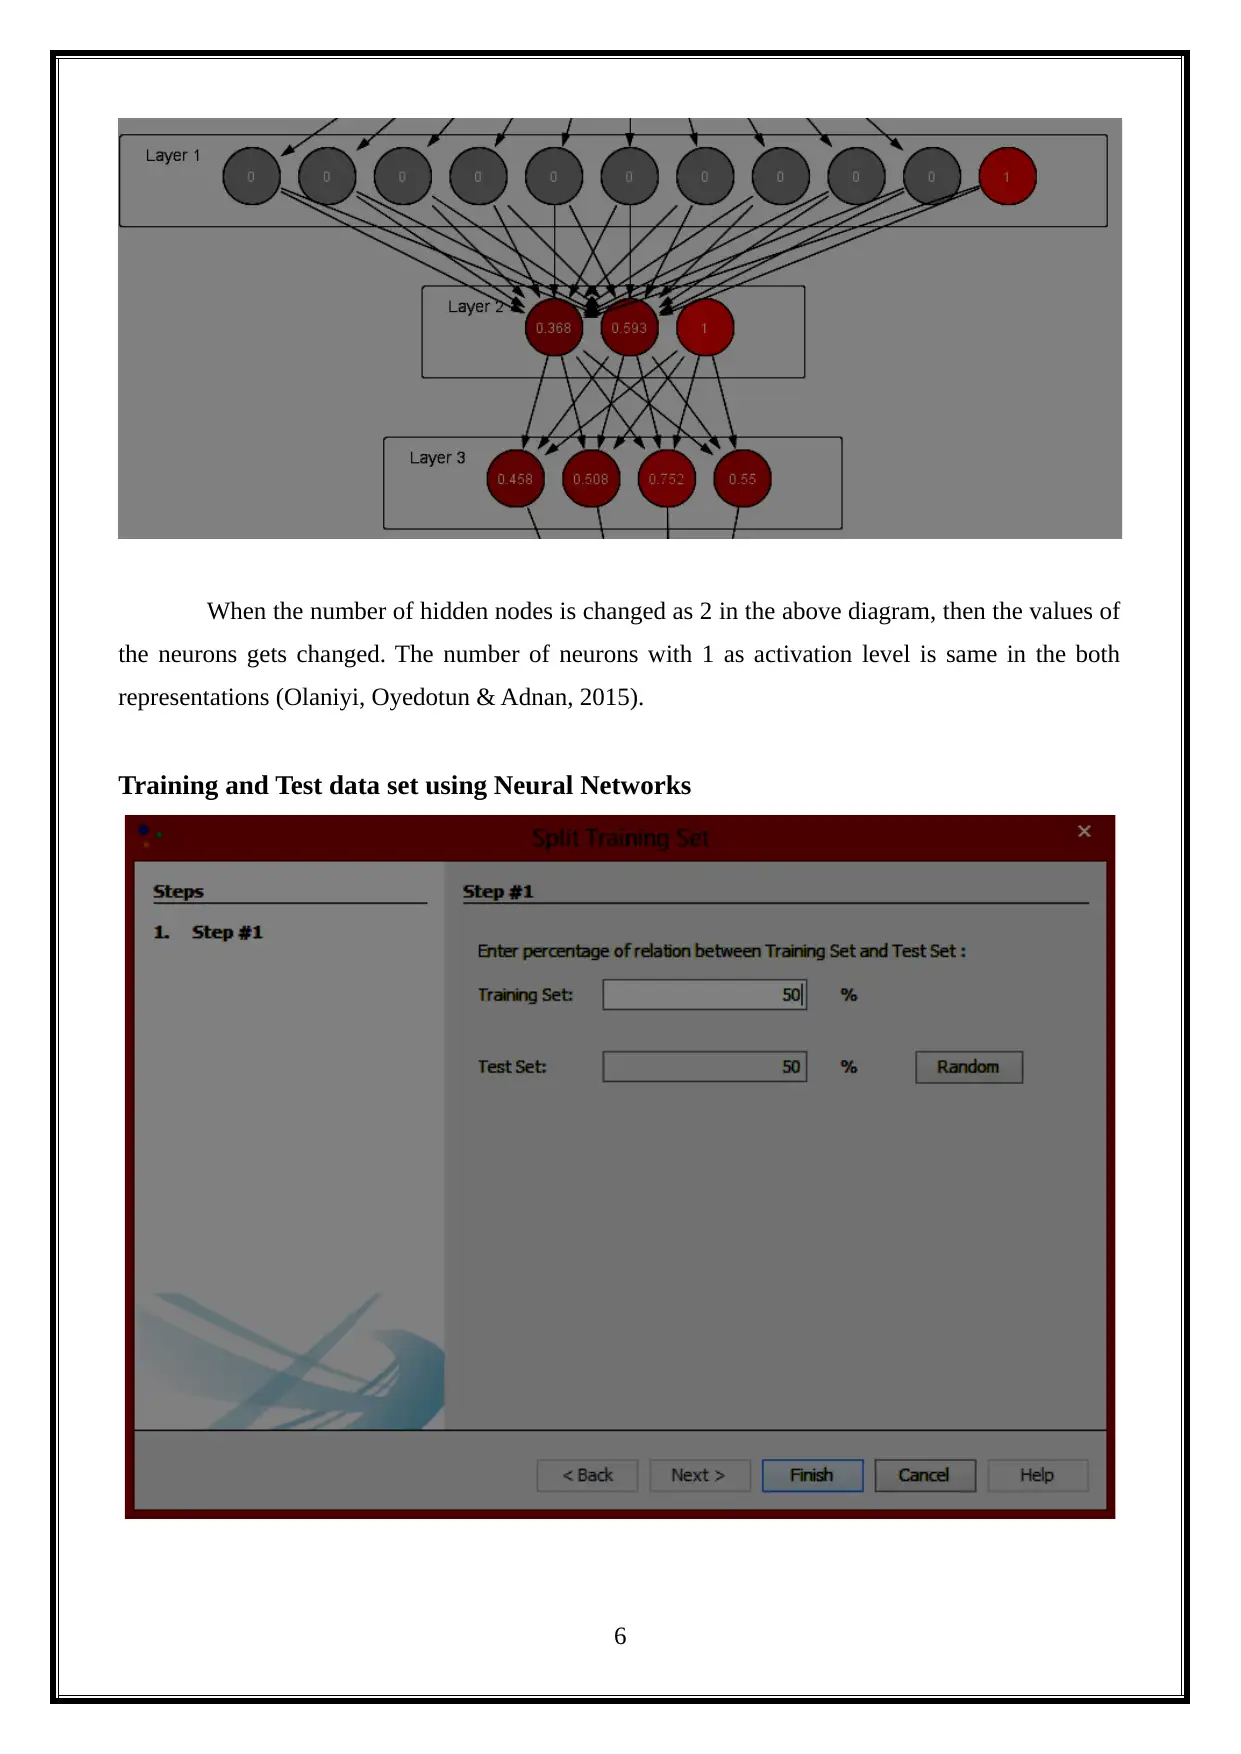
When the number of hidden nodes is changed as 2 in the above diagram, then the values of
the neurons gets changed. The number of neurons with 1 as activation level is same in the both
representations (Olaniyi, Oyedotun & Adnan, 2015).
Training and Test data set using Neural Networks
6
the neurons gets changed. The number of neurons with 1 as activation level is same in the both
representations (Olaniyi, Oyedotun & Adnan, 2015).
Training and Test data set using Neural Networks
6
Paraphrase This Document
Need a fresh take? Get an instant paraphrase of this document with our AI Paraphraser
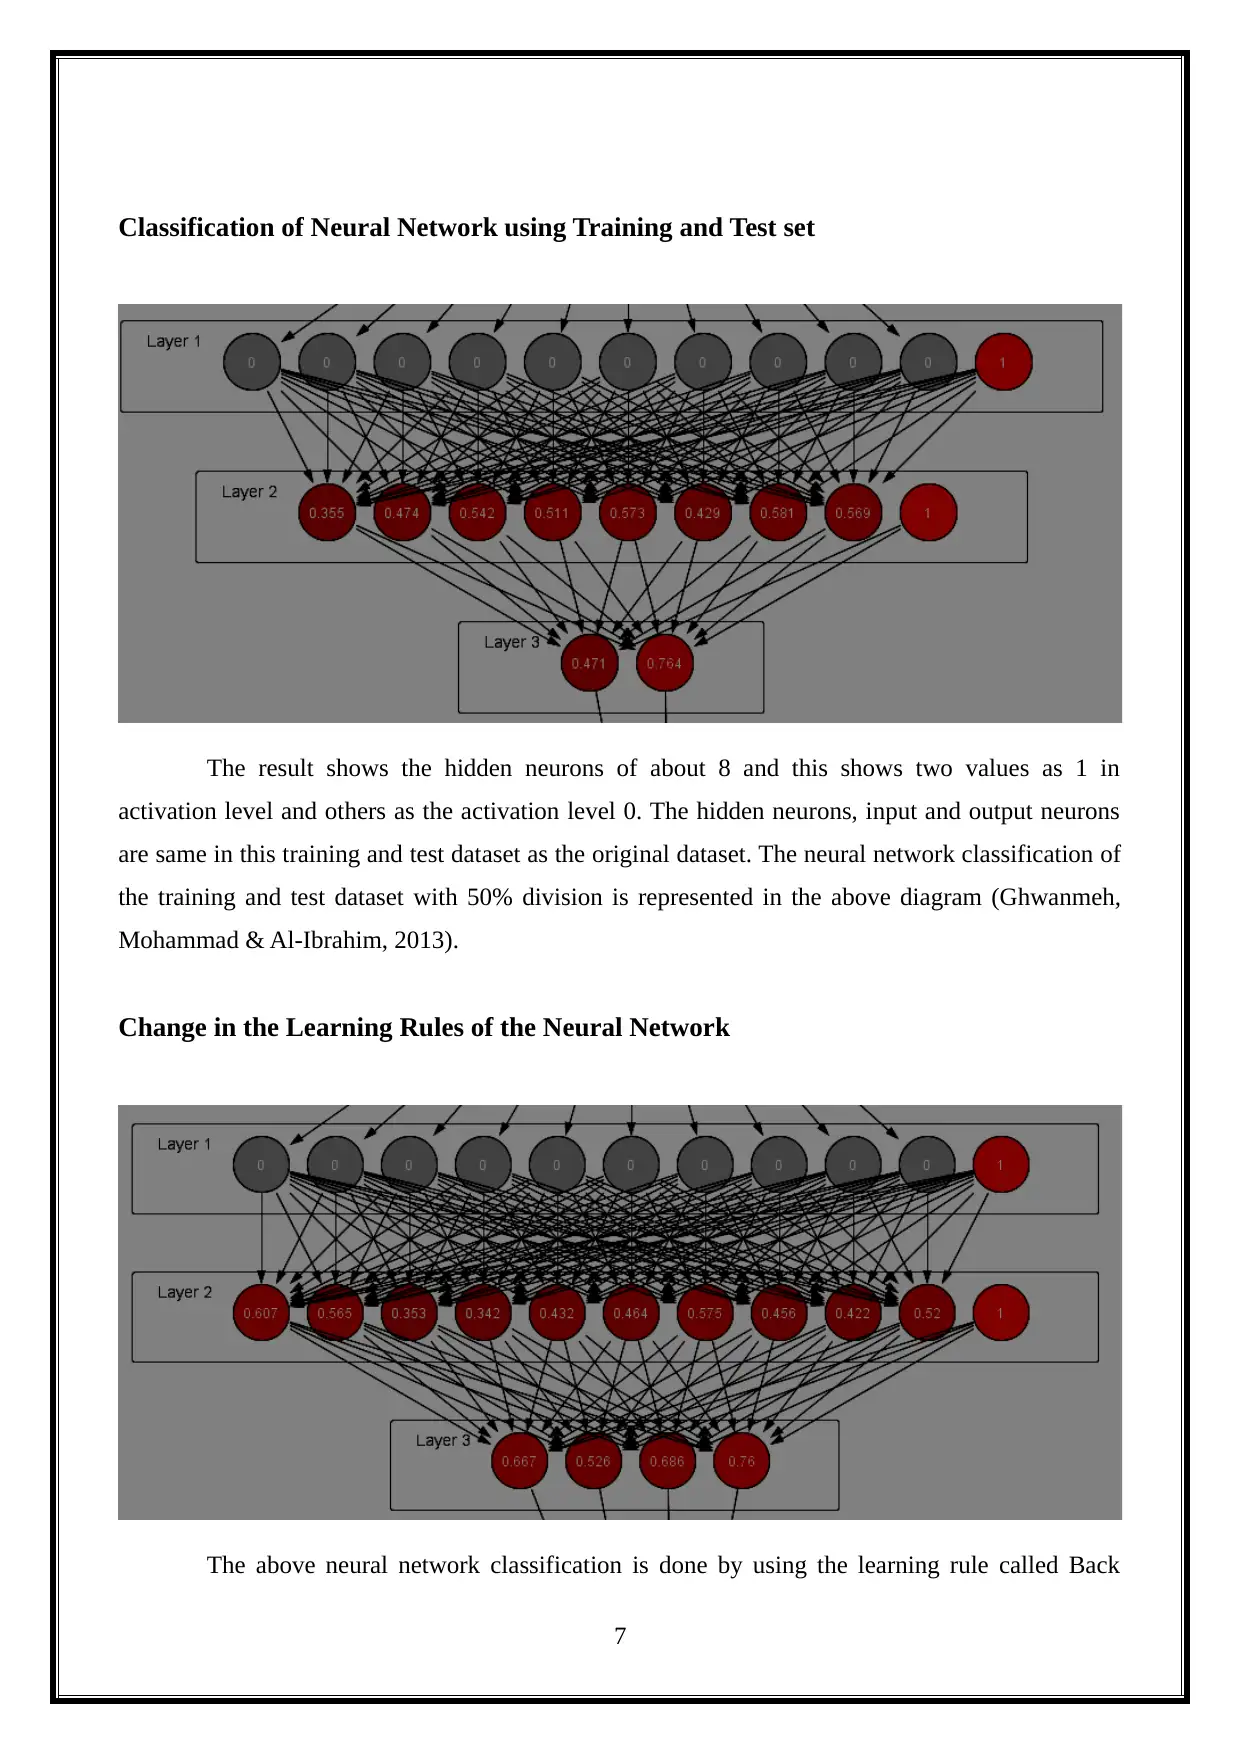
Classification of Neural Network using Training and Test set
The result shows the hidden neurons of about 8 and this shows two values as 1 in
activation level and others as the activation level 0. The hidden neurons, input and output neurons
are same in this training and test dataset as the original dataset. The neural network classification of
the training and test dataset with 50% division is represented in the above diagram (Ghwanmeh,
Mohammad & Al-Ibrahim, 2013).
Change in the Learning Rules of the Neural Network
The above neural network classification is done by using the learning rule called Back
7
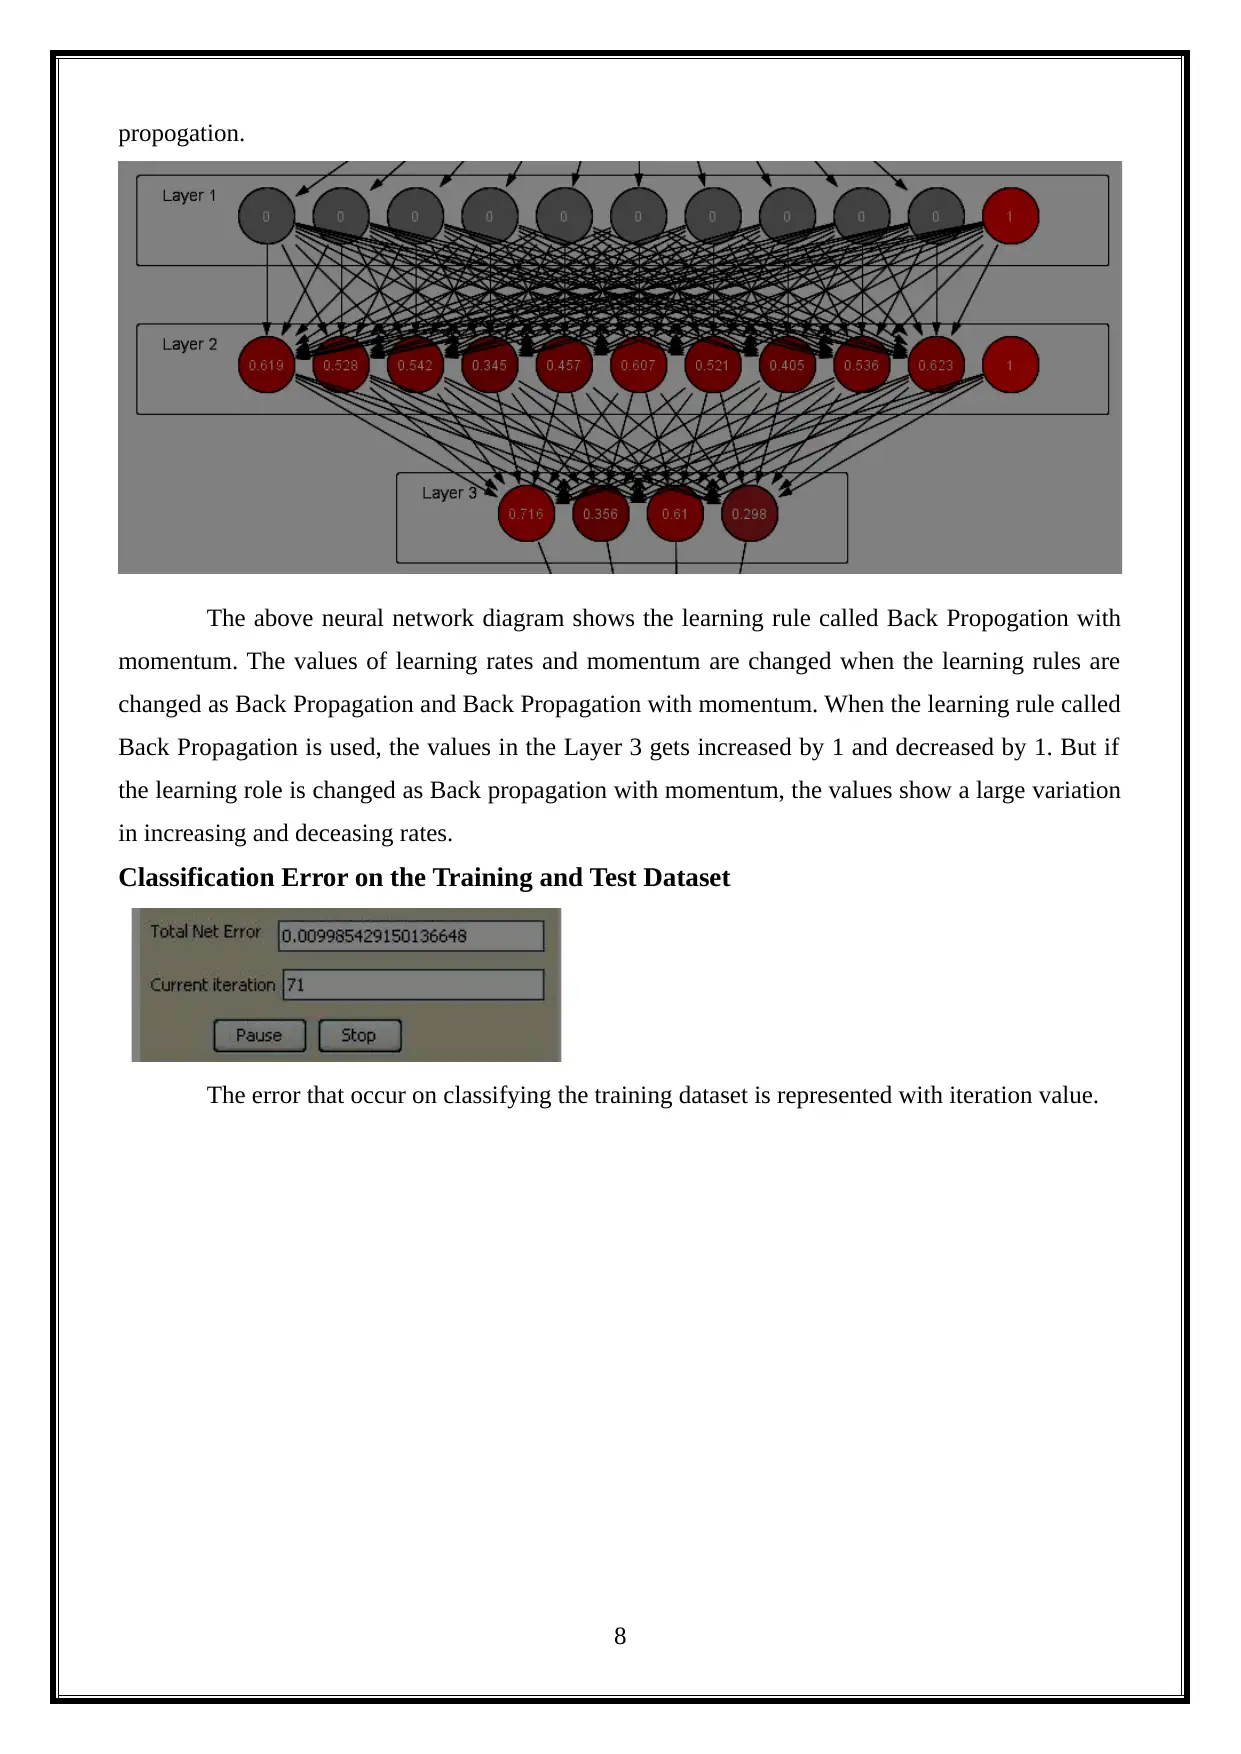
propogation.
The above neural network diagram shows the learning rule called Back Propogation with
momentum. The values of learning rates and momentum are changed when the learning rules are
changed as Back Propagation and Back Propagation with momentum. When the learning rule called
Back Propagation is used, the values in the Layer 3 gets increased by 1 and decreased by 1. But if
the learning role is changed as Back propagation with momentum, the values show a large variation
in increasing and deceasing rates.
Classification Error on the Training and Test Dataset
The error that occur on classifying the training dataset is represented with iteration value.
8
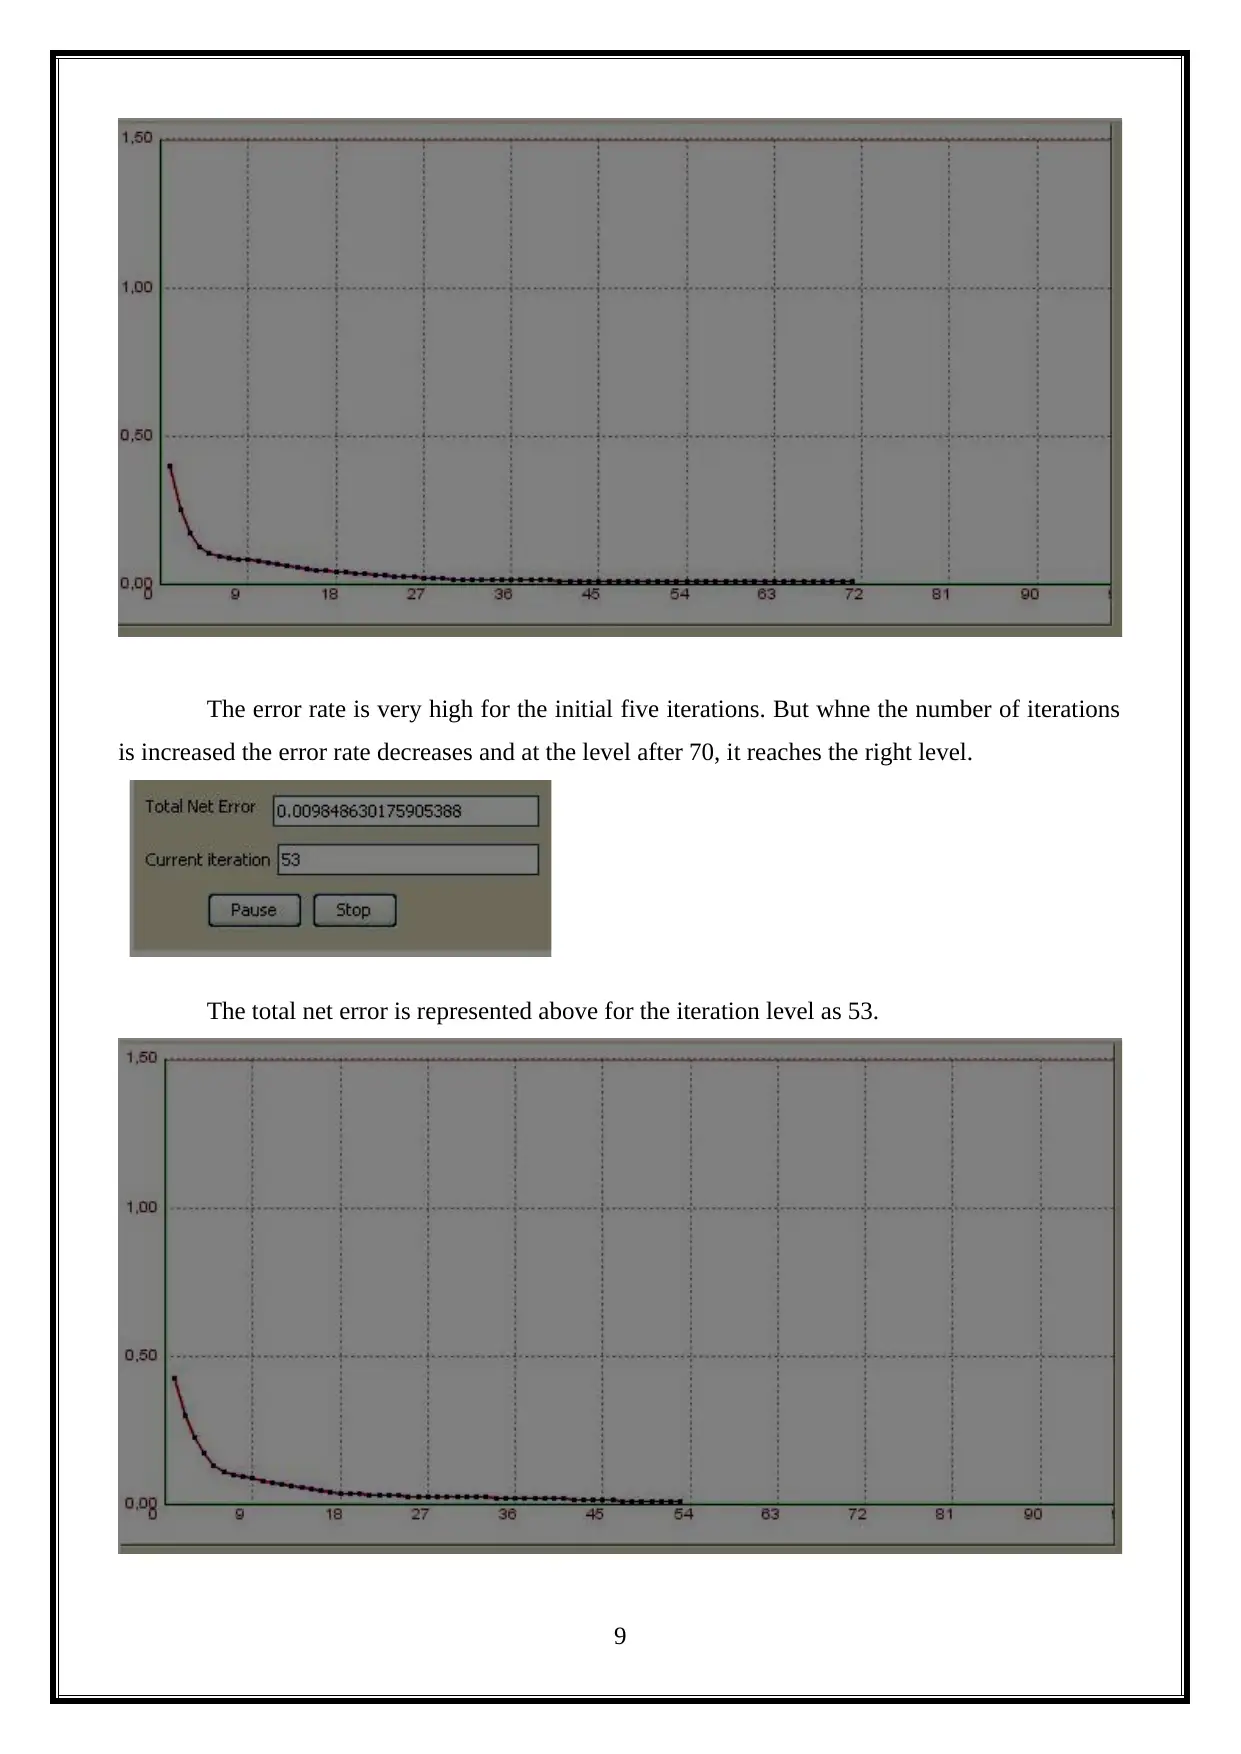
The error rate is very high for the initial five iterations. But whne the number of iterations
is increased the error rate decreases and at the level after 70, it reaches the right level.
The total net error is represented above for the iteration level as 53.
9
is increased the error rate decreases and at the level after 70, it reaches the right level.
The total net error is represented above for the iteration level as 53.
9
Secure Best Marks with AI Grader
Need help grading? Try our AI Grader for instant feedback on your assignments.

The graphical representation of the error estimation does not change much for the iteration
level 53 and the level 71.
Classification using Weka J48
The classification output using the weka J48 program is represented in the above two
windows (Shah, 2017).
Part 3 - Data Mining
Classification of the Movie Data
Classification using Decision Table
10
level 53 and the level 71.
Classification using Weka J48
The classification output using the weka J48 program is represented in the above two
windows (Shah, 2017).
Part 3 - Data Mining
Classification of the Movie Data
Classification using Decision Table
10
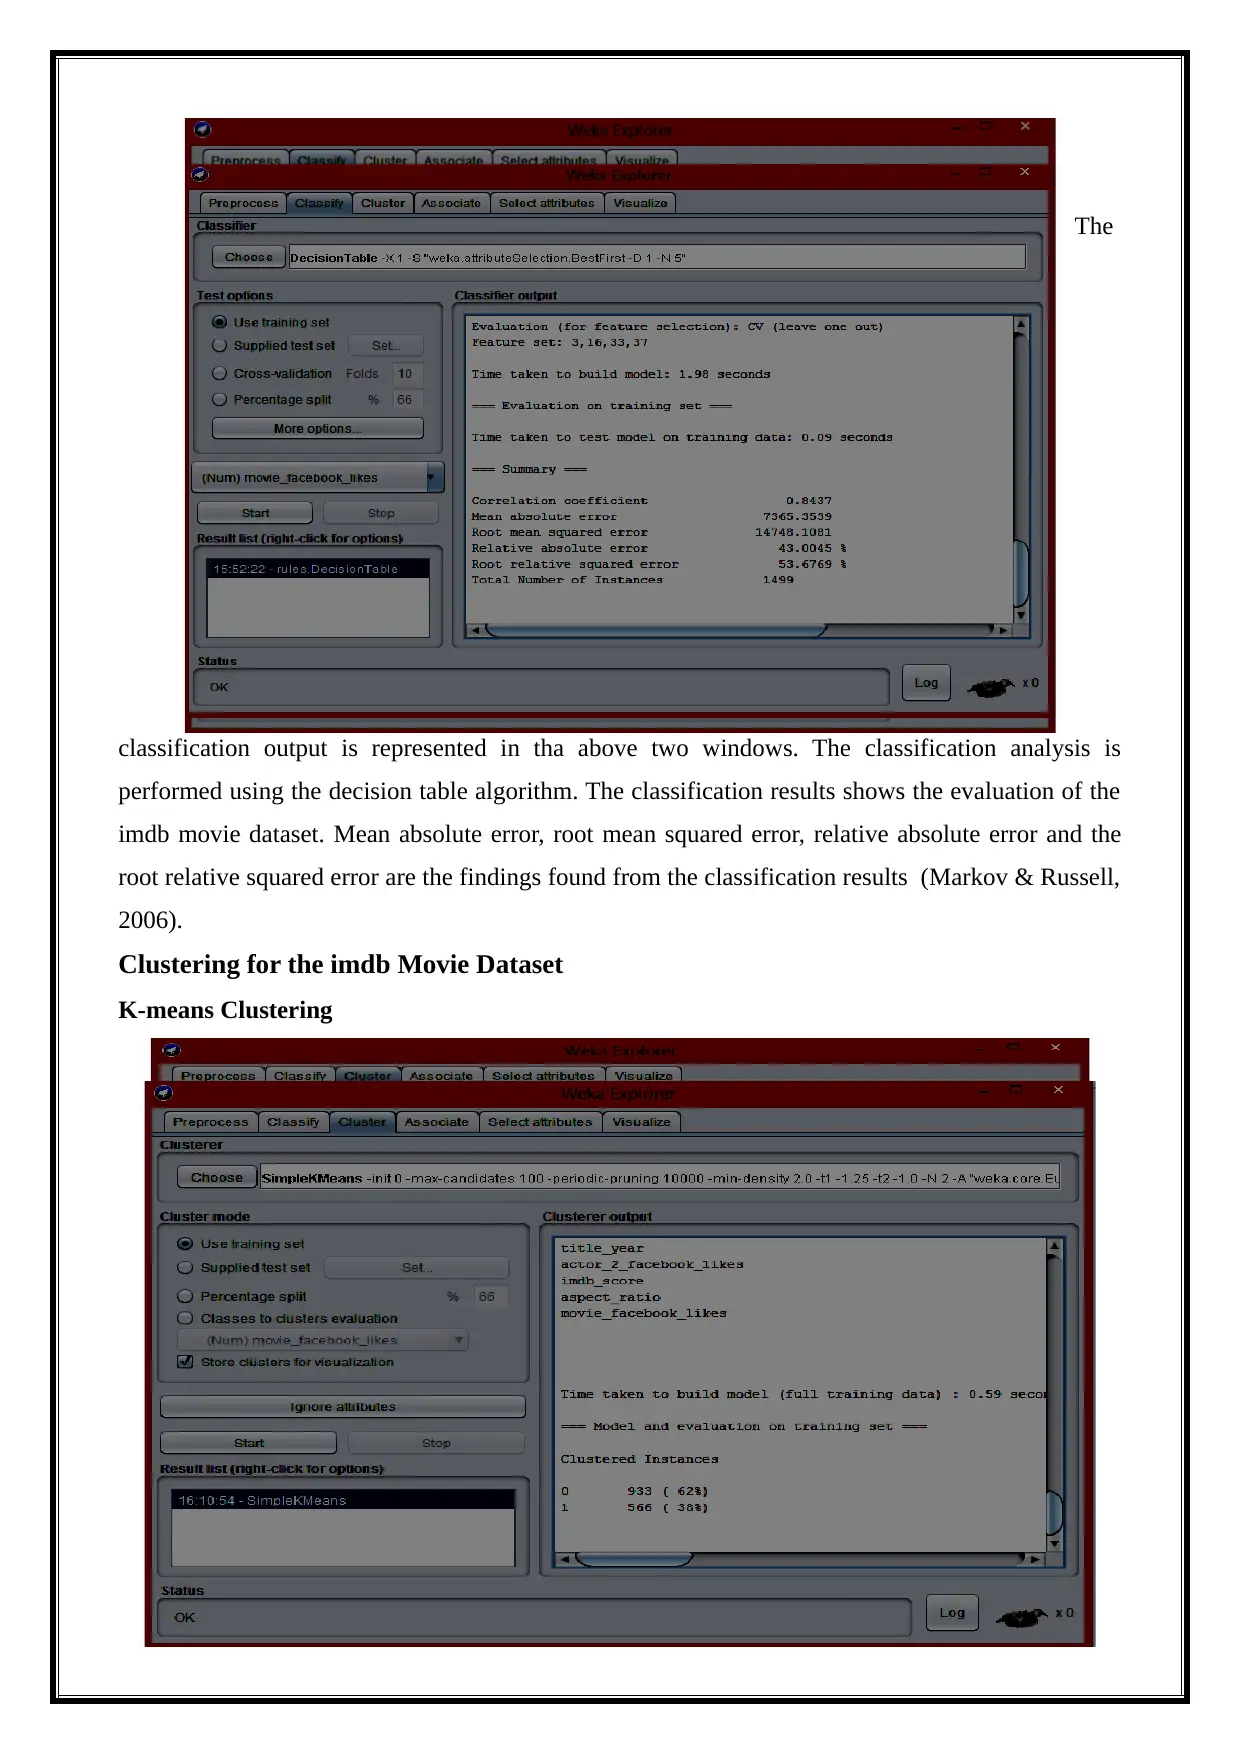
The
classification output is represented in tha above two windows. The classification analysis is
performed using the decision table algorithm. The classification results shows the evaluation of the
imdb movie dataset. Mean absolute error, root mean squared error, relative absolute error and the
root relative squared error are the findings found from the classification results (Markov & Russell,
2006).
Clustering for the imdb Movie Dataset
K-means Clustering
11
The clustering algorithm called k-means clustering is applied on the imdb movie dataset.
The k-means clustering divides the cluster as cluster 0 and cluster 1. The clustered output is
represented in the above two windows. The instances are divided into two clusters (Amudha.J,
Soman.K.P & Kiran.Y, 2011).
Attribute Selection for the imdb movie Dataset
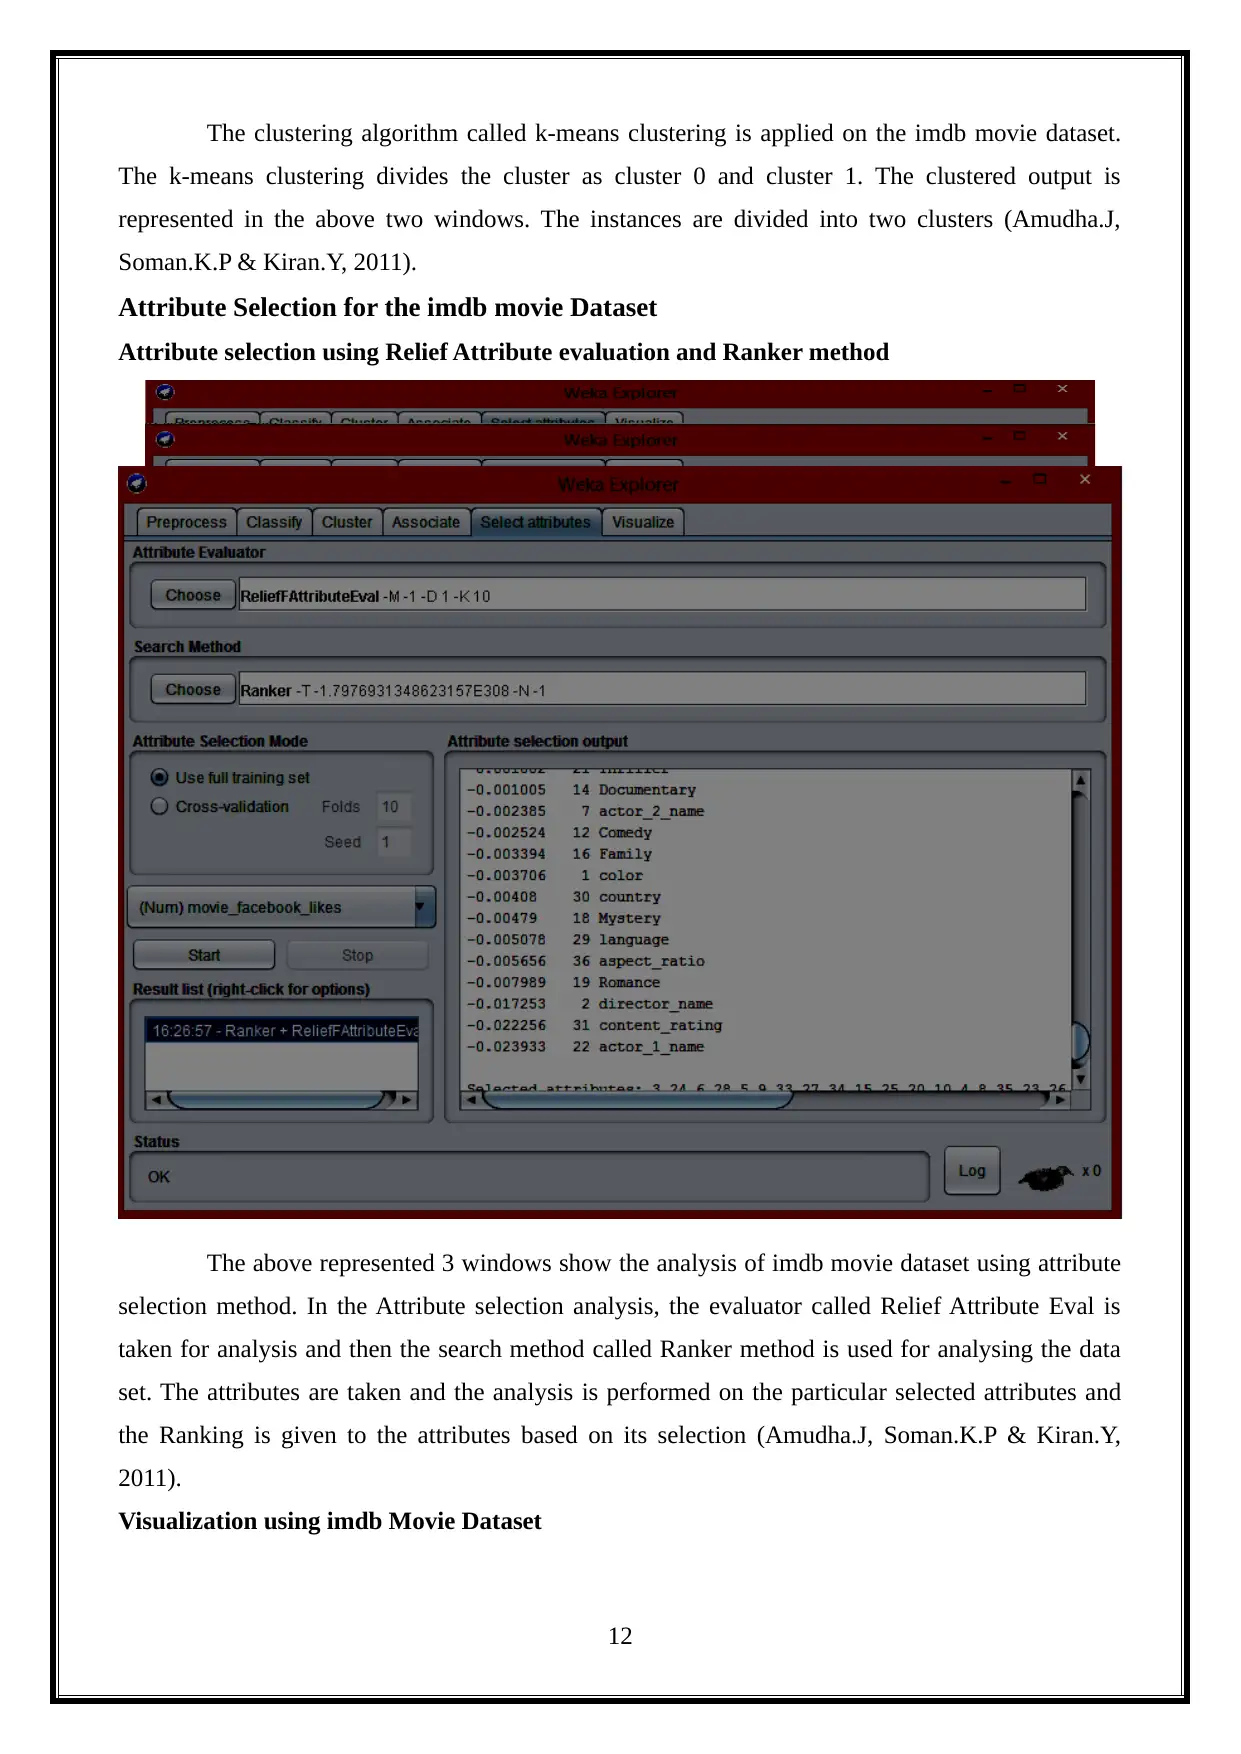
Attribute selection using Relief Attribute evaluation and Ranker method
The above represented 3 windows show the analysis of imdb movie dataset using attribute
selection method. In the Attribute selection analysis, the evaluator called Relief Attribute Eval is
taken for analysis and then the search method called Ranker method is used for analysing the data
set. The attributes are taken and the analysis is performed on the particular selected attributes and
the Ranking is given to the attributes based on its selection (Amudha.J, Soman.K.P & Kiran.Y,
2011).
Visualization using imdb Movie Dataset
12
The k-means clustering divides the cluster as cluster 0 and cluster 1. The clustered output is
represented in the above two windows. The instances are divided into two clusters (Amudha.J,
Soman.K.P & Kiran.Y, 2011).
Attribute Selection for the imdb movie Dataset
Attribute selection using Relief Attribute evaluation and Ranker method
The above represented 3 windows show the analysis of imdb movie dataset using attribute
selection method. In the Attribute selection analysis, the evaluator called Relief Attribute Eval is
taken for analysis and then the search method called Ranker method is used for analysing the data
set. The attributes are taken and the analysis is performed on the particular selected attributes and
the Ranking is given to the attributes based on its selection (Amudha.J, Soman.K.P & Kiran.Y,
2011).
Visualization using imdb Movie Dataset
12
Paraphrase This Document
Need a fresh take? Get an instant paraphrase of this document with our AI Paraphraser
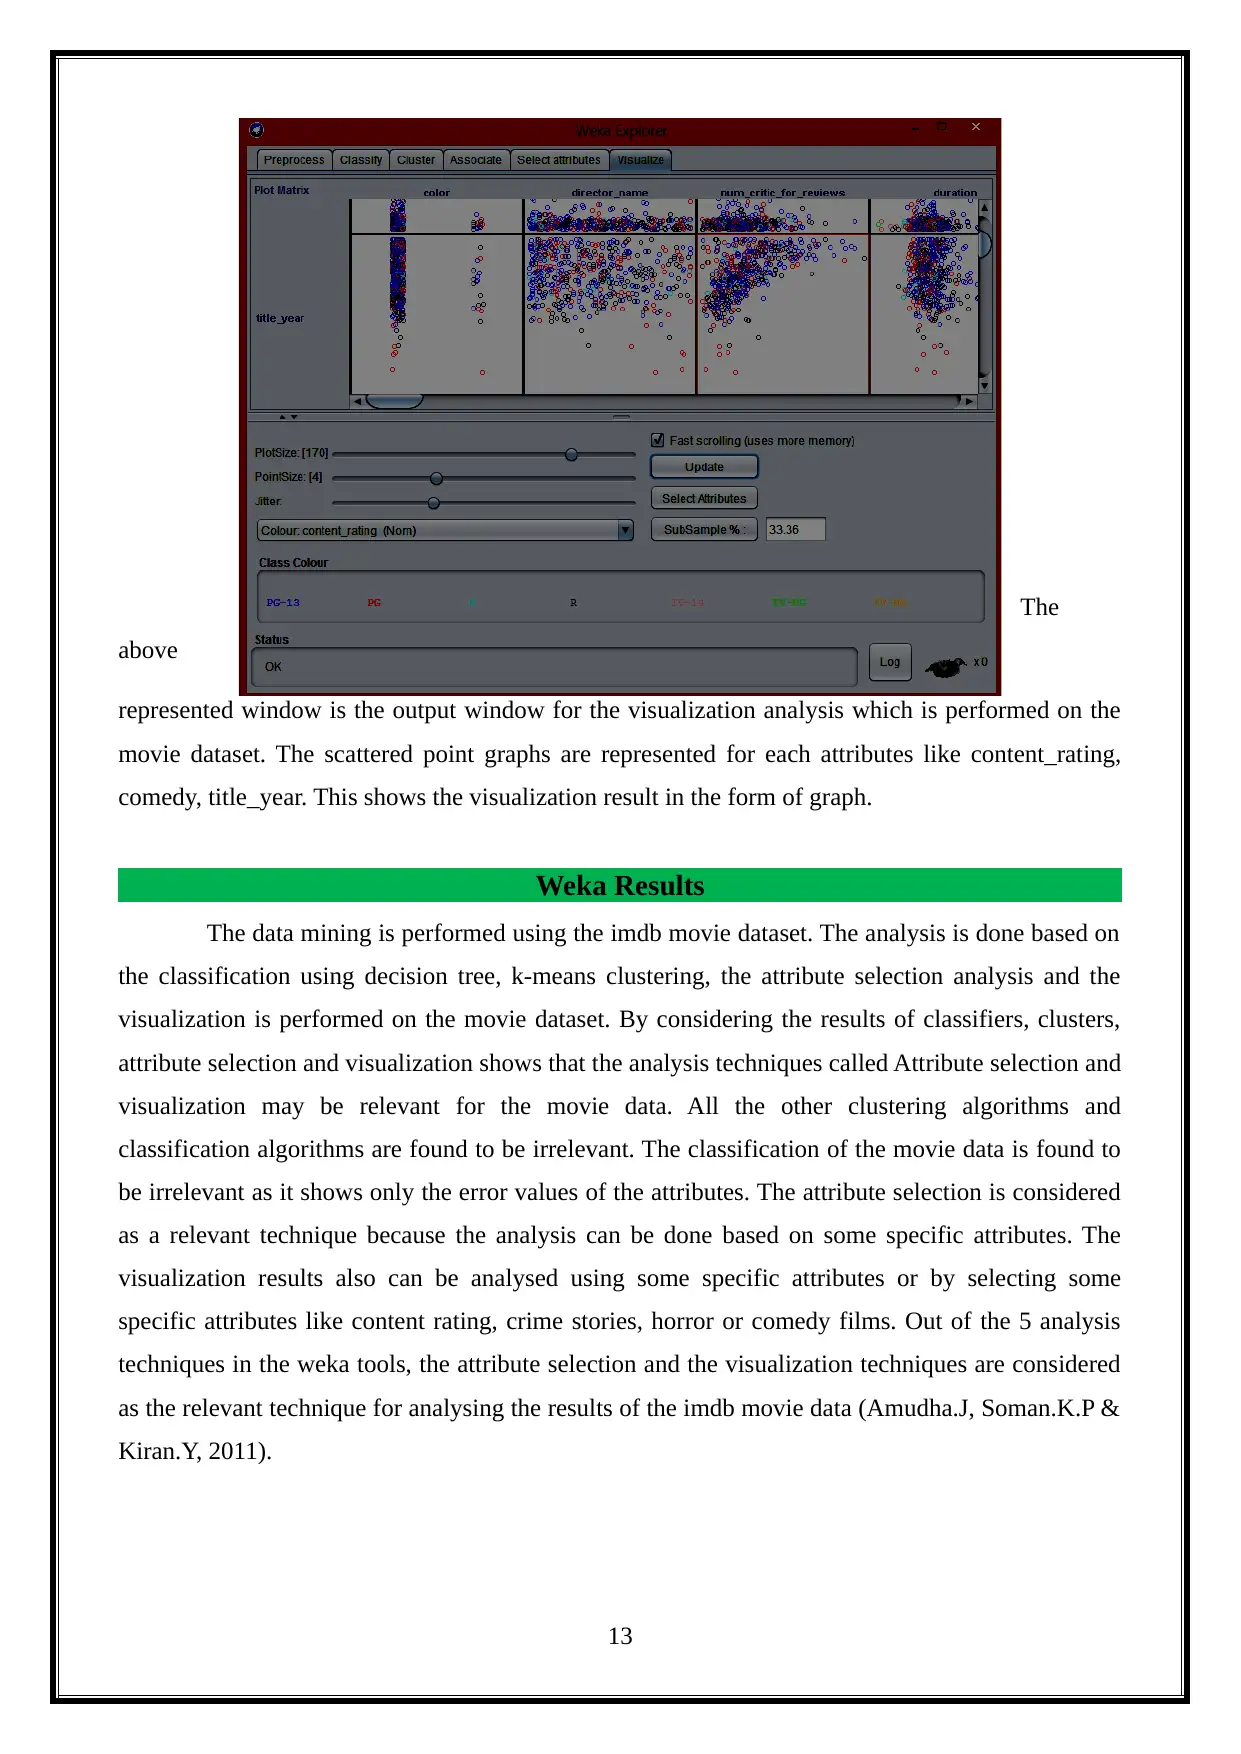
The
above
represented window is the output window for the visualization analysis which is performed on the
movie dataset. The scattered point graphs are represented for each attributes like content_rating,
comedy, title_year. This shows the visualization result in the form of graph.
Weka Results
The data mining is performed using the imdb movie dataset. The analysis is done based on
the classification using decision tree, k-means clustering, the attribute selection analysis and the
visualization is performed on the movie dataset. By considering the results of classifiers, clusters,
attribute selection and visualization shows that the analysis techniques called Attribute selection and
visualization may be relevant for the movie data. All the other clustering algorithms and
classification algorithms are found to be irrelevant. The classification of the movie data is found to
be irrelevant as it shows only the error values of the attributes. The attribute selection is considered
as a relevant technique because the analysis can be done based on some specific attributes. The
visualization results also can be analysed using some specific attributes or by selecting some
specific attributes like content rating, crime stories, horror or comedy films. Out of the 5 analysis
techniques in the weka tools, the attribute selection and the visualization techniques are considered
as the relevant technique for analysing the results of the imdb movie data (Amudha.J, Soman.K.P &
Kiran.Y, 2011).
13
References
A., A., N., S., M., R., S., A., & A., S. (2017). Heart Disease Prediction System using Multilayered
Feed Forward Neural Network and Back Propagation Neural Network. International Journal
Of Computer Applications, 166(7), 32-36. http://dx.doi.org/10.5120/ijca2017914080
Amudha.J, A., Soman.K.P, A., & Kiran.Y, A. (2011). Feature Selection in TopDown Visual
Attention Model using WEKA. International Journal Of Computer Applications, 24(4), 38-43.
http://dx.doi.org/10.5120/2955-3895
Ghwanmeh, S., Mohammad, A., & Al-Ibrahim, A. (2013). Innovative Artificial Neural Networks-
Based Decision Support System for Heart Diseases Diagnosis. Journal Of Intelligent Learning
Systems And Applications, 05(03), 176-183. http://dx.doi.org/10.4236/jilsa.2013.53019
Markov, Z., & Russell, I. (2006). An introduction to the WEKA data mining system. ACM SIGCSE
Bulletin, 38(3), 367-368. http://dx.doi.org/10.1145/1140123.1140127
Nagar, P. (2017). Prediction of Heart disease using Neural Network. IJARCCE, 6(4), 543-548.
http://dx.doi.org/10.17148/ijarcce.2017.64104
Olaniyi, E., Oyedotun, O., & Adnan, K. (2015). Heart Diseases Diagnosis Using Neural Networks
Arbitration. International Journal Of Intelligent Systems And Applications, 7(12), 75-82.
http://dx.doi.org/10.5815/ijisa.2015.12.08
Shah, P. (2017). An Introduction to Weka - open source for you. Open Source For You. Retrieved 16
October 2017, from http://opensourceforu.com/2017/01/an-introduction-to-weka/
Silva, L., Marques de Sá, J., & Alexandre, L. (2008). Data classification with multilayer perceptrons
using a generalized error function. Neural Networks, 21(9), 1302-1310.
http://dx.doi.org/10.1016/j.neunet.2008.04.004
source, O. (2017). Introduction and regression. Ibm.com. Retrieved 16 October 2017, from
https://www.ibm.com/developerworks/library/os-weka1/index.html
Srivastava, S. (2014). Weka: A Tool for Data preprocessing, Classification, Ensemble, Clustering
and Association Rule Mining. International Journal Of Computer Applications, 88(10), 26-29.
http://dx.doi.org/10.5120/15389-3809
14
1 out of 15
Related Documents


![[Type the company name].](/_next/image/?url=https%3A%2F%2Fdesklib.com%2Fmedia%2Fimages%2Fcm%2F5d0887eb889a4d61b7e2c54fb2dc477c.jpg&w=256&q=75)

Your All-in-One AI-Powered Toolkit for Academic Success.
+13062052269
info@desklib.com
Available 24*7 on WhatsApp / Email
![[object Object]](/_next/static/media/star-bottom.7253800d.svg)
Unlock your academic potential
© 2024 | Zucol Services PVT LTD | All rights reserved.