Evaluating Pipeline Performance During Tunneling Using RS3 FEM
VerifiedAdded on 2023/06/10
|41
|10252
|182
Report
AI Summary
This report presents a numerical analysis of the impact of tunneling on concrete pipelines using RS3 FEM software. Two cases are simulated: one with the tunnel and pipe perpendicular to each other (90 degrees), and another with an inclined orientation (60 degrees). The report details the research procedures, aims, literature review, and a comparison of FEM software. It outlines the RS3 installation and finite element modeling process, including discretization, shape function selection, and FEA equation generation. The RS3 model development for both cases is thoroughly explained, with figures illustrating each step. The results obtained from the RS3 model are compared with literature review findings, followed by a discussion and conclusion, providing a comprehensive overview of pipeline performance under varying tunneling conditions. Desklib provides access to this and other solved assignments to aid students in their studies.

2018
PERFORMANCE OF PIPELINES DURING TUNNEL EXCAVATION
PERFORMANCE OF PIPELINES DURING TUNNEL EXCAVATION
Paraphrase This Document
Need a fresh take? Get an instant paraphrase of this document with our AI Paraphraser
ABSTRACT
The numerical analysis of the tunnel system was carried out to analyze the impacts of the
tunnel on the pipes. The pipe material selected for this analysis was concrete. Here the
simulation was done by RS3 FEM software. It provides the feature to develop the design for
the simulation. Here there are two cases are simulated. Both the two cases have same
elements as well as, material properties. But the orientation of the pipe and tunnel only
changes. In the first case, the tunnel, as well as pipe, is placed perpendicular to each other. So
the angle between the pipe as well as the tunnel was 90degree. In the second case, the pipe
and tunnel are in the inclined orientation. And the inclination angle was 60 degree for the
second case. Here both cases are simulated as well as appropriate graphs are plotted. This
graph gives the details about the simulation results. In this report, the results are particularly
generated for the concrete pipe material. After the simulation process, the result for the
concrete as well as aluminum was compared.
TABLE OF CONTENTS
pg. 1
1. INTRODUCTION..............................................................................................................4
2. RESEARCH PROCEDURES.............................................................................................6
3. AIM OF THE PROJECT....................................................................................................8
4. LITERATURE REVIEW...................................................................................................8
5. COMPARISON BETWEEN VARIOUS FEM SOFTWARES.......................................11
6. RS3 INSTALLATION PROCEDURE.............................................................................13
7. FINITE ELEMENT MODELING....................................................................................14
7.1 Discretization.............................................................................................................15
7.2 Shape Function Selection..........................................................................................15
7.3 FEA Equation Generation.........................................................................................15
7.4 Develop the Global Matrix........................................................................................16
7.5 Solution......................................................................................................................16
7.6 Results.......................................................................................................................16
8. RS3 MODEL DEVELOPMENT......................................................................................16
8.1 Case 1........................................................................................................................17
8.2 Case 2........................................................................................................................24
9. COMPARISONS BETWEEN RS3 MODEL RESULT OBTAINED AND RESULTS
OF LITERATURE REVIEW ATTACHED............................................................................33
10. RESULT DISCUSSION...............................................................................................34
11. CONCLUSION.............................................................................................................34
REFERENCES.........................................................................................................................35
pg. 2
⊘ This is a preview!⊘
Do you want full access?
Subscribe today to unlock all pages.
Trusted by 1+ million students worldwide
TABLE OF FIGURES
Figure 1 Research procedure......................................................................................................6
Figure 2 Stages involved in the FEA design............................................................................15
Figure 3 Schematic diagram for case 1....................................................................................17
Figure 4 Pre settings-Case 1.....................................................................................................17
Figure 5 Tunnel Profile- Case 1...............................................................................................18
Figure 6 Pipe profile creation- Case 1......................................................................................19
Figure 7 Soil Boundary creation- Case 1.................................................................................20
Figure 8 Mesh creation- Case 1...............................................................................................21
Figure 9 Material Property dialogue box- Case.......................................................................21
Figure 10 Calculation- Case 1..................................................................................................22
Figure 11 Sigma 1- Case 1.......................................................................................................22
Figure 12 Strength Factor- Case 1...........................................................................................23
Figure 13 Volumetric Strain- Case 1.......................................................................................23
Figure 14 Major Principal Strain-Case 1.................................................................................24
Figure 15 Schematic diagram for Case 2.................................................................................24
Figure 16 Tunnel Profile-Case 2..............................................................................................25
Figure 17 Pipe Profile- Case 2.................................................................................................26
Figure 18 Boundary Generation- Case 2..................................................................................26
Figure 19 Meshing- Case 2......................................................................................................27
Figure 20 Material Property Assigning- Case 2.......................................................................28
Figure 21 Loading- Case 2.......................................................................................................28
Figure 22 Constrains- Case 2...................................................................................................29
Figure 23 Calculation – Case 2................................................................................................29
Figure 24 Strength Factor – Case 2..........................................................................................30
Figure 25Volumetric Strain – Case 2.......................................................................................31
Figure 26Major Principal Strain – Case 2................................................................................32
Figure 27 Result comparison...................................................................................................33
pg. 3
Paraphrase This Document
Need a fresh take? Get an instant paraphrase of this document with our AI Paraphraser
1. INTRODUCTION
To avoid the problems related to underground structures we need to design very
carefully. Because it involves the lives of many human beings. So we must ensure the safety.
Before going to implement the actual design we need to test and verify the design. But there
was a big problem involved in the testing process. These structures are relatively too large as
well as highly costlier one(Yoo, 2014). And also there is a risk involved in the manual
testing. So before the manual testing, we need carry out the simulation of the design. That is
the best technique to test that kind of structures. Here we can able to simulate the real loading
and its effect on the structures. For that purpose there are many software tools are available in
the market. But the RS3 software was most widely used for this purpose. In this project, we
are going to study the various types of tunnels and its materials. And also the effects of the
tunnel evaluation studied. After that we need to develop the tunnel design. Then the design
was simulated by using the RS3 software. Also, the basic outline of the tunnel structure was
described for the better understanding (Mu, Huang & Lian, 2013).
The tunnels and channels are classified into four stages. It is most probably build upon
on the materials terminated. They are all made by the gap in soft ground, be contained of soil
and very weak rock; hard rock; soft rock, corresponding shale, chalk, and friable sandstone;
and subaqueous. These are 4 types of the ground pillar, nearly all channeling performances.
However associate undoubted basic agenda: enquiry, revealing and tangible transport, ground
support, and environmental control. Likewise, basic approaches are shared for mining and
civil engineering projects. But differ in plan approach toward performance. They all payable
to their various reasons. Most of the mining channels are designing for low-cost non-
permanent usage during ore dig(Ozcelik, 2018). Even though the developing passion of
surface holders for valid defense against subsequent channel collapse. Due to this, it can be
able to change. By difference, most of the civil engineering and public works channels are
mingled and extended human residency plus full defense of all channels. In geologic state
play the superior role in ruling the character of construction methods. It basically of various
designs (Bekmirzaev, 2015). Actually, channeling background is padding with the
illustration. In which an unexpected experience with predicted rules. It caused long
termination for changes in establishment methods, in design, or in both. It is with proceeding
great enlarges in cost and time. In this analysis, there is some difficulty situation containing
pressure, compression, underground water discharge and goes on.
pg. 4
This was solved by a software technique named RS3 by its finite element analysis.
Finite element method is a 3D analysis programming and support to solve the major problem
in geotechnical. RS3 is the different modeling and analysis the problem. Its strength is: tunnel
digging, tunnel complex designing different stage and it has modeled for rock soil also.
Digging (excavation) outline groundwater digging like cave digging, mine digging. Surface
digging is used for making a large hole in mine and for constructing base strongly,
embankment, enhances systems, hang on a wall, slopes and more(Ivor, Staš & Schneider,
2016). Digging (excavation) enhances complex and support system for groundwater
otherwise surface digging by using beams, bolts, sheet pile walls, steel sets, liners, fore poles,
soldier piles. For groundwater modeling, 3D underground seepage method is used and
enhances fixed state either transfer finite method analysis. It works with 3D flow limit area
situation, completely designed with digging and stress analysis. In this project, the analysis
work was carried out to identify the best-suited conditions among the two given alternatives.
At first, we need to do the analysis for the first condition (Paullo Muñoz & Roehl, 2017). For
that, we need to design the slope in the tunnel position. And the slope angle was 90 degree
between the developed tunnel and the pipeline. The second condition was similar to the first
condition but her we need to change the angle between the tunnel and pipeline from 90
degrees to 60degree(Cai, 2012). After the development stage, we need to carry out the
simulation in the same software used for the design. Then all the results, as well as graphs,
are showed need to be generated. Also, the plot of the net effective-stress, as well as overall
displacement graphs, is plotted. These graphs are used to quick analyzing purposes. Plots
give the better understanding than the setoff values or any tables. So they are highly
preferable.
pg. 5
⊘ This is a preview!⊘
Do you want full access?
Subscribe today to unlock all pages.
Trusted by 1+ million students worldwide
2. RESEARCH PROCEDURES
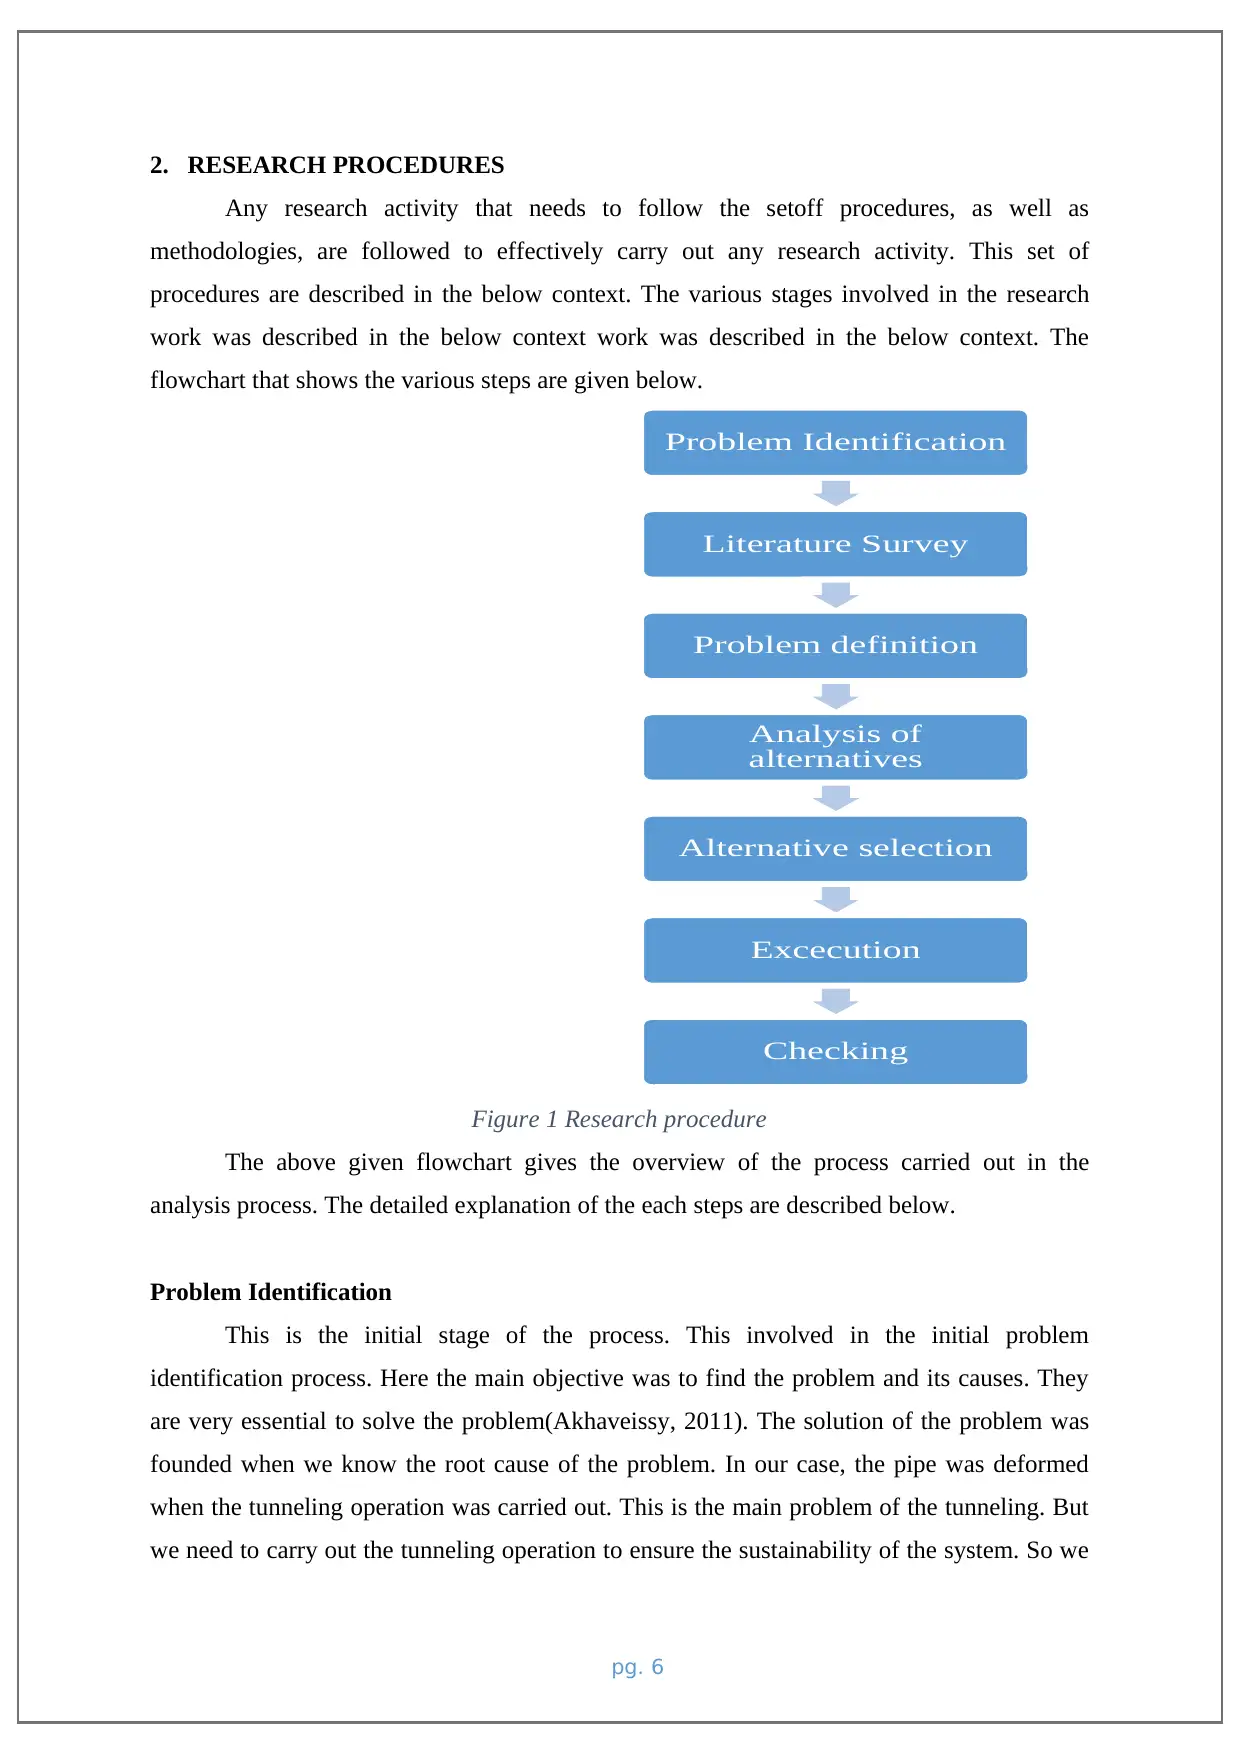
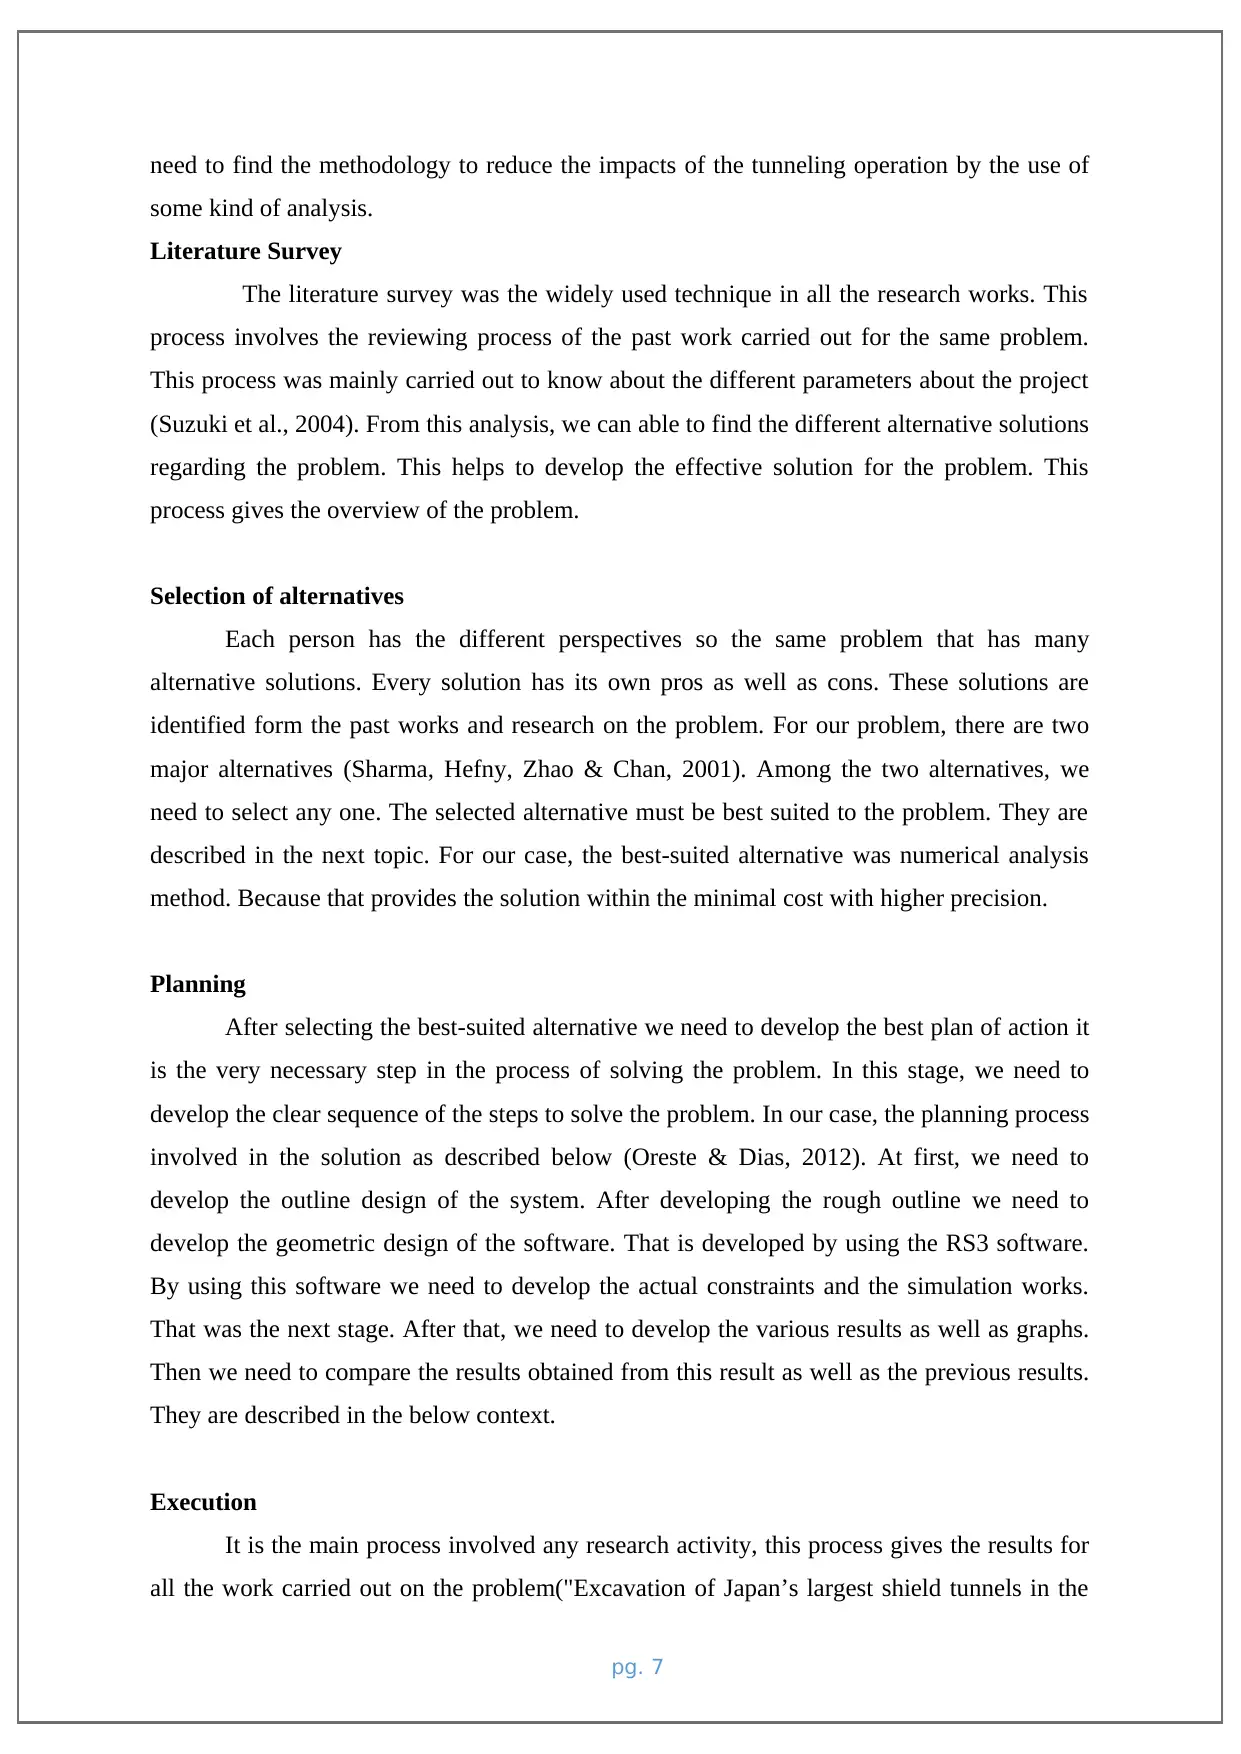
Any research activity that needs to follow the setoff procedures, as well as
methodologies, are followed to effectively carry out any research activity. This set of
procedures are described in the below context. The various stages involved in the research
work was described in the below context work was described in the below context. The
flowchart that shows the various steps are given below.
Figure 1 Research procedure
The above given flowchart gives the overview of the process carried out in the
analysis process. The detailed explanation of the each steps are described below.
Problem Identification
This is the initial stage of the process. This involved in the initial problem
identification process. Here the main objective was to find the problem and its causes. They
are very essential to solve the problem(Akhaveissy, 2011). The solution of the problem was
founded when we know the root cause of the problem. In our case, the pipe was deformed
when the tunneling operation was carried out. This is the main problem of the tunneling. But
we need to carry out the tunneling operation to ensure the sustainability of the system. So we
pg. 6
Problem Identification
Literature Survey
Problem definition
Analysis of
alternatives
Alternative selection
Excecution
Checking
Paraphrase This Document
Need a fresh take? Get an instant paraphrase of this document with our AI Paraphraser
need to find the methodology to reduce the impacts of the tunneling operation by the use of
some kind of analysis.
Literature Survey
The literature survey was the widely used technique in all the research works. This
process involves the reviewing process of the past work carried out for the same problem.
This process was mainly carried out to know about the different parameters about the project
(Suzuki et al., 2004). From this analysis, we can able to find the different alternative solutions
regarding the problem. This helps to develop the effective solution for the problem. This
process gives the overview of the problem.
Selection of alternatives
Each person has the different perspectives so the same problem that has many
alternative solutions. Every solution has its own pros as well as cons. These solutions are
identified form the past works and research on the problem. For our problem, there are two
major alternatives (Sharma, Hefny, Zhao & Chan, 2001). Among the two alternatives, we
need to select any one. The selected alternative must be best suited to the problem. They are
described in the next topic. For our case, the best-suited alternative was numerical analysis
method. Because that provides the solution within the minimal cost with higher precision.
Planning
After selecting the best-suited alternative we need to develop the best plan of action it
is the very necessary step in the process of solving the problem. In this stage, we need to
develop the clear sequence of the steps to solve the problem. In our case, the planning process
involved in the solution as described below (Oreste & Dias, 2012). At first, we need to
develop the outline design of the system. After developing the rough outline we need to
develop the geometric design of the software. That is developed by using the RS3 software.
By using this software we need to develop the actual constraints and the simulation works.
That was the next stage. After that, we need to develop the various results as well as graphs.
Then we need to compare the results obtained from this result as well as the previous results.
They are described in the below context.
Execution
It is the main process involved any research activity, this process gives the results for
all the work carried out on the problem("Excavation of Japan’s largest shield tunnels in the
pg. 7
heart of Tokyo Metropolitan area - the Nishi-Shinjuku Tunnel", 2004). Here we need to
implement the plan to achieve the desired results. Here the developed plan was the guidelines
for the actual process.
Checking
This is the final stage of the process, after this process, the research work started again
from the first. This process involves the controlling activities in the process. Here we need to
measure the actual process and compare it with the plan. We need to calculate the deviations
in the actual plan vs. actual process outcomes. The corrective actions were taken based on the
deviations measured during this stage.
3. AIM OF THE PROJECT
The main objectives of the project were listed in the below context. So we need to
accomplish the below-given objectives.
• To study the basic tunneling and its impacts.
• To develop the design of the tunnel system.
• To simulate the developed design for the given conditions.
a. For the inclination angle of 90 degrees.
b. For the inclination angle of 60 degrees.
• Generate the graphs and plots for the simulation.
4. LITERATURE REVIEW
‘‘Boonyarak.T carries out the research to analyze the effects of constructing the new
tunnel nearer to the pipes and tunnels. And he found that the new tunnel construction causes
the deformation in the existing tunnels. The new tunnel construction develops the stress on
the existing tunnel or pipelines (Sharma, Hefny, Zhao & Chan, 2001). The developed stress
causes the strain on the pipes or tunnels. That also leads to failure of the tunnel or pipeline
system. Which was found in the research? To found these results he carried out the 3D
simulation of the tunnel system. From this analysis, he founded that the deformation was
measured as .3% in the diameter of the existing system by the construction of the new
system. The new construction acts as a load to the existing system. In the vertical direction of
the tunnel or pipes, the deformation was high. It is the conclusion given by him from his
research work.
pg. 8
⊘ This is a preview!⊘
Do you want full access?
Subscribe today to unlock all pages.
Trusted by 1+ million students worldwide
In this the problematic issues of tunnel digging with pipelines where discussed
according to 'Jiangwei Shi'. When tunnel digging takes the stress that it changes the
importance of the ground soil and disturbs the nearby pipelines. When he analyzes before few
years tunnel pipe crossing issues is like the stage struggle difficulties and his target is based
on pipelining crossing the tunnel vertically. After his analysis, he handles the centrifugal test.
That is based on the inserting the pipelines in a different way according to the direction of the
pipeline. For e.g. when the tunnel is in (1.25diameter) distance from pipeline then that
reduced the interaction of pipe. Most of the issues can be deducted when tunnel cross
vertically and at the same time the problem arises on upon the tunnel centerline.so when that
is crossed the tunnel at the angle of 60degree the destination will be changed. These are the
problem faced in digging. In this analysis, he used the aluminum as well as steel pipes.
Because they are the common materials used to build the pipes. They also provide the better
strength as well as life. He used the numerical analysis as well as experimental methods for
this problem. For his analysis, he makes the prototype of the system for experimental setup.
This is the most convenient method for the analysis. Because we can’t able to measure the
actual parameters of the tunnel. Due to very huge size. That’s the reason for using the
prototype model. Prototype means the miniature of the actual element. That has all the
functional elements of the actual element. The prototype was made by the same material used
in the actual model. Here the pipe was attached with the serious of strain gauges, to measure
the actual strain caused by the tunnel. This system effectively measures the strain caused by
the tunnel. For measuring the strain of the system he used the LVDT sensor. These sensors
have the good decent accuracy. Form the research work he found that the tunneling action
creates the large amount of stress on the existing pipes and the structures. That causes the
deformation of the pipes and structures. Also he found that the tunneling action carried out on
the same direction of the pipe line. This is the reason for the maximum deformation on the
pipe. So he suggested that the inclined pipe system provides better results.
‘Mr.Wei’ is using a small shot of calculation on tunnel development. He is using a
procedure for the arrangement on deposal of soil. According to Winkler justification the
design for subway pipelines endangerment. The formula for this is process assigned by
Tunnel plane spacing L, Soil loss ratio ηl/ηf, Pipeline requirements, and Pipeline depth h. At
last, the soil disposal changes the reaction of the problem changes by straight spacing and
makes the changeover in the endangerment of soil disposal. This gives the edge value of the
pipelines importance effect and shape of the curve and changes the ratio. This calculation
pg. 9
Paraphrase This Document
Need a fresh take? Get an instant paraphrase of this document with our AI Paraphraser
comes across the major problems in tunnel developments. By using this formulated reaction
the range of the subway pipeline will come to an end. A tunnel as it only interrupts vertically.
‘VORSTER’ governs an experiment on cylinder pipeline in North India in 3 different
ways. They are observing of a stimulating high diameter, Numerical analysis and Comprising
centrifugal modeling. This is executed mechanism of soil leading intersection of tunnel
pipeline development. By doing this the people who struggle in traffic problems get a great
relief. The main reason for this tunnel digging is for controlling these problems. But when
these tunneling process takes place lots of problems and changes taken over underground
format in that the main problems are soil disposal and pipelining (Kim, 2014). After the
problem analysis, the tunnel is designed. Improved the higher and lower accurate with the
width parameter K. That sinks with the underground condition. They loss the green field
logic and convince volume with different closeness and deep to connect pipelines. The design
scale is 1:75 widths the high diameter in Cambridge separator. In this, the performance of
pipeline number of local and global developments and pipeline sectional varieties are
affected. They are subsequent pipeline performance, relative pipelines, and soil inflexibility.
So the damaged ground is equalized distance of pipelines. This process is formulated with the
basic balanced pipeline model. When both soil inflexibility and pipelining are changing its
comfort zone according to the formalized sector that is based on green are an underground
act. After the long examination of the pipeline performance, the information of the field says
that pipelines in ground reactions may change its performance. While starting it acts normal
pipeline but it can connect each other and modify its state. The lesson of tunnel and pipeline
can notice by the sensors action during developing stage in the derivation of centrifuge
analysis and analytical designing the design was initiated. During tunneling that it the critical
to stop the process. As per the problem of the inflexibility of soil and pipelining the according
to the model.
According to the study of ‘Yong Tan’, his analysis says about the metropolitan tunnel
where huge construction building is closeness to the metropolitan area and hidden pipelines
in the closeness. In the process of digging (excavation) it is carried out by the rigid cemented
layered wall covered by pipes. The viewed behavior contains ground suitable, deviation of
diaphragm wall and construction & advantage of the pipeline. It is viewed daily on the
construction of the area on Wall deflection, Rates of deflection and more. For those huge
steel cemented construction building basement are strongly provided and for brick based
construction schematic basement is provided (Son, 2014).
pg. 10
On the Douglas, Honegger research says about the general rules for the system of
designing gas pipeline and oil. Since 1984 there is no document for this. In 1984 American
civil department engineers took the research on PRCI by two members.PRCI is a project on
Pipeline Research Council International, Inc. most of the civil engineers give their support for
seismic design (Madryas, Kolonko, Szot & Nienartowicz, n.d.). A Project was started on
pipeline seismic design with general rule on the motivation of including new techniques in
recent engineering and files are stored daily for the new report. The report given by two
researchers group is used in this project for the reason of up-to-date knowledge about
Pipeline nature, Seismic analysis of hazard and Method of analyzing.
According to the Radon, IVANOV study gives the PVC pipeline frequently get cause
due to connection disjoint on the basis of the earthquake disaster. It is huge cause when pipes
interconnect. A dealing analysis for full causes of hidden pipelines was created. The body of
the pipe is designed by line elements and plastic attachments are provided for plastic
distortion. In the ground pipes interconnection, the plastic is designed by elastic pipes. On the
basis of data test, the program is checked.
The limitation importance affect the pipeline character such as pipe wide area, rigid of
soil, wrong connection place and vulnerability diagram for these are given and cause of loss
is recognized (Wang, Jin & Ouyang, 2013). At cause of failure, an easy format of fault
mistake is given. For each angle ranges, there is a definite reason in this. The mistake of
crossing place and soil rigidness capacity are small. The reason for cause occurs on the
measurement of condensation and pull out on the specific part in pipes (Zhou et al., n.d.). The
range of endangerment is 75% failure and it can vary and 90% is added to avoid damage. The
difference between compression and failure mistake is ten times larger (Vipulanandan &
Ortega, 2005).
5. COMPARISON BETWEEN VARIOUS FEM SOFTWARES
Real 3d
The Real 3d analysis was also used for the simulation works. This is one of the reliable FEM
software. Many of the civil engineers, as well as the scientist widely, use this software to the
numerical analysis (Zhao, Li & Liu, 2011)(Kim, 2014). This software was bundled with the
pg. 11
⊘ This is a preview!⊘
Do you want full access?
Subscribe today to unlock all pages.
Trusted by 1+ million students worldwide
1 out of 41