Processed Meat and Colorectal Cancer Risk: A Pooled Analysis of Three Italian Case-Control
VerifiedAdded on 2022/08/26
|8
|5971
|18
AI Summary
Contribute Materials
Your contribution can guide someone’s learning journey. Share your
documents today.
Full Terms & Conditions of access and use can be found at
http://www.tandfonline.com/action/journalInformation?journalCode=hnuc20
Download by: [University of Warwick] Date: 21 April 2017, At: 05:28
Nutrition and Cancer
ISSN: 0163-5581 (Print) 1532-7914 (Online) Journal homepage: http://www.tandfonline.com/loi/hnuc20
Processed Meat and Colorectal Cancer Risk: A
Pooled Analysis of Three Italian Case-Control
Studies
Valentina Rosato, Alessandra Tavani, Eva Negri, Diego Serraino, Maurizio
Montella, Adriano Decarli, Carlo La Vecchia & Monica Ferraroni
To cite this article:Valentina Rosato, Alessandra Tavani, Eva Negri, Diego Serraino, Maurizio
Montella, Adriano Decarli, Carlo La Vecchia & Monica Ferraroni (2017): Processed Meat and
Colorectal Cancer Risk: A Pooled Analysis of Three Italian Case-Control Studies, Nutrition and
Cancer, DOI: 10.1080/01635581.2017.1310259
To link to this article: http://dx.doi.org/10.1080/01635581.2017.1310259
Published online: 20 Apr 2017.
Submit your article to this journal
View related articles
View Crossmark data
Secure Best Marks with AI Grader
Need help grading? Try our AI Grader for instant feedback on your assignments.
Processed Meat and Colorectal Cancer Risk: A Pooled Analysis of Three Italian
Case-Control Studies
Valentina Rosatoa, Alessandra Tavanib, Eva Negric, Diego Serrainod, Maurizio Montellae, Adriano Decarlia,f,
Carlo La Vecchiaa, and Monica Ferraronia
aBranch of Medical Statistics, Biometry and Epidemiology “G.A. Maccacaro”, Department of Clinical Sciences and Community H
of Milan, Milan, Italy;bMilan, Italy;cDepartment of Biomedical and Clinical Sciences, University of Milan, Milan, Italy;dCancer Epidemiology Unit,
CRO Aviano National Cancer Institute IRCCS, Aviano, Italy;eUnit of Epidemiology, National Cancer Institute, G. Pascale Foundation, Naples, Ital
fUnit of Medical Statistics, Biometry and Bioinformatics, National Cancer Institute, IRCCS Foundation, Milan, Italy
ARTICLE HISTORY
Received 7 June 2016
Accepted 9 March 2017
ABSTRACT
To add evidence to the limited data available from southern Europe,we assessed the association
between processed meat consumption and colorectalcancer risk.We analyzed data from three
case-control studies conducted between 1985 and 2010 in various Italian areas,including a total of
3745 incident cases and 6804 hospital-based controls.We calculated odds ratios (ORs)and 95%
confidence intervals(CIs)by unconditionalmultiple logisticregression models.The median
consumption ofprocessed meatwas around 20 g/day both in cases and controls.The OR of
colorectalcancer was 1.02 (95% CI0.99–1.04) for an increase of 10 g/day of processed meat.The
association was statistically significant for colon cancer (OR 1.03,95% CI1.00–1.06),particularly for
proximalcolon cancer (OR 1.09,95% CI1.04–1.14),while there was no relation with rectalcancer
(OR 0.99,95% CI0.95–1.03).The OR of proximalcolon cancer was 1.38 (95% CI1.08–1.75) for the
highest sex-specific tertile of consumption (>25 g/day for men,>21.5 for women) compared with
the lowest (<15 g/day),whereas no significant ORs were found for other anatomicalsubsites.Our
findingsindicate thatthere isno association with colorectalcanceroverall,in the presence,
however, of a positive association with proximal colon cancer.
Introduction
Processed meatdenotesmeattransformed by salting,
curing,fermentation,smoking, or other processes aimed
to enhancing flavoror improving preservation.Proc-
essed meat includes,among others,ham,bacon,salami,
sausages, and hot dogs (1). Processed meat, compared to
unprocessed meat, generally contains more fat and more
additives due to long-time storage.
The InternationalAgency forResearch on Cancer
(IARC) classified processed meatas carcinogenicto
humansbased on sufficientevidencethat its con-
sumptioncausescolorectalcancer(1). The IARC
report quoteda meta-analysispublishedin 2011,
which showed a 18% excess risk ofcolorectalcancer
for an increase of50 g/day ofprocessed meatcon-
sumption (2).Of the 9 cohort studiesincluded in
thatmeta-analysis,4 were conducted in the USA,1
in Australia,and the remaining 4 in Europe.How-
ever,of the European studies,only the European Pro-
spectiveInvestigationinto Cancer and Nutrition
(EPIC) cohortincluded a minority ofcentersfrom
southern Europe(2,3),wheretypeand quantity of
processed meatconsumption and,morein general,
diet differ from those of USA/northern Europe.
Meat is a source ofproteins,minerals,and vita-
mins,but it is also rich in fats,salt,and some chemi-
cal substances,including n-nitroso compounds,
polycyclic-aromatichydrocarbons,and heterocyclic
aromatic-aminesdeveloped through meatprocessing,
preservation,and cooking,which have been hypothe-
sized to be associated with increased risk ofcancer
and other diseases(4,5). However,the qualityof
processed meatvaries across countries and,in partic-
ular,processed meatproduced and consumed in Italy
is characterized by lowercontentsof fats,salt,and
nitrites/nitrates (6).
To add evidence to the limited data available from
southern Europe,we assessed the association between
processed meat consumption and colorectal cancer risk,
using pooled data from three Italian case-control studies.
CONTACT Monica Ferraronimonica.ferraroni@unimi.itLaboratorio di Statistica Medica, Biometria ed Epidemiologia “G.A. Maccacaro”, Dipartimento d
Scienze Cliniche e di Comunita, Universita degli Studi di Milano, Campus Cascina Rosa – Via A. Vanzetti 5, 20133 Milano, Italy.
© 2017 Taylor & Francis Group, LLC
NUTRITION AND CANCER
2017, VOL. 0, NO. 0, 1–7
http://dx.doi.org/10.1080/01635581.2017.1310259
Material and Methods
Study Population
Between 1985 and 2010,we conducted three case-control
studies on risk factors for colorectal cancer in various Ital-
ian areas, using similar study protocols. The first study was
conducted between 1985 and 1991 in the urban area of
Milan (northern Italy) and included 1,326 colorectal cancer
cases (median age 62,range 20–74 yr) and 2,081 controls
(median age 55,range 19–74 yr) (7);the second was con-
ducted between 1992 and 1996 in the urban areas of Milan
and Genoa,the provincesof Pordenone,Gorizia,Forlı
(northern Italy),Latina (centralItaly),and the urban area
of Naples (southern Italy),and included 1,953 colorectal
cancer cases (median age 62,range 19–74 yr) and 4,154
controls (median age 58, range 19–74 yr) (8); the third one
was conducted between 2008 and 2010 in the greater Milan
and the provincesof Pordenone and Udine (northern
Italy),and included 466 colorectalcancer cases (median
age 67,range 35–80 yr) and 569 controls (median age 66,
range 31–80 yr) (9).Thus,overall,3,745 colorectal cancer
cases and 6,804 controls were enrolled. Cases were incident,
histologically confirmed colorectalcancer patients,admit-
ted to major teaching and generalhospitals ofthe study
areas. Overall, 488 cases had a diagnosis of proximal colon
cancer(i.e.,appendix,caecum,ascending colon,hepatic
flexure,and transverse colon,ICD-10 C18.0–C18.4);1,078
of distal colon cancer (i.e.,splenic flexure,descending,and
sigmoid colon,ICD-10 C18.5–C18.7);788 of overlapping
or nototherwise specified colon cancer (ICD-10 C18.8–
C18.9);1,383 had a diagnosis of rectal cancer (i.e.,rectum
and rectosigmoid junction,ICD-10 C19.9–C20.9);and the
remaining 8 subjects had a not otherwise specified colorec-
tal cancer.In the three studies,controlswere subjects
admitted to the same hospitals as cases for a wide spectrum
of acute,nonneoplasticconditionsunrelated to factors
likely related to colorectal cancer. Overall, 28.0% of the con-
trol subjects were admitted for traumatic conditions, 24.1%
for other orthopedic disorders,23.2% for acute surgical
conditions, 12.4% for eye diseases, and 12.3% for miscella-
neous other illnesses,including nose,ear,skin,or dental
disorder.
Ad-hoc-trained personnel interviewed by face to face all
subjects during their hospital stay by using structured ques-
tionnaires that included sociodemographic factors,lifestyle
habits(e.g.,tobaccosmoking,and alcoholdrinking),
anthropometric measures,physical activity,a problem-ori-
ented medical history,and family history of cancer.Infor-
mation on patients’usualdietbefore diagnosis/interview
wasassessed through similarfood frequency question-
naires, collecting information on weekly consumption of 29
selected food items in the first study (10),78 foods,food
groups, or recipes in the second study, and 56 food items in
the mostrecentone (11).Occasionalintake (lower than
once a week,but at least once a month) was coded as 0.5/
wk. Total processed meat was calculated as the sum of three
food items (cured ham,boiled ham,and salami/sausages)
for the first study,three food items (cured ham/bresaola/
speck,boiled ham,salami/mortadella/w€urstel/bacon/sau-
sages) for the second study,and one food item (allproc-
essedmeats)for the third study.Processedmeat
consumption was expressed in grams per day (g/day),by
dividing weekly frequency ofconsumption—an average
serving in the Italian diet,i.e.,50 g—by 7.The question-
naires ofthe three studies were tested for reproducibility
(10–12),and the second study was also tested for validity
(13), giving satisfactory results. Intake of nutrients and total
energy was computed using ad-hoc-developed food compo-
sition databases (14,15).
The study protocols were approved by the ethical review
boards of the participating centers, according to the regula-
tions atthe time ofeach study conduction,and for the
third,most recentstudy,all subjects signed an informed
consentbefore recruitment.On average,less than 5% of
the cases and controls approached refused to participate.
Statistical Analysis
Odds ratios (ORs) for an increase of 10 g/day of proc-
essed meatconsumption,and the corresponding 95%
confidence intervals (CIs),were estimated by uncondi-
tional multiple logistic regression models (16). Processed
meat consumption was also categorized in approximate
sex-specific tertiles ofconsumption among allcontrols
(corresponding to <15 g/day for both men and women,
in the first tertile;15–25 g/day for men and 15–21.5 for
women,in the second tertile;and >25 g/day for men
and >21.5 g/day for women,in the third tertile).The
models included terms for age (quinquennia),sex,cen-
ter, study period, year of interview, education (<7, 7–11,
12 yr), tobacco smoking (never,former since at least
1 yr,current <20 cigarettes/day,current 20 cigarettes/
day),alcohol drinking (<1,1–<4,4 drinks/day),body
massindex (<25,25–<30,30 kg/m 2), occupational
physical activity (low, medium, high activity level, except
for Study I),vegetables(study-specific tertilesamong
controls),fruit (study-specific tertiles among controls),
totalenergy intake (study-specific quintiles among con-
trols),and family history ofintestinalcancer in first-
degree relatives. Missing values for adjustment covariates
were imputed as median value and included in the mod-
els.Testfor linear trend was based on the likelihood-
ratio test between the models with and without a linear
term identifying exposure category.Stratified analyses
were carried out according to selected variables, and het-
erogeneity acrossstrata wastested by computing the
2 V. ROSATO ET AL.
difference in the ¡2 log likelihood ofthe models with
and without the interaction terms.The combined effect
of processed meat with fiber intake was assessed in the
second and third studies combined (fiber intake was not
estimated in the first study) through a variable represent-
ing available combinations ofapproximate sex-specific
tertiles of fiber intake and approximate sex-specific ter-
tiles of processed meat.All statistical analyses were per-
formed with SAS 9.2 statisticalsoftware (SAS Institute,
Cary, NC, USA).
Results
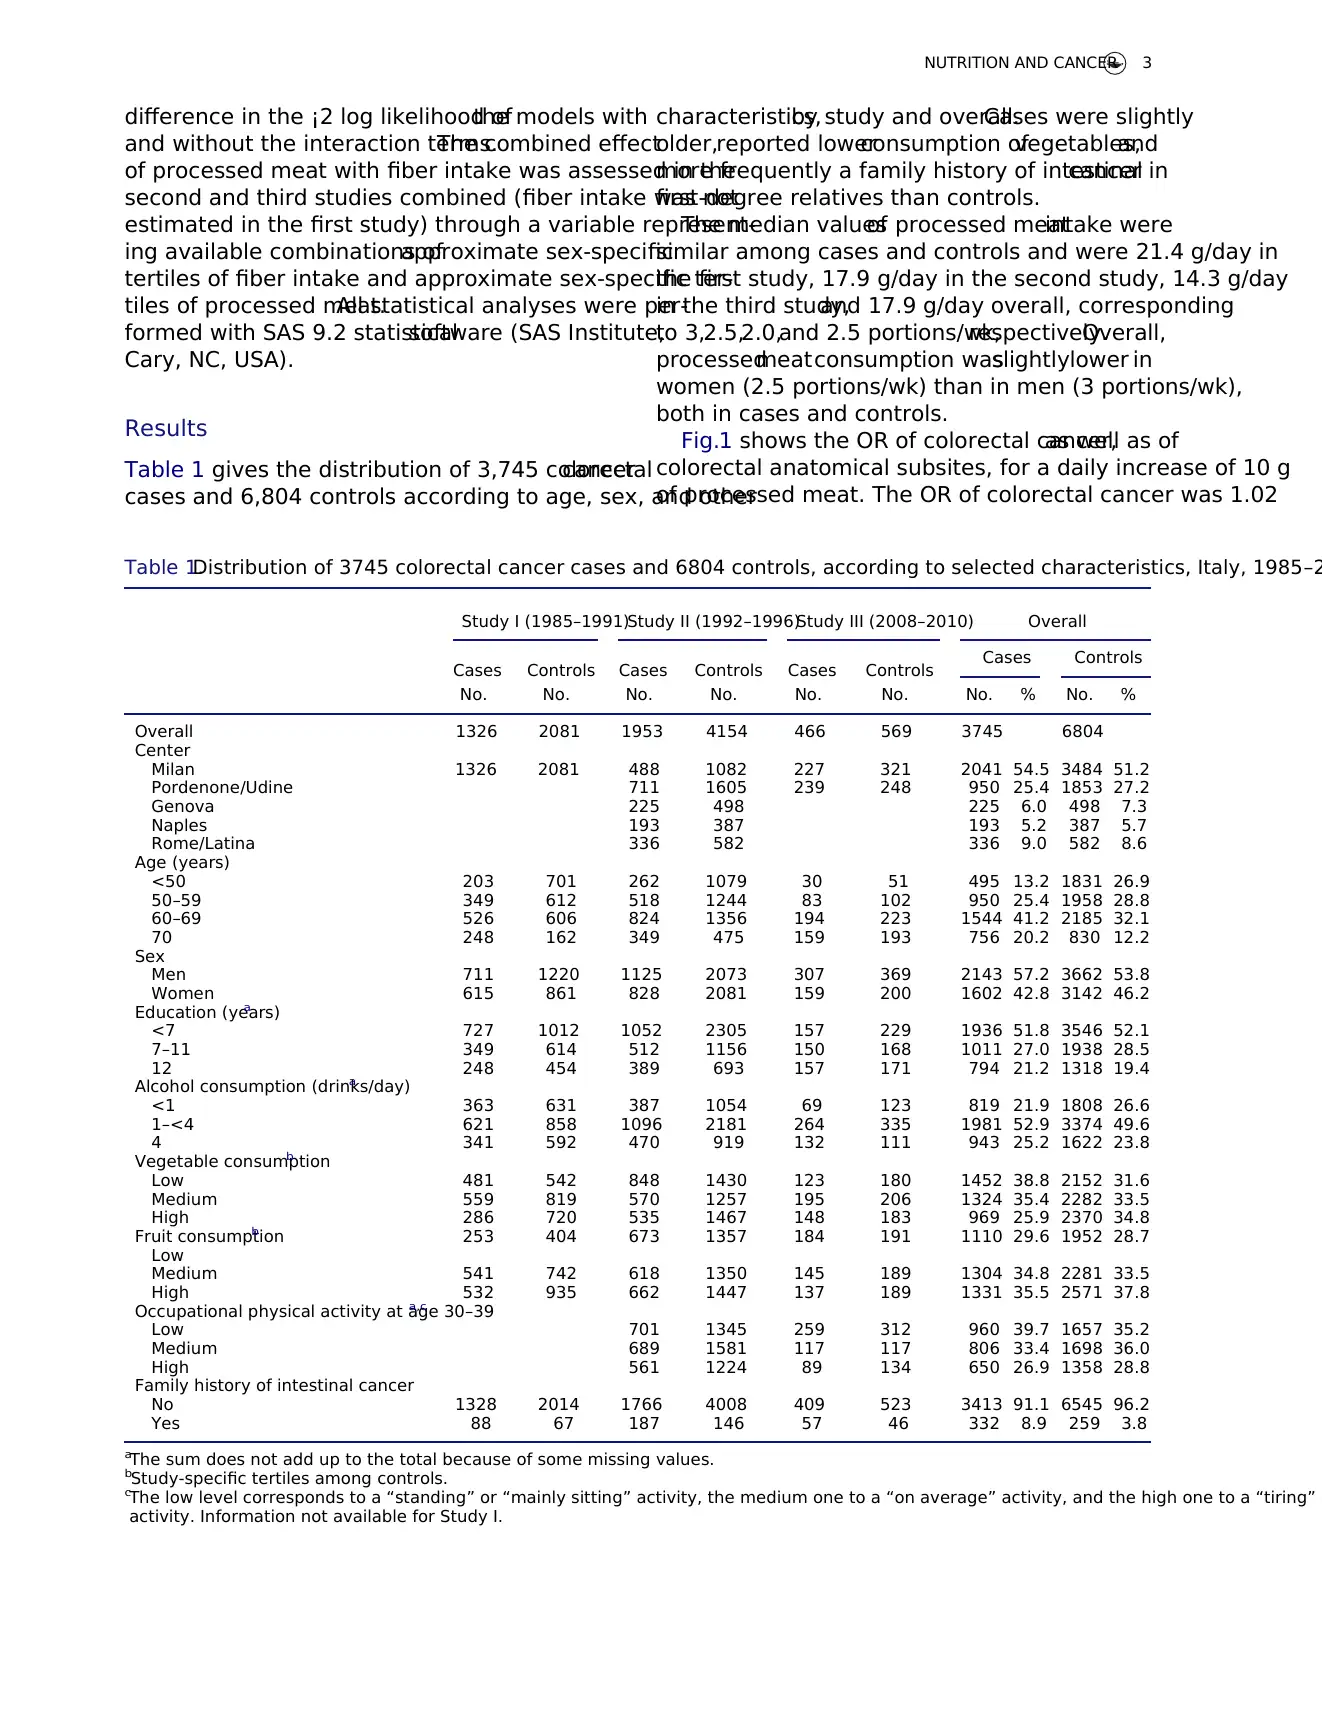
Table 1 gives the distribution of 3,745 colorectalcancer
cases and 6,804 controls according to age, sex, and other
characteristics,by study and overall.Cases were slightly
older,reported lowerconsumption ofvegetables,and
more frequently a family history of intestinalcancer in
first-degree relatives than controls.
The median valuesof processed meatintake were
similar among cases and controls and were 21.4 g/day in
the first study, 17.9 g/day in the second study, 14.3 g/day
in the third study,and 17.9 g/day overall, corresponding
to 3,2.5,2.0,and 2.5 portions/wk,respectively.Overall,
processedmeatconsumption wasslightlylower in
women (2.5 portions/wk) than in men (3 portions/wk),
both in cases and controls.
Fig.1 shows the OR of colorectal cancer,as well as of
colorectal anatomical subsites, for a daily increase of 10 g
of processed meat. The OR of colorectal cancer was 1.02
Table 1.Distribution of 3745 colorectal cancer cases and 6804 controls, according to selected characteristics, Italy, 1985–2
Study I (1985–1991)Study II (1992–1996)Study III (2008–2010) Overall
Cases Controls Cases Controls Cases Controls Cases Controls
No. No. No. No. No. No. No. % No. %
Overall 1326 2081 1953 4154 466 569 3745 6804
Center
Milan 1326 2081 488 1082 227 321 2041 54.5 3484 51.2
Pordenone/Udine 711 1605 239 248 950 25.4 1853 27.2
Genova 225 498 225 6.0 498 7.3
Naples 193 387 193 5.2 387 5.7
Rome/Latina 336 582 336 9.0 582 8.6
Age (years)
<50 203 701 262 1079 30 51 495 13.2 1831 26.9
50–59 349 612 518 1244 83 102 950 25.4 1958 28.8
60–69 526 606 824 1356 194 223 1544 41.2 2185 32.1
70 248 162 349 475 159 193 756 20.2 830 12.2
Sex
Men 711 1220 1125 2073 307 369 2143 57.2 3662 53.8
Women 615 861 828 2081 159 200 1602 42.8 3142 46.2
Education (years)a
<7 727 1012 1052 2305 157 229 1936 51.8 3546 52.1
7–11 349 614 512 1156 150 168 1011 27.0 1938 28.5
12 248 454 389 693 157 171 794 21.2 1318 19.4
Alcohol consumption (drinks/day)a
<1 363 631 387 1054 69 123 819 21.9 1808 26.6
1–<4 621 858 1096 2181 264 335 1981 52.9 3374 49.6
4 341 592 470 919 132 111 943 25.2 1622 23.8
Vegetable consumptionb
Low 481 542 848 1430 123 180 1452 38.8 2152 31.6
Medium 559 819 570 1257 195 206 1324 35.4 2282 33.5
High 286 720 535 1467 148 183 969 25.9 2370 34.8
Fruit consumptionb 253 404 673 1357 184 191 1110 29.6 1952 28.7
Low
Medium 541 742 618 1350 145 189 1304 34.8 2281 33.5
High 532 935 662 1447 137 189 1331 35.5 2571 37.8
Occupational physical activity at age 30–39a,c
Low 701 1345 259 312 960 39.7 1657 35.2
Medium 689 1581 117 117 806 33.4 1698 36.0
High 561 1224 89 134 650 26.9 1358 28.8
Family history of intestinal cancer
No 1328 2014 1766 4008 409 523 3413 91.1 6545 96.2
Yes 88 67 187 146 57 46 332 8.9 259 3.8
aThe sum does not add up to the total because of some missing values.
bStudy-specific tertiles among controls.
cThe low level corresponds to a “standing” or “mainly sitting” activity, the medium one to a “on average” activity, and the high one to a “tiring” o
activity. Information not available for Study I.
NUTRITION AND CANCER 3
and without the interaction terms.The combined effect
of processed meat with fiber intake was assessed in the
second and third studies combined (fiber intake was not
estimated in the first study) through a variable represent-
ing available combinations ofapproximate sex-specific
tertiles of fiber intake and approximate sex-specific ter-
tiles of processed meat.All statistical analyses were per-
formed with SAS 9.2 statisticalsoftware (SAS Institute,
Cary, NC, USA).
Results
Table 1 gives the distribution of 3,745 colorectalcancer
cases and 6,804 controls according to age, sex, and other
characteristics,by study and overall.Cases were slightly
older,reported lowerconsumption ofvegetables,and
more frequently a family history of intestinalcancer in
first-degree relatives than controls.
The median valuesof processed meatintake were
similar among cases and controls and were 21.4 g/day in
the first study, 17.9 g/day in the second study, 14.3 g/day
in the third study,and 17.9 g/day overall, corresponding
to 3,2.5,2.0,and 2.5 portions/wk,respectively.Overall,
processedmeatconsumption wasslightlylower in
women (2.5 portions/wk) than in men (3 portions/wk),
both in cases and controls.
Fig.1 shows the OR of colorectal cancer,as well as of
colorectal anatomical subsites, for a daily increase of 10 g
of processed meat. The OR of colorectal cancer was 1.02
Table 1.Distribution of 3745 colorectal cancer cases and 6804 controls, according to selected characteristics, Italy, 1985–2
Study I (1985–1991)Study II (1992–1996)Study III (2008–2010) Overall
Cases Controls Cases Controls Cases Controls Cases Controls
No. No. No. No. No. No. No. % No. %
Overall 1326 2081 1953 4154 466 569 3745 6804
Center
Milan 1326 2081 488 1082 227 321 2041 54.5 3484 51.2
Pordenone/Udine 711 1605 239 248 950 25.4 1853 27.2
Genova 225 498 225 6.0 498 7.3
Naples 193 387 193 5.2 387 5.7
Rome/Latina 336 582 336 9.0 582 8.6
Age (years)
<50 203 701 262 1079 30 51 495 13.2 1831 26.9
50–59 349 612 518 1244 83 102 950 25.4 1958 28.8
60–69 526 606 824 1356 194 223 1544 41.2 2185 32.1
70 248 162 349 475 159 193 756 20.2 830 12.2
Sex
Men 711 1220 1125 2073 307 369 2143 57.2 3662 53.8
Women 615 861 828 2081 159 200 1602 42.8 3142 46.2
Education (years)a
<7 727 1012 1052 2305 157 229 1936 51.8 3546 52.1
7–11 349 614 512 1156 150 168 1011 27.0 1938 28.5
12 248 454 389 693 157 171 794 21.2 1318 19.4
Alcohol consumption (drinks/day)a
<1 363 631 387 1054 69 123 819 21.9 1808 26.6
1–<4 621 858 1096 2181 264 335 1981 52.9 3374 49.6
4 341 592 470 919 132 111 943 25.2 1622 23.8
Vegetable consumptionb
Low 481 542 848 1430 123 180 1452 38.8 2152 31.6
Medium 559 819 570 1257 195 206 1324 35.4 2282 33.5
High 286 720 535 1467 148 183 969 25.9 2370 34.8
Fruit consumptionb 253 404 673 1357 184 191 1110 29.6 1952 28.7
Low
Medium 541 742 618 1350 145 189 1304 34.8 2281 33.5
High 532 935 662 1447 137 189 1331 35.5 2571 37.8
Occupational physical activity at age 30–39a,c
Low 701 1345 259 312 960 39.7 1657 35.2
Medium 689 1581 117 117 806 33.4 1698 36.0
High 561 1224 89 134 650 26.9 1358 28.8
Family history of intestinal cancer
No 1328 2014 1766 4008 409 523 3413 91.1 6545 96.2
Yes 88 67 187 146 57 46 332 8.9 259 3.8
aThe sum does not add up to the total because of some missing values.
bStudy-specific tertiles among controls.
cThe low level corresponds to a “standing” or “mainly sitting” activity, the medium one to a “on average” activity, and the high one to a “tiring” o
activity. Information not available for Study I.
NUTRITION AND CANCER 3
Secure Best Marks with AI Grader
Need help grading? Try our AI Grader for instant feedback on your assignments.
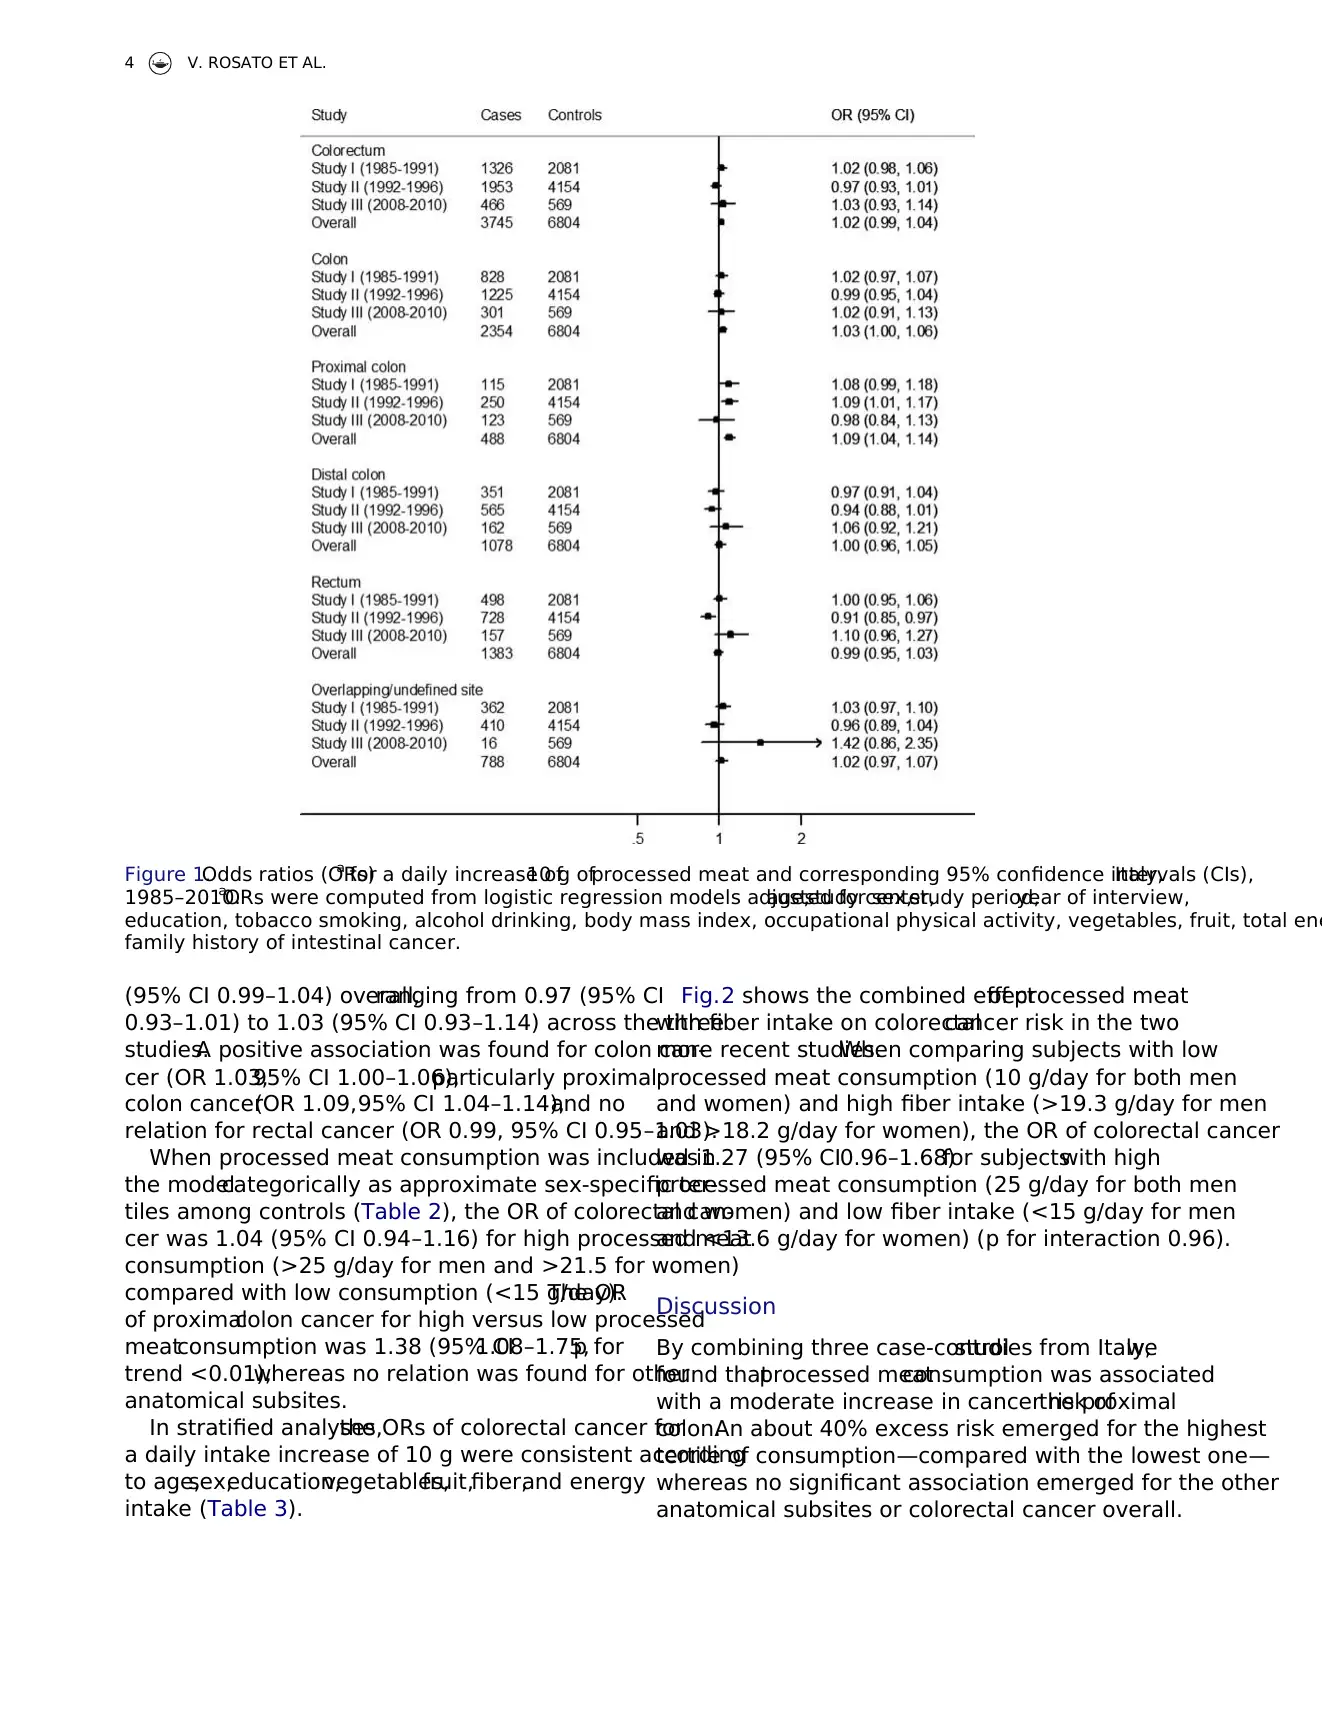
(95% CI 0.99–1.04) overall,ranging from 0.97 (95% CI
0.93–1.01) to 1.03 (95% CI 0.93–1.14) across the three
studies.A positive association was found for colon can-
cer (OR 1.03,95% CI 1.00–1.06),particularly proximal
colon cancer(OR 1.09,95% CI 1.04–1.14),and no
relation for rectal cancer (OR 0.99, 95% CI 0.95–1.03).
When processed meat consumption was included in
the modelcategorically as approximate sex-specific ter-
tiles among controls (Table 2), the OR of colorectal can-
cer was 1.04 (95% CI 0.94–1.16) for high processed meat
consumption (>25 g/day for men and >21.5 for women)
compared with low consumption (<15 g/day).The OR
of proximalcolon cancer for high versus low processed
meatconsumption was 1.38 (95% CI1.08–1.75,p for
trend <0.01),whereas no relation was found for other
anatomical subsites.
In stratified analyses,the ORs of colorectal cancer for
a daily intake increase of 10 g were consistent according
to age,sex,education,vegetables,fruit,fiber,and energy
intake (Table 3).
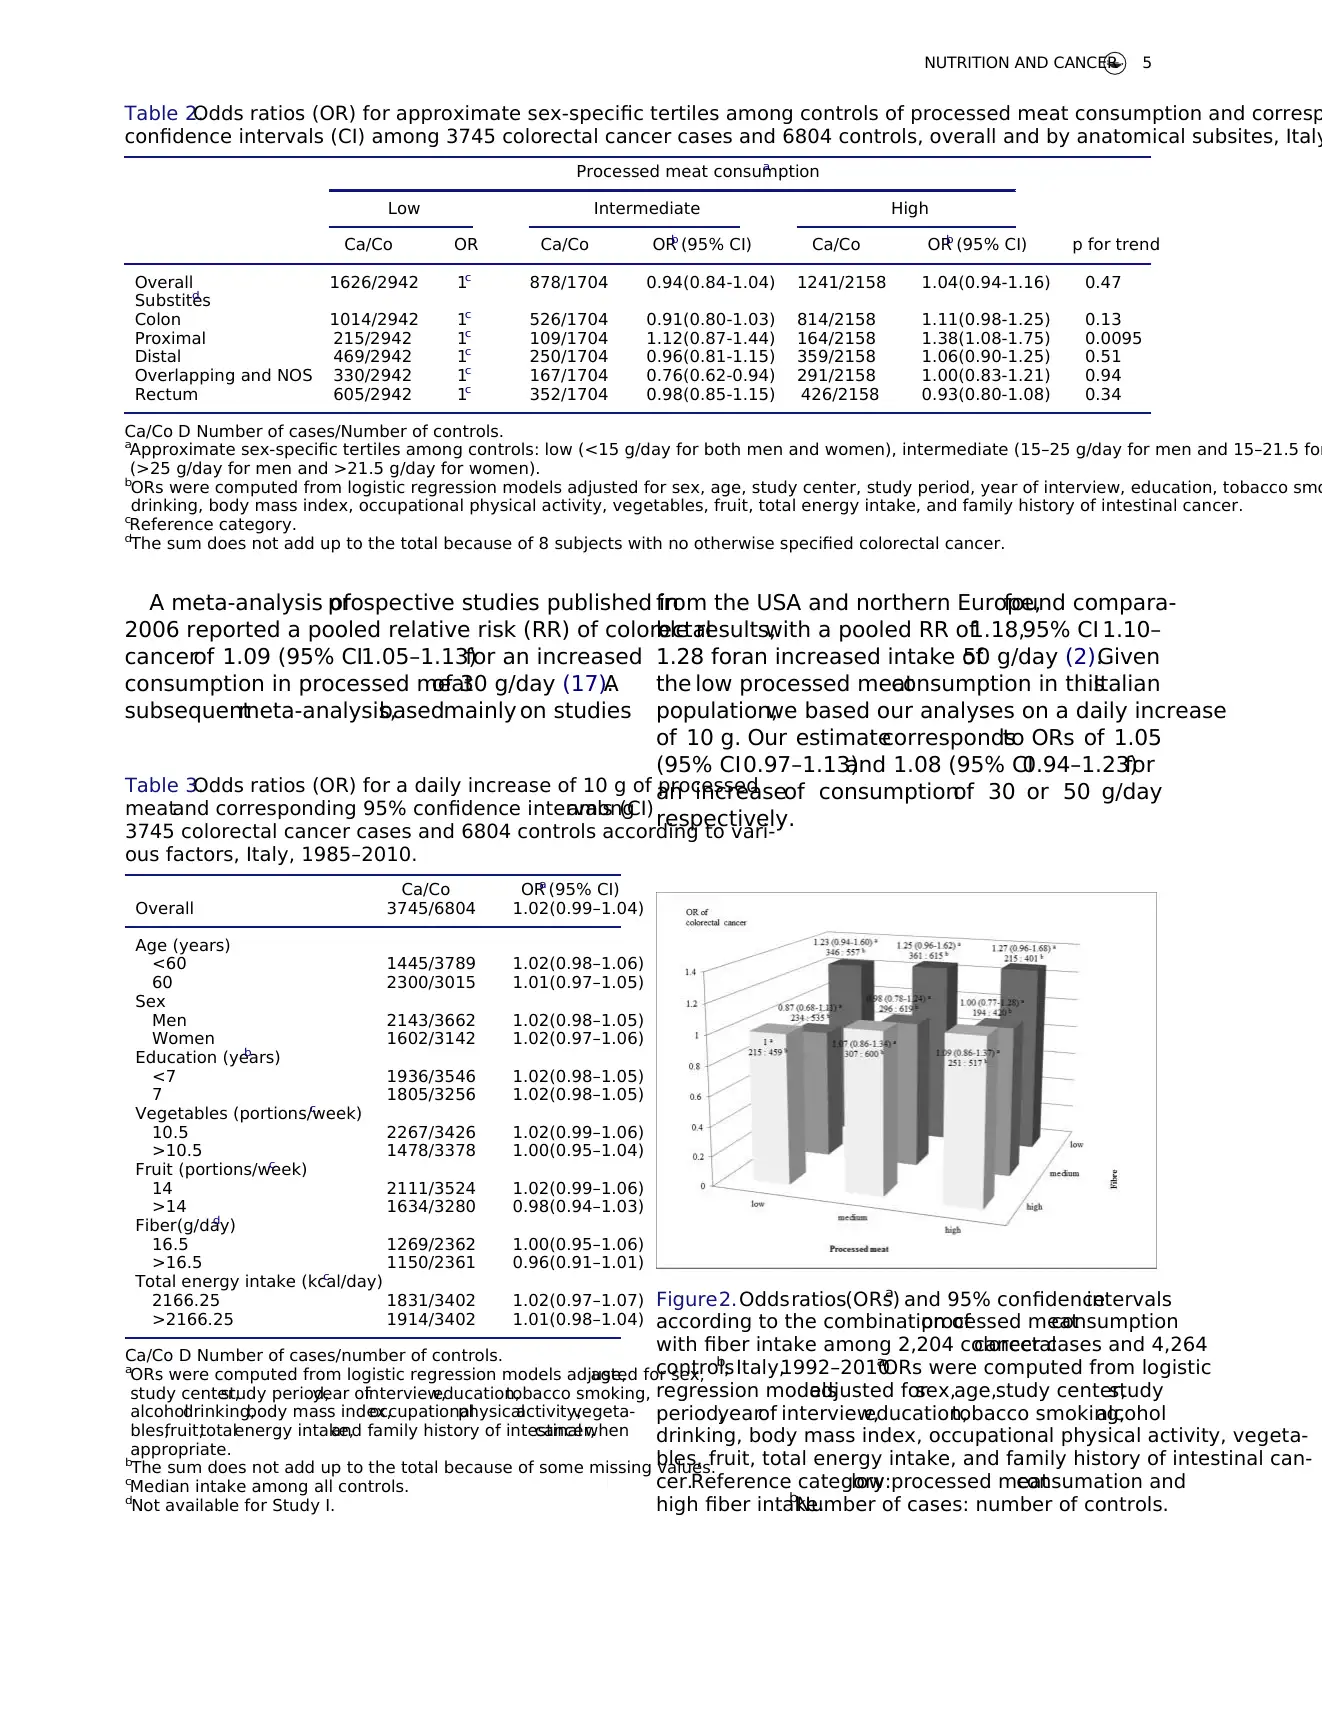
Fig.2 shows the combined effectof processed meat
with fiber intake on colorectalcancer risk in the two
more recent studies.When comparing subjects with low
processed meat consumption (10 g/day for both men
and women) and high fiber intake (>19.3 g/day for men
and >18.2 g/day for women), the OR of colorectal cancer
was 1.27 (95% CI0.96–1.68)for subjectswith high
processed meat consumption (25 g/day for both men
and women) and low fiber intake (<15 g/day for men
and <13.6 g/day for women) (p for interaction 0.96).
Discussion
By combining three case-controlstudies from Italy,we
found thatprocessed meatconsumption was associated
with a moderate increase in cancer risk ofthe proximal
colon.An about 40% excess risk emerged for the highest
tertile of consumption—compared with the lowest one—
whereas no significant association emerged for the other
anatomical subsites or colorectal cancer overall.
Figure 1.Odds ratios (ORs)a for a daily increase of10 g ofprocessed meat and corresponding 95% confidence intervals (CIs),Italy,
1985–2010.aORs were computed from logistic regression models adjusted for sex,age,study center,study period,year of interview,
education, tobacco smoking, alcohol drinking, body mass index, occupational physical activity, vegetables, fruit, total ene
family history of intestinal cancer.
4 V. ROSATO ET AL.
0.93–1.01) to 1.03 (95% CI 0.93–1.14) across the three
studies.A positive association was found for colon can-
cer (OR 1.03,95% CI 1.00–1.06),particularly proximal
colon cancer(OR 1.09,95% CI 1.04–1.14),and no
relation for rectal cancer (OR 0.99, 95% CI 0.95–1.03).
When processed meat consumption was included in
the modelcategorically as approximate sex-specific ter-
tiles among controls (Table 2), the OR of colorectal can-
cer was 1.04 (95% CI 0.94–1.16) for high processed meat
consumption (>25 g/day for men and >21.5 for women)
compared with low consumption (<15 g/day).The OR
of proximalcolon cancer for high versus low processed
meatconsumption was 1.38 (95% CI1.08–1.75,p for
trend <0.01),whereas no relation was found for other
anatomical subsites.
In stratified analyses,the ORs of colorectal cancer for
a daily intake increase of 10 g were consistent according
to age,sex,education,vegetables,fruit,fiber,and energy
intake (Table 3).
Fig.2 shows the combined effectof processed meat
with fiber intake on colorectalcancer risk in the two
more recent studies.When comparing subjects with low
processed meat consumption (10 g/day for both men
and women) and high fiber intake (>19.3 g/day for men
and >18.2 g/day for women), the OR of colorectal cancer
was 1.27 (95% CI0.96–1.68)for subjectswith high
processed meat consumption (25 g/day for both men
and women) and low fiber intake (<15 g/day for men
and <13.6 g/day for women) (p for interaction 0.96).
Discussion
By combining three case-controlstudies from Italy,we
found thatprocessed meatconsumption was associated
with a moderate increase in cancer risk ofthe proximal
colon.An about 40% excess risk emerged for the highest
tertile of consumption—compared with the lowest one—
whereas no significant association emerged for the other
anatomical subsites or colorectal cancer overall.
Figure 1.Odds ratios (ORs)a for a daily increase of10 g ofprocessed meat and corresponding 95% confidence intervals (CIs),Italy,
1985–2010.aORs were computed from logistic regression models adjusted for sex,age,study center,study period,year of interview,
education, tobacco smoking, alcohol drinking, body mass index, occupational physical activity, vegetables, fruit, total ene
family history of intestinal cancer.
4 V. ROSATO ET AL.
A meta-analysis ofprospective studies published in
2006 reported a pooled relative risk (RR) of colorectal
cancerof 1.09 (95% CI1.05–1.13)for an increased
consumption in processed meatof 30 g/day (17).A
subsequentmeta-analysis,basedmainly on studies
from the USA and northern Europe,found compara-
ble results,with a pooled RR of1.18,95% CI 1.10–
1.28 foran increased intake of50 g/day (2).Given
the low processed meatconsumption in thisItalian
population,we based our analyses on a daily increase
of 10 g. Our estimatecorrespondsto ORs of 1.05
(95% CI0.97–1.13)and 1.08 (95% CI0.94–1.23)for
an increaseof consumptionof 30 or 50 g/day
respectively.
Table 2.Odds ratios (OR) for approximate sex-specific tertiles among controls of processed meat consumption and corresp
confidence intervals (CI) among 3745 colorectal cancer cases and 6804 controls, overall and by anatomical subsites, Italy
Processed meat consumptiona
Low Intermediate High
Ca/Co OR Ca/Co ORb (95% CI) Ca/Co ORb (95% CI) p for trend
Overall 1626/2942 1c 878/1704 0.94(0.84-1.04) 1241/2158 1.04(0.94-1.16) 0.47
Substitesd
Colon 1014/2942 1c 526/1704 0.91(0.80-1.03) 814/2158 1.11(0.98-1.25) 0.13
Proximal 215/2942 1c 109/1704 1.12(0.87-1.44) 164/2158 1.38(1.08-1.75) 0.0095
Distal 469/2942 1c 250/1704 0.96(0.81-1.15) 359/2158 1.06(0.90-1.25) 0.51
Overlapping and NOS 330/2942 1c 167/1704 0.76(0.62-0.94) 291/2158 1.00(0.83-1.21) 0.94
Rectum 605/2942 1c 352/1704 0.98(0.85-1.15) 426/2158 0.93(0.80-1.08) 0.34
Ca/Co D Number of cases/Number of controls.
aApproximate sex-specific tertiles among controls: low (<15 g/day for both men and women), intermediate (15–25 g/day for men and 15–21.5 for
(>25 g/day for men and >21.5 g/day for women).
bORs were computed from logistic regression models adjusted for sex, age, study center, study period, year of interview, education, tobacco smo
drinking, body mass index, occupational physical activity, vegetables, fruit, total energy intake, and family history of intestinal cancer.
cReference category.
dThe sum does not add up to the total because of 8 subjects with no otherwise specified colorectal cancer.
Table 3.Odds ratios (OR) for a daily increase of 10 g of processed
meatand corresponding 95% confidence intervals (CI)among
3745 colorectal cancer cases and 6804 controls according to vari-
ous factors, Italy, 1985–2010.
Ca/Co ORa (95% CI)
Overall 3745/6804 1.02(0.99–1.04)
Age (years)
<60 1445/3789 1.02(0.98–1.06)
60 2300/3015 1.01(0.97–1.05)
Sex
Men 2143/3662 1.02(0.98–1.05)
Women 1602/3142 1.02(0.97–1.06)
Education (years)b
<7 1936/3546 1.02(0.98–1.05)
7 1805/3256 1.02(0.98–1.05)
Vegetables (portions/week)c
10.5 2267/3426 1.02(0.99–1.06)
>10.5 1478/3378 1.00(0.95–1.04)
Fruit (portions/week)c
14 2111/3524 1.02(0.99–1.06)
>14 1634/3280 0.98(0.94–1.03)
Fiber(g/day)d
16.5 1269/2362 1.00(0.95–1.06)
>16.5 1150/2361 0.96(0.91–1.01)
Total energy intake (kcal/day)c
2166.25 1831/3402 1.02(0.97–1.07)
>2166.25 1914/3402 1.01(0.98–1.04)
Ca/Co D Number of cases/number of controls.
aORs were computed from logistic regression models adjusted for sex,age,
study center,study period,year ofinterview,education,tobacco smoking,
alcoholdrinking,body mass index,occupationalphysicalactivity,vegeta-
bles,fruit,totalenergy intake,and family history of intestinalcancer,when
appropriate.
bThe sum does not add up to the total because of some missing values.
cMedian intake among all controls.
dNot available for Study I.
Figure2.Oddsratios(ORs)a and 95% confidenceintervals
according to the combination ofprocessed meatconsumption
with fiber intake among 2,204 colorectalcancer cases and 4,264
controlsb, Italy,1992–2010.aORs were computed from logistic
regression modelsadjusted forsex,age,study center,study
period,yearof interview,education,tobacco smoking,alcohol
drinking, body mass index, occupational physical activity, vegeta-
bles, fruit, total energy intake, and family history of intestinal can-
cer.Reference category:low processed meatconsumation and
high fiber intake.bNumber of cases: number of controls.
NUTRITION AND CANCER 5
The Italian center ofthe EPIC study—based on 101
cases of colorectal cancer—showed a nonsignificant haz-
ard ratio of 0.96 for an increase of 100 g/day of red and
processed meat(3).In thatstudy,no separate OR for
processed meat alone was reported by center.
Potential reasons for the lower risk found in the Ital-
ian population include composition of Italian processed
meatand dietary correlated ofprocessed meatintake.
Italian processedmeatsmost commonlyconsumed
include boiled and cured ham,bresaola,speck,morta-
della,w€urstel,and salamiwith lower contents in salt,
nitrates, nitrites, and saturated fatty acids than processed
meats of other countries (6). However, the weaker associ-
ation found in Italy compared to the USA or to northern
Europe may also be due to higher consumption of other
(healthier) food items in the Italian diet as compared in
other populations. Indeed, the main characteristics of the
Mediterranean diet,typicalin Italy,are high vegetable
and fruit intake and the use of olive oil, which are associ-
ated with a lower (colorectal) cancer risk (9,18).
Meatconsumption,including consumption ofproc-
essed meat,is also considerably lower in Italy as com-
pared to othergeographicalareas(19,20).Therefore,
heavy eaters of processed meat in Italy consume substan-
tially less meatproducts than heavy consumers in the
USA or in northern Europe.In this Italian population,
the average consumption of processed meat was around
20 g/day, which is lower than the average range intake of
54–92 g/day in centraland eastern Europe or 41–67 g/
day in northern Europe,and consistent with the 13–35
g/day found in southern Europe (24 g/day in Italy) (19).
Therefore,our risk estimates for the highest versus the
lowestcategoryof processed meatconsumption are
based on population-specific cutoffs,which are lower
than those of other populations (2,17).
We found a stronger excess risk for colon than for
rectal cancer in accordance with the findings of previous
meta-analyses (2,17).Our findings by colorectalcancer
subsitessuggesta progression from astrongerto a
weaker association for processed meat consumption with
cancer risk through colorectal subsites, with the stronger
association for proximal colon cancer.In contrast,some
meta-analyses showed a stronger association with high
consumption of processed meat for distal than proximal
colon cancer (2,17). Our finding on proximal colon can-
cer may be due by chance, since the results were not sig-
nificantly heterogeneous.However,proximaland distal
colon cancers may have at least different etiologies (21).
In particular,pyridine,a heterocyclic aromatic-amine,
has been found to be associated with proximal colon can-
cer but not with distalcolon cancer (22).Thus,further
studiesare needed to clarify thisissuestill open to
discussion.
With reference to possible selection bias, participation
rates were high and similar between cases and controls,
and the catchment area was comparable.Moreover,we
excluded from the control group those subjects admitted
for diagnoses thatcould be associated with long-term
dietary modifications,or related to known risk factors
for colorectal cancer.We used food frequency question-
naireswith a satisfactory reproducibility (10–12)and
validity (13),and cases and controls were interviewed in
the same hospital setting. The detailed available informa-
tion allowed to adjust our estimates for major confound-
ing variables,including body weight,physicalactivity,
and family history of the disease.It is difficult to disen-
tangle the effectof each componentof the diet,since
food items are interrelated (23).In particular,subjects
who eat more processed meat also consume less vegeta-
bles and fruit (24).However,we adjusted our estimates
for vegetable and fruit consumption,limiting such bias.
Moreover,the consistency ofthe associationsacross
strata ofcovariates excludes a major role ofmodifying
effects or residual confounding.Another strength of our
study is the large sample size.
Our findings supportthe hypothesis thatprocessed
meat increases the risk of proximalcolon cancer.Given
the modest excess risk estimates and the low frequency
of consumption,processed meatdoes notrepresenta
major public health concern in this Italian population.
Funding
This work was conducted within grants by the Italian Founda-
tion for Cancer Research (FIRC),and the Italian Ministry of
Health,GeneralDirectorate ofEuropean and International
Relations,and received unconditionalsupportby ASSICA.
The sponsors had no role in the study design,data collection
implementation,analysis,interpretation,manuscript prepara-
tion, or the decision to publish.
References
1. Bouvard V, Loomis D, Guyton KZ, Grosse Y, Ghissassi FE,
et al.:Carcinogenicity ofconsumption ofred and proc-
essed meat. Lancet Oncol 16, 1599–1600, 2015.
2. Chan DS, Lau R, Aune D, Vieira R, Greenwood DC, et al.:
Red and processed meat and colorectalcancer incidence:
meta-analysis of prospective studies. PLoS ONE 6, e20456,
2011.
3. Norat T, Bingham S,Ferrari P,Slimani N,Jenab M, et al.:
Meat,fish,and colorectalcancer risk:the European Pro-
spective Investigation into cancerand nutrition.J Natl
Cancer Inst 97, 906–916, 2005.
4. Battaglia Richi E,Baumer B, Conrad B, Darioli R,Schmid
A, Keller U:Health risks associated with meat consump-
tion: a review of epidemiological studies. Int J Vitam Nutr
Res 85, 70–78, 2015.
6 V. ROSATO ET AL.
Paraphrase This Document
Need a fresh take? Get an instant paraphrase of this document with our AI Paraphraser
5. Norat T,Scoccianti C,Boutron-Ruault MC,Anderson A,
Berrino F, et al.: European code against cancer 4th edition:
diet and cancer.Cancer Epidemiol39 (Suppl 1),S56–S66,
2015.
6. INRAN-SSICA-IBSI-ISIT:SalumiItaliani:NuoviValori,
Nuovo Valore. Aggiornamento dei dati nutrizionali e ruolo
dei salumi italiani nell’alimentazione moderna, 2011.
7. Chatenoud L, Tavani A, La Vecchia C, Jacobs DR Jr, Negri
E, et al.:Whole grain food intake and cancer risk.Int J
Cancer 77, 24–28, 1998.
8. FranceschiS,Favero A,La Vecchia C,NegriE, ContiE,
et al.:Food groups and risk of colorectalcancer in Italy.
Int J Cancer 72, 56–61, 1997.
9. Rosato V, Guercio V, Bosetti C, Negri E, Serraino D, et al.:
Mediterranean dietand colorectalcancer risk:a pooled
analysis of three Italian case-controlstudies.Br J Cancer
115, 862–865, 2016.
10. D’Avanzo B,La Vecchia C,Katsouyanni K,Negri E,Tri-
chopoulos D:An assessment,and reproducibility of food
frequency data provided by hospital controls. Eur J Cancer
Prev 6, 288–293, 1997.
11. FranceschiS, NegriE, SalviniS, DecarliA, FerraroniM,
et al.:Reproducibility ofan Italian food frequency ques-
tionnaire for cancer studies: results for specific food items.
Eur J Cancer 29A, 2298–2305, 1993.
12. Franceschi S,Barbone F,Negri E,Decarli A,Ferraroni M,
et al.:Reproducibility ofan Italian food frequency ques-
tionnaire for cancer studies.Results for specific nutrients.
Ann Epidemiol 5, 69–75, 1995.
13. Decarli A,Franceschi S,Ferraroni M,Gnagnarella P,Par-
pinel MT,et al.:Validation of a food-frequency question-
naire to assess dietary intakes in cancer studies in Italy.
Results for specific nutrients.Ann Epidemiol6, 110–118,
1996.
14. SalviniS:Banca datidi Composizione DegliAlimentiper
StudiEpidemiologiciin Italia.Italia:Istituito Europeo di
Oncologia, 1998.
15. Gnagnarella P, Parpinel M, Salvini S, Franceschi S, Palli D,
Boyle P: The Update of the Italian Food Composition Data-
base.J Food Comp Analysis.Milano, Italia: Istituto
Europeo di Oncologia, Vol. 17, 509–552, 2004.
16. Breslow NE,Day NE: StatisticalMethodsin Cancer
Research.Vol. I. The Analysisof Case-ControlStudies.
IARC Sci Publ No. 32. Lyon, France: IARC, 1980.
17. Larsson SC,Wolk A:Meat consumption and risk of colo-
rectalcancer:a meta-analysis of prospective studies.Int J
Cancer 119, 2657–2664, 2006.
18. PelucchiC, BosettiC, RossiM, NegriE, La Vecchia C:
Selected aspectsof Mediterranean dietand cancer risk.
Nutr Cancer 61, 756–766, 2009.
19. Elmadfa I,Meyer A,Nowak V,Hasenegger V,Putz P,
et al.:European nutrition and health report 2009.Forum
Nutr 62, 1–405, 2009.
20. Linseisen J,Kesse E,SlimaniN, Bueno-De-Mesquita HB,
Ocke MC,et al.:Meat consumption in the European Pro-
spective Investigation into Cancer and Nutrition (EPIC)
cohorts: results from 24-hour dietary recalls. Public Health
Nutr 5, 1243–1258, 2002.
21. YamauchiM, Lochhead P,Morikawa T,Huttenhower C,
Chan AT,et al.:Colorectal cancer:a tale of two sides or a
continuum? Gut 61, 794–797, 2012.
22. Le NT, Michels FA,Song M,Zhang X,Bernstein AM,
et al.:A prospective analysis of meat mutagens and colo-
rectal cancer in the nurses’ health study and health profes-
sionalsfollow-up study.Environ Health Perspect124,
1529–1536, 2016.
23. Willett WC,Sacks F,Trichopoulou A,Drescher G,Ferro-
Luzzi A, et al.:Mediterranean dietpyramid:a cultural
modelfor healthy eating.Am J Clin Nutr 61, 1402S–
1406S, 1995.
24. Orlich MJ, Jaceldo-SieglK, Sabate J,Fan J, Singh PN,
Fraser GE:Patterns of food consumption among vegeta-
riansand non-vegetarians.Br J Nutr 112,1644–1653,
2014.
NUTRITION AND CANCER 7
1 out of 8
Your All-in-One AI-Powered Toolkit for Academic Success.
+13062052269
info@desklib.com
Available 24*7 on WhatsApp / Email
![[object Object]](/_next/static/media/star-bottom.7253800d.svg)
Unlock your academic potential
© 2024 | Zucol Services PVT LTD | All rights reserved.