Nutrition Assessment : Anthropometry and Diet 2022
VerifiedAdded on 2022/09/12
|22
|5348
|25
AI Summary
Contribute Materials
Your contribution can guide someone’s learning journey. Share your
documents today.
Running head: NUTRITION ASSESSMENT: ANTHROPOMETRY AND DIET
NUTRITION ASSESSMENT: ANTHROPOMETRY AND DIET
Name of the Student:
Name of the University:
Author note:
NUTRITION ASSESSMENT: ANTHROPOMETRY AND DIET
Name of the Student:
Name of the University:
Author note:
Secure Best Marks with AI Grader
Need help grading? Try our AI Grader for instant feedback on your assignments.
1NUTRITION ASSESSMENT: ANTHROPOMETRY AND DIET
Introduction
Nutrition assessment is the collective term given to a range of detailed screening and
evaluation methods which are used for the collection of objective and subjective data concerning
an individual’s lifestyle, food selection behaviors, dietary consumption and overall health status.
A nutrition assessment is one of the most basic yet effective methods of determining an
individual’s present health status and future risk of acquiring disease. One of the most prevalent
health conditions which necessitate the implementation of nutrition assessment as a key
evaluation method is obesity (Armenta, Díaz, Valencia & Quizán, 2015).
Obesity is a condition of abnormally excessive accumulation of adipose tissue within the
body as a result of increased energy consumption in comparison to energy expenditure.
According to the World Health Organization (WHO, 2018), approximately 39% of the global
population was estimated to be overweight in the year 2016, of which 13% have been reported to
be obese. The prevalence of obesity in the United States alone is alarmingly high, as estimated
by the Centers of Disease Control and Prevention (CDC, 2018). to be 39.8% in the year 2016. If
not controlled, obesity paves the way for a host of metabolic abnormalities such as
hyperglycemia, hypertension and hypercholesterolemia which further results in diabetes,
cardiovascular diseases, renal disorders, cancers and thus reduced life expectancy. Obesity and
its associated metabolic complications not only yield high medical costs for healthcare
organizations but pose to be long term hindrance to the economy and productivity of a nation’s
population (Han & Lean, 2016).
While obesity can impact anybody irrespective of age, it may be more pronounced in the
youth and young adults studying in colleges and universities due to their high consumption of the
2NUTRITION ASSESSMENT: ANTHROPOMETRY AND DIET
added sugar, salt and saturated fat processed, convenient foods as a result of low levels of
awareness, academic and peer pressures, financial constraints and societal stereotypes (Han &
Lean, 2016). Additionally, as per global data on obesity prevalence, obesity may be more
pronounced in females (15 %) than in males (11%), thus indicating the presence of gender
differences (WHO, 2019). Lack of mitigation of obesity during adolescence and emerging
adulthood pave increase the risk of the chronic metabolic and life-threatening conditions which
may be pronounced as terminal illness during old age (Poobalan & Aucott, 2016). Thus the high
risk of obesity and poor nutritional and health status in young, university-going adults, especially
females, and their long term susceptibility to metabolic adversities during old age form the
rationale underlying this study of implementing nutritional assessment across a group of
university students.
The following paragraphs of the paper will aim to shed light on key components of a
nutrition assessment conducted across a group of university students. The preliminary sections of
the paper will extensively and elaborately discuss on the aims and hypothetical perspectives
underlying the study followed by a succinct discussion on the key anthropometric and dietary
assessments which were performed to obtain the required nutritional evaluation values. The
paper then succeeds to expound upon the acquired findings and recommend possible strategies
which can be implement by students for the purpose of achieving positive health outcomes.
Discussion
Aim, Objectives, Hypothesis
Aim: To explore the prevalence of gender differences and associated future risk of
chronic disease in anthropometric measurements, dietary consumption and nutrient intake data
across male and female university students.
3NUTRITION ASSESSMENT: ANTHROPOMETRY AND DIET
Proposed Hypothesis: Nutrition Assessment values such as anthropometric
measurements, dietary consumption and nutrient intake and their associated future chronic
disease risk demonstrate gender differences when examined across male and female university
students.
Thus, considering the above, the research was implemented based on the following
objectives:
1. To explore the prevalence of gender differences and associated future risk of chronic
disease in terms of anthropometric measurements across male and female university
students.
2. To explore the prevalence of gender differences and associated future risk of chronic
disease in terms of dietary consumption across male and female university students.
3. To explore the prevalence of gender differences and associated future risk of chronic
disease in terms of nutrient intake data across male and female university students.
Methods
The nutrition assessment was conducted across undergraduate and post graduate
university students (N = 163, from which males: n0 = 103, females: n1 = 60), studying in George
Mason University, Fairfax, Virginia across the Nutrition Department. Students were requested
for voluntary participation and interest candidates were informed regarding the objectives,
purpose and measurement particularities underlying the study. Considering the need to obtain
specific anthropometric data, participants were asked to adhere to clothing which was light, short
sleeved and well fitted at the waist.
Secure Best Marks with AI Grader
Need help grading? Try our AI Grader for instant feedback on your assignments.
4NUTRITION ASSESSMENT: ANTHROPOMETRY AND DIET
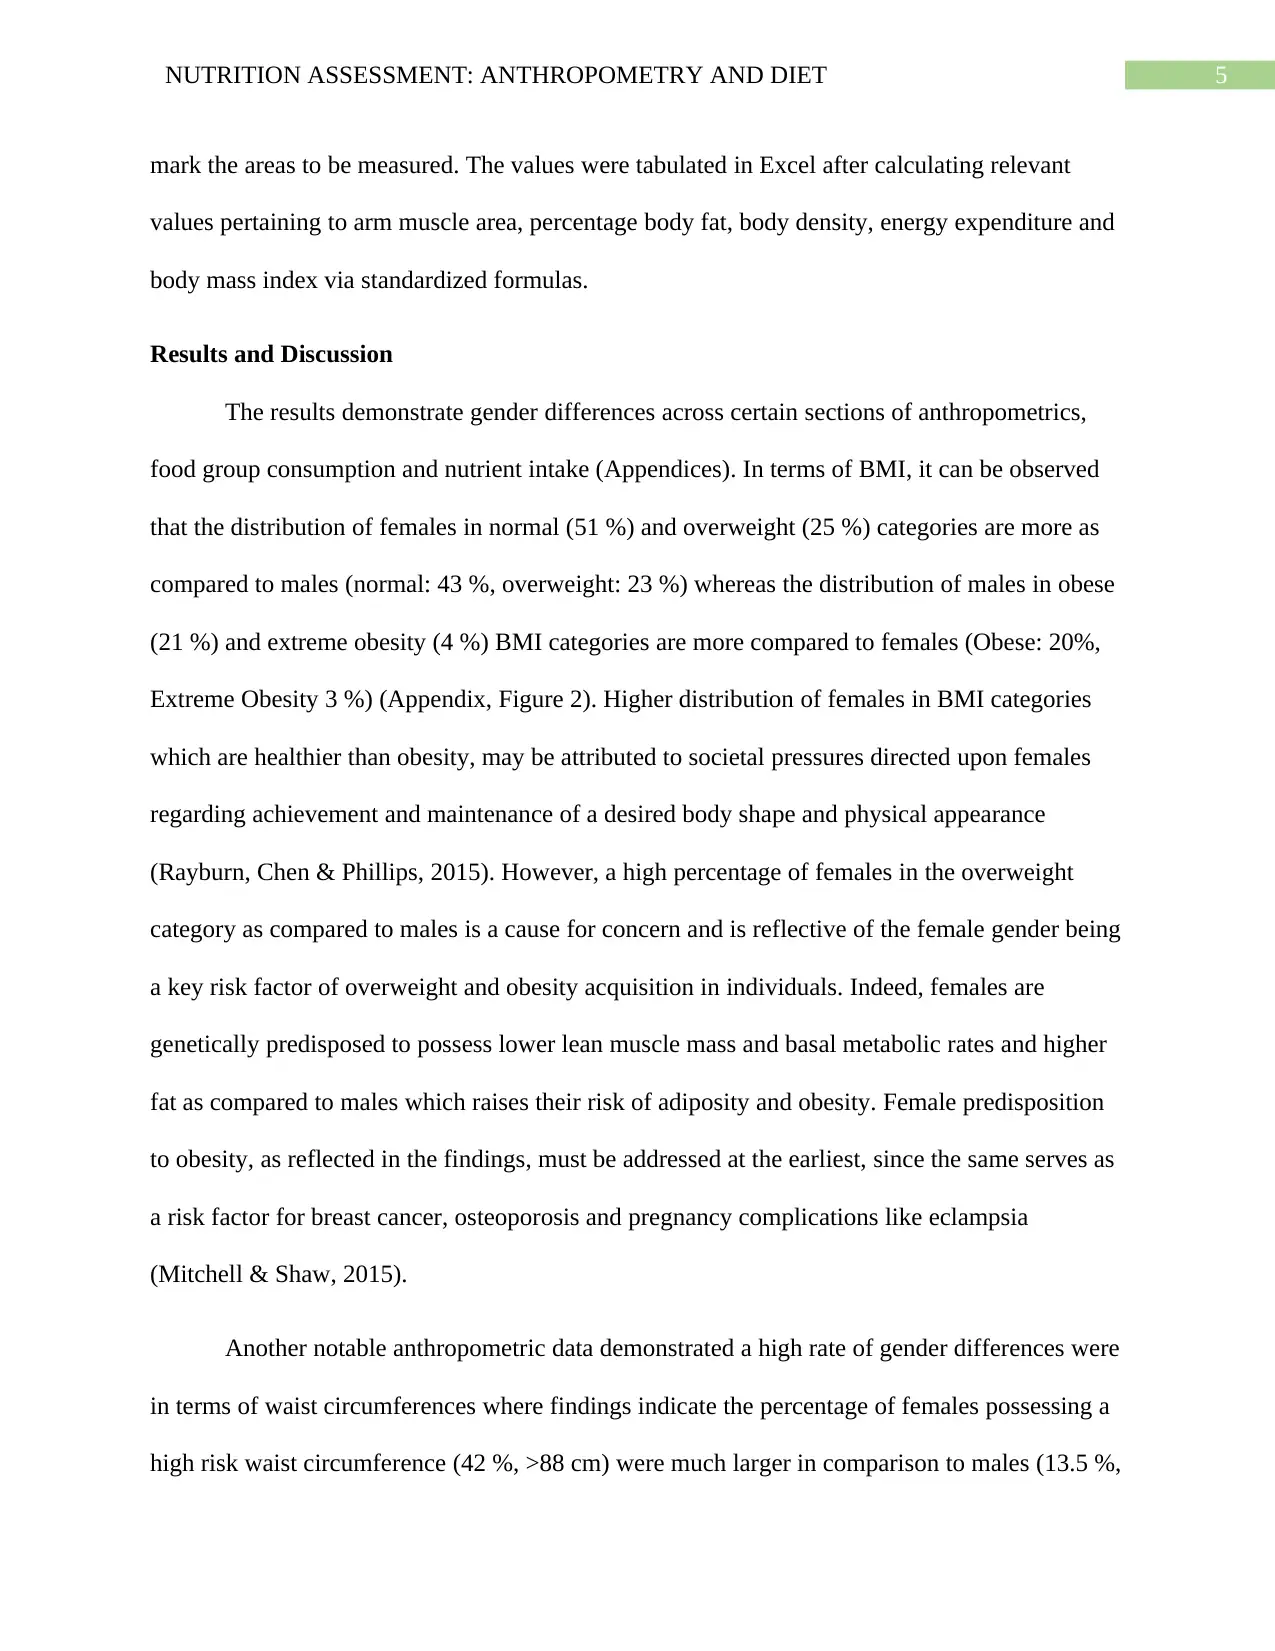
Demographic Information
Participants’ demographic information was assessed with the help of a face-to-face
interview, using a 15 item Demographic Questionnaire which assessed students based on their
employment status, race, gender, activity status and age. Informed consent was obtained from the
participants however and the interview was conducted in an isolated room with the researcher.
The data was tabulated in a spreadsheet software (Microsoft Excel).
24 hour Dietary Recall
Participants’ food consumption since the last 24 hours were collected with the help of a
24 hour dietary recall using the Multiple Pass Method developed by the United States
Department of Agriculture (USDA) (Cullen & Chen, 2017). The data was collected via a face-to-
face interview in an isolated room where the researcher asked the subject questions related to the
recall, such as the timing, recipes, preparation methods and amounts served, consumed and
prepared. To assist participants in understanding and recalling the type of foods consumed,
recipe forms were provided at the interview location. Additionally, to assist subjects in recalling
the specific amounts of foods they consumed, the USDA Food Models for Estimating Portions
was used (Fang, Liu, Zhu, Delp & Boushey, 2015). The nutrient values each diet were calculated
in a nutrition software (Nutritionist Pro) and the total results of participants were tabulated in
Excel.
Anthropometry
Participants’ anthropometrics were measured in terms of height, weight, waist
circumference, mid upper arm circumference (MUAC), hip circumference and skinfold
measurements like biceps, triceps, suprailiac and subscapular values. The measurements were
performed with the help of weighing scales, measuring tapes, skinfold calipers and pencils to
5NUTRITION ASSESSMENT: ANTHROPOMETRY AND DIET
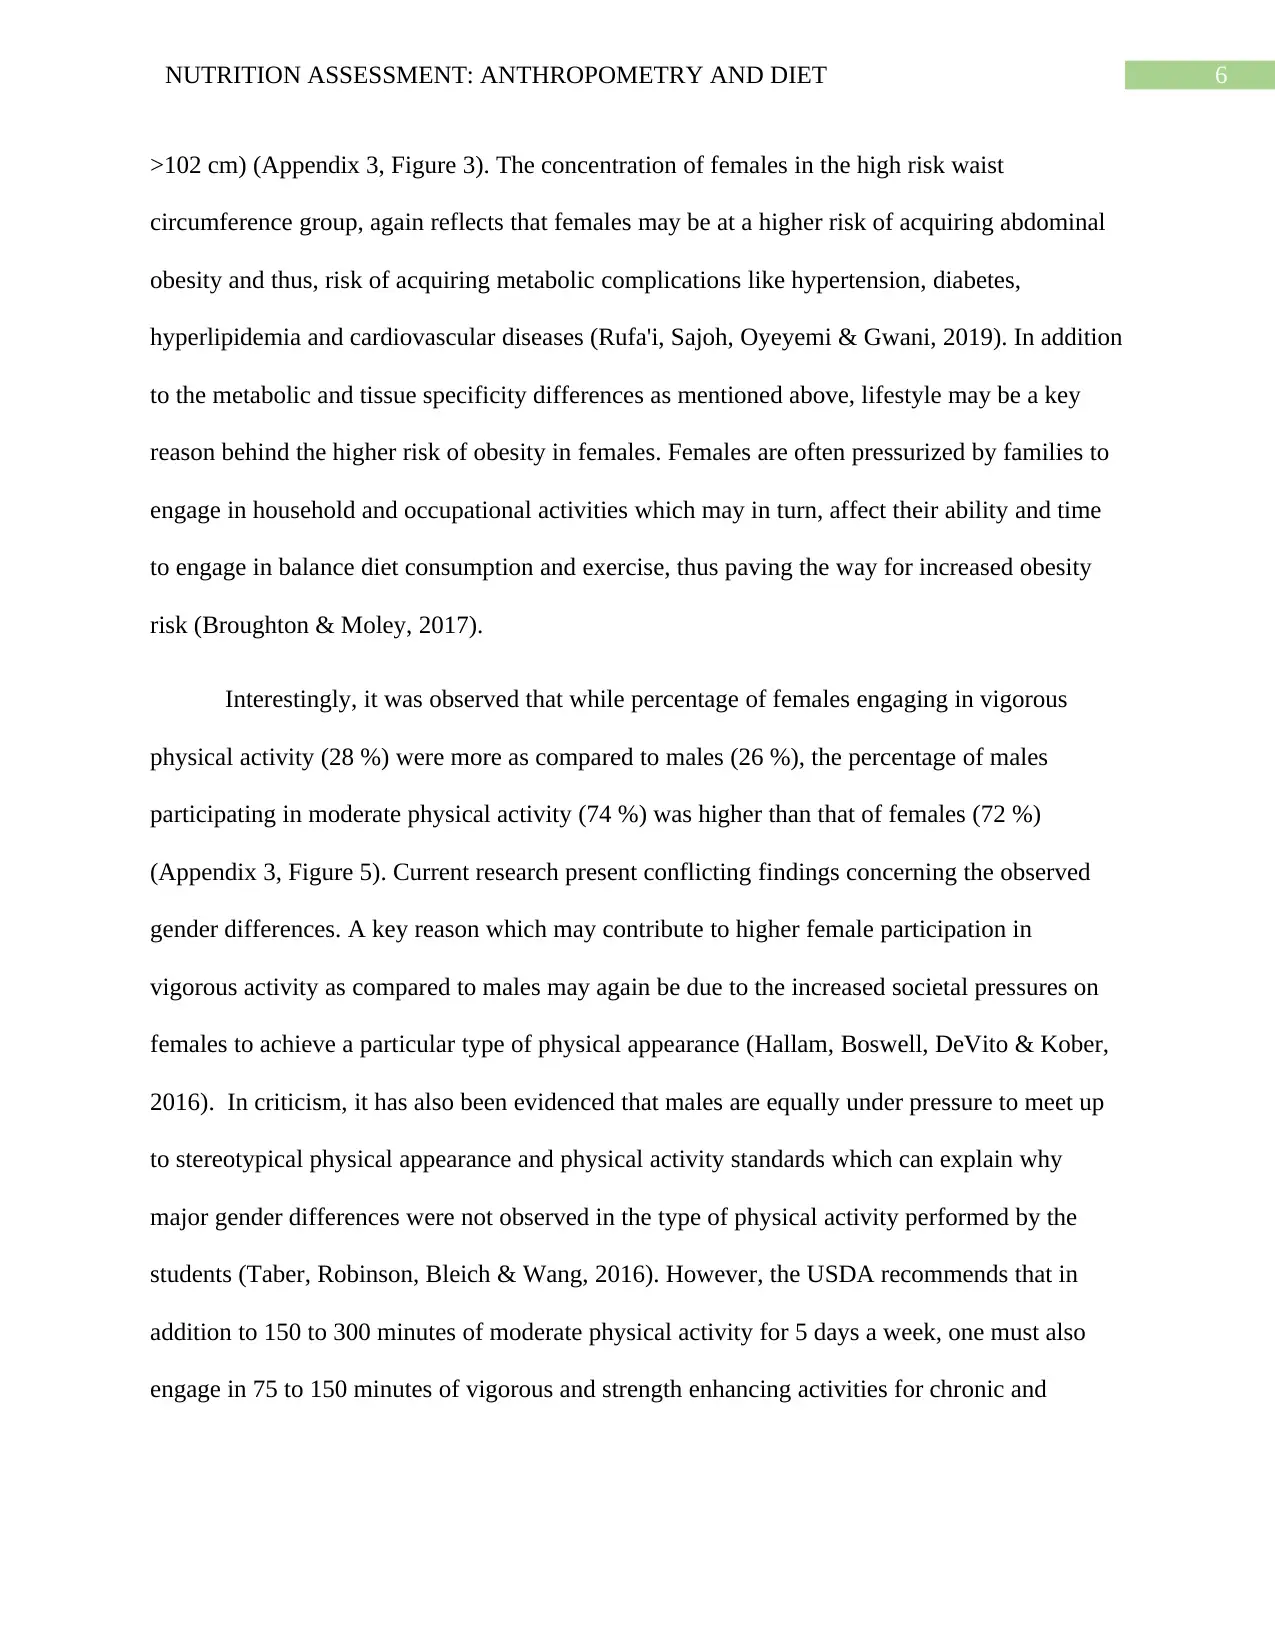
mark the areas to be measured. The values were tabulated in Excel after calculating relevant
values pertaining to arm muscle area, percentage body fat, body density, energy expenditure and
body mass index via standardized formulas.
Results and Discussion
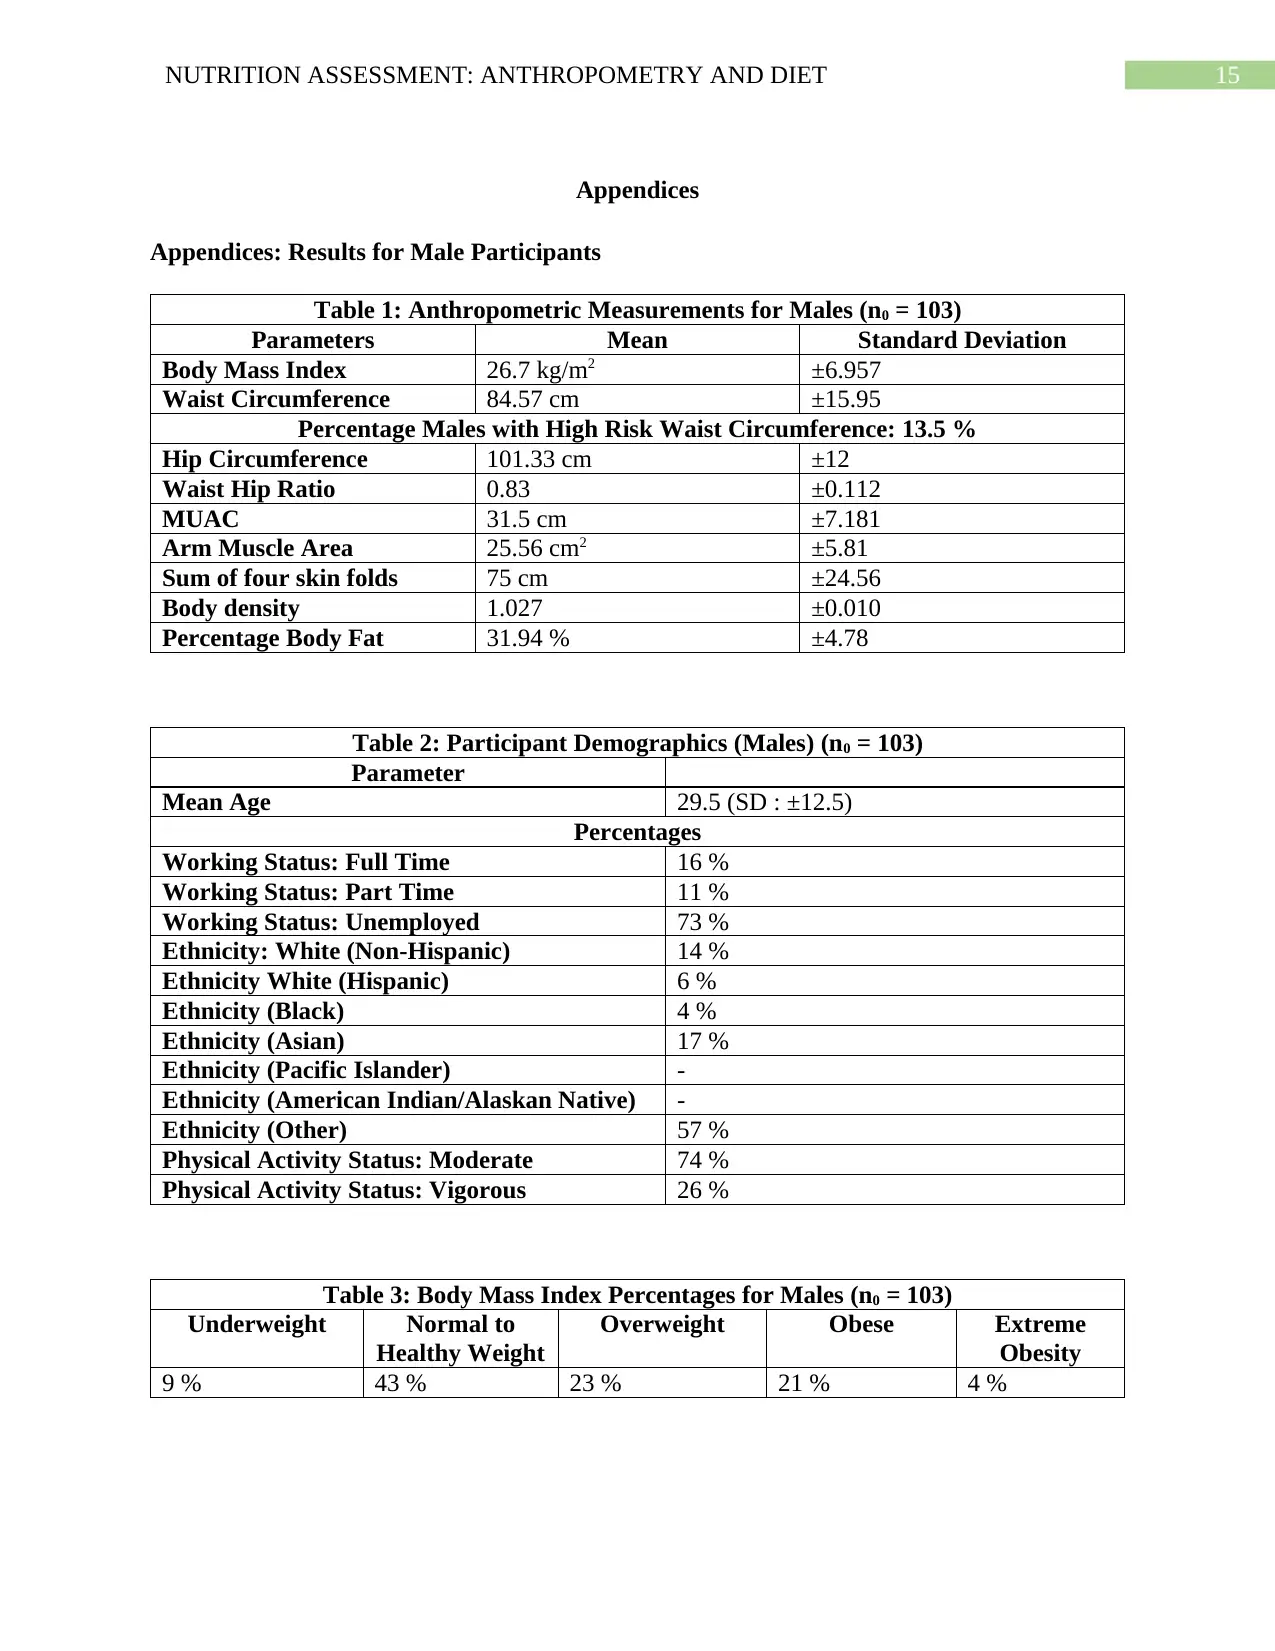
The results demonstrate gender differences across certain sections of anthropometrics,
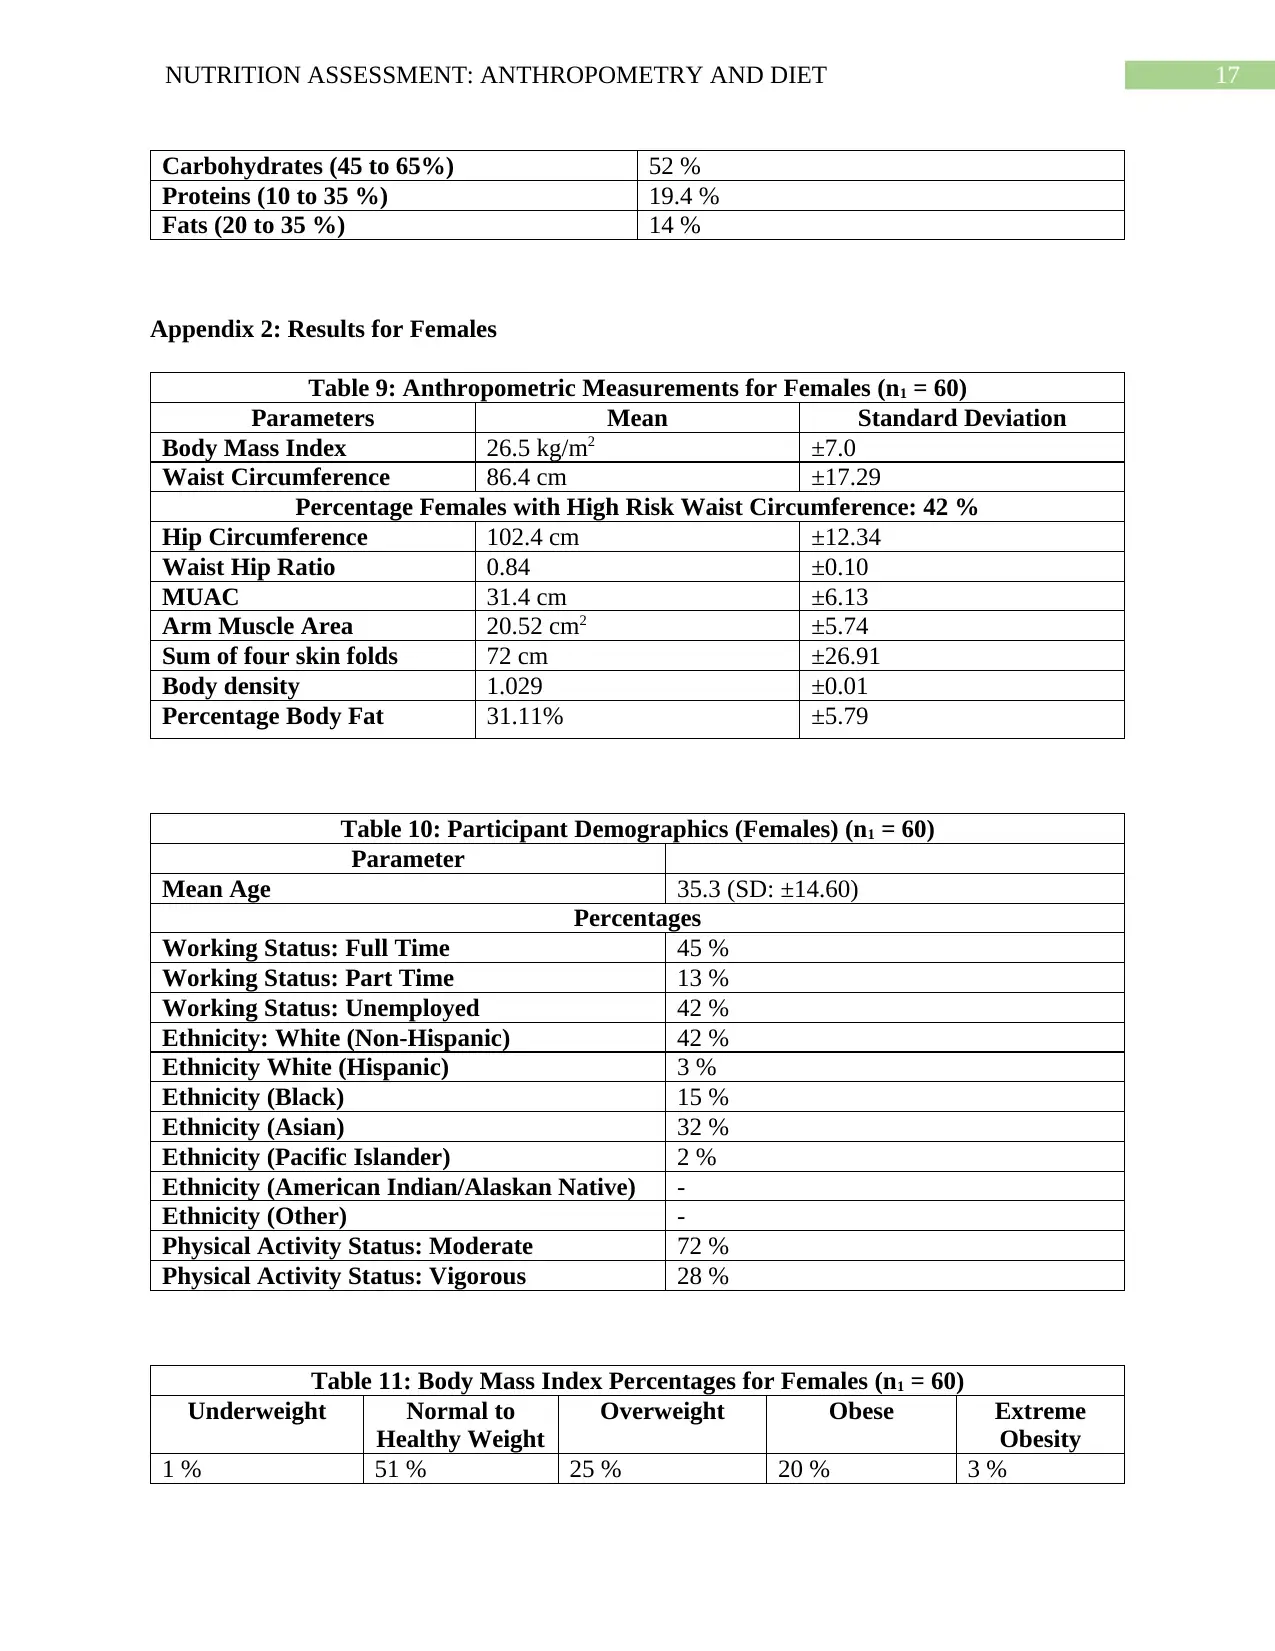
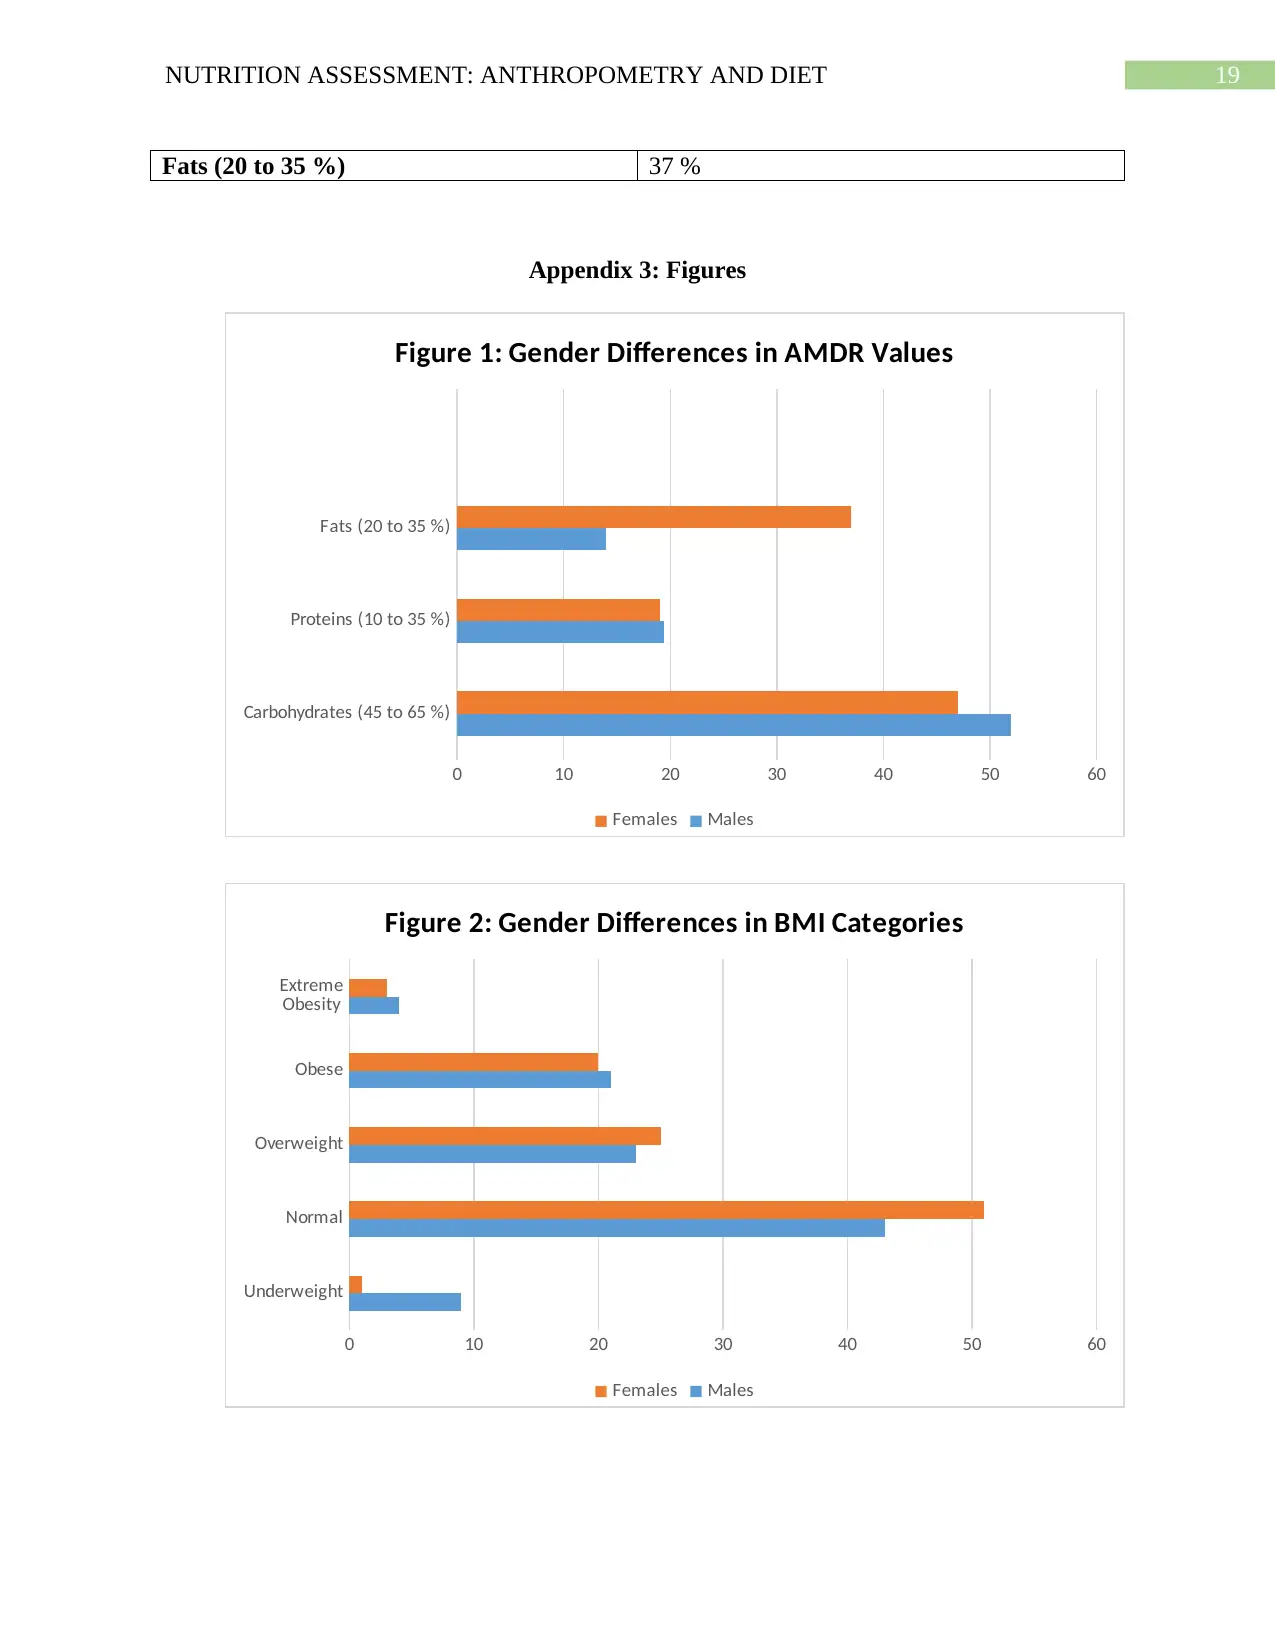
food group consumption and nutrient intake (Appendices). In terms of BMI, it can be observed
that the distribution of females in normal (51 %) and overweight (25 %) categories are more as
compared to males (normal: 43 %, overweight: 23 %) whereas the distribution of males in obese
(21 %) and extreme obesity (4 %) BMI categories are more compared to females (Obese: 20%,
Extreme Obesity 3 %) (Appendix, Figure 2). Higher distribution of females in BMI categories
which are healthier than obesity, may be attributed to societal pressures directed upon females
regarding achievement and maintenance of a desired body shape and physical appearance
(Rayburn, Chen & Phillips, 2015). However, a high percentage of females in the overweight
category as compared to males is a cause for concern and is reflective of the female gender being
a key risk factor of overweight and obesity acquisition in individuals. Indeed, females are
genetically predisposed to possess lower lean muscle mass and basal metabolic rates and higher
fat as compared to males which raises their risk of adiposity and obesity. Female predisposition
to obesity, as reflected in the findings, must be addressed at the earliest, since the same serves as
a risk factor for breast cancer, osteoporosis and pregnancy complications like eclampsia
(Mitchell & Shaw, 2015).
Another notable anthropometric data demonstrated a high rate of gender differences were
in terms of waist circumferences where findings indicate the percentage of females possessing a
high risk waist circumference (42 %, >88 cm) were much larger in comparison to males (13.5 %,
mark the areas to be measured. The values were tabulated in Excel after calculating relevant
values pertaining to arm muscle area, percentage body fat, body density, energy expenditure and
body mass index via standardized formulas.
Results and Discussion
The results demonstrate gender differences across certain sections of anthropometrics,
food group consumption and nutrient intake (Appendices). In terms of BMI, it can be observed
that the distribution of females in normal (51 %) and overweight (25 %) categories are more as
compared to males (normal: 43 %, overweight: 23 %) whereas the distribution of males in obese
(21 %) and extreme obesity (4 %) BMI categories are more compared to females (Obese: 20%,
Extreme Obesity 3 %) (Appendix, Figure 2). Higher distribution of females in BMI categories
which are healthier than obesity, may be attributed to societal pressures directed upon females
regarding achievement and maintenance of a desired body shape and physical appearance
(Rayburn, Chen & Phillips, 2015). However, a high percentage of females in the overweight
category as compared to males is a cause for concern and is reflective of the female gender being
a key risk factor of overweight and obesity acquisition in individuals. Indeed, females are
genetically predisposed to possess lower lean muscle mass and basal metabolic rates and higher
fat as compared to males which raises their risk of adiposity and obesity. Female predisposition
to obesity, as reflected in the findings, must be addressed at the earliest, since the same serves as
a risk factor for breast cancer, osteoporosis and pregnancy complications like eclampsia
(Mitchell & Shaw, 2015).
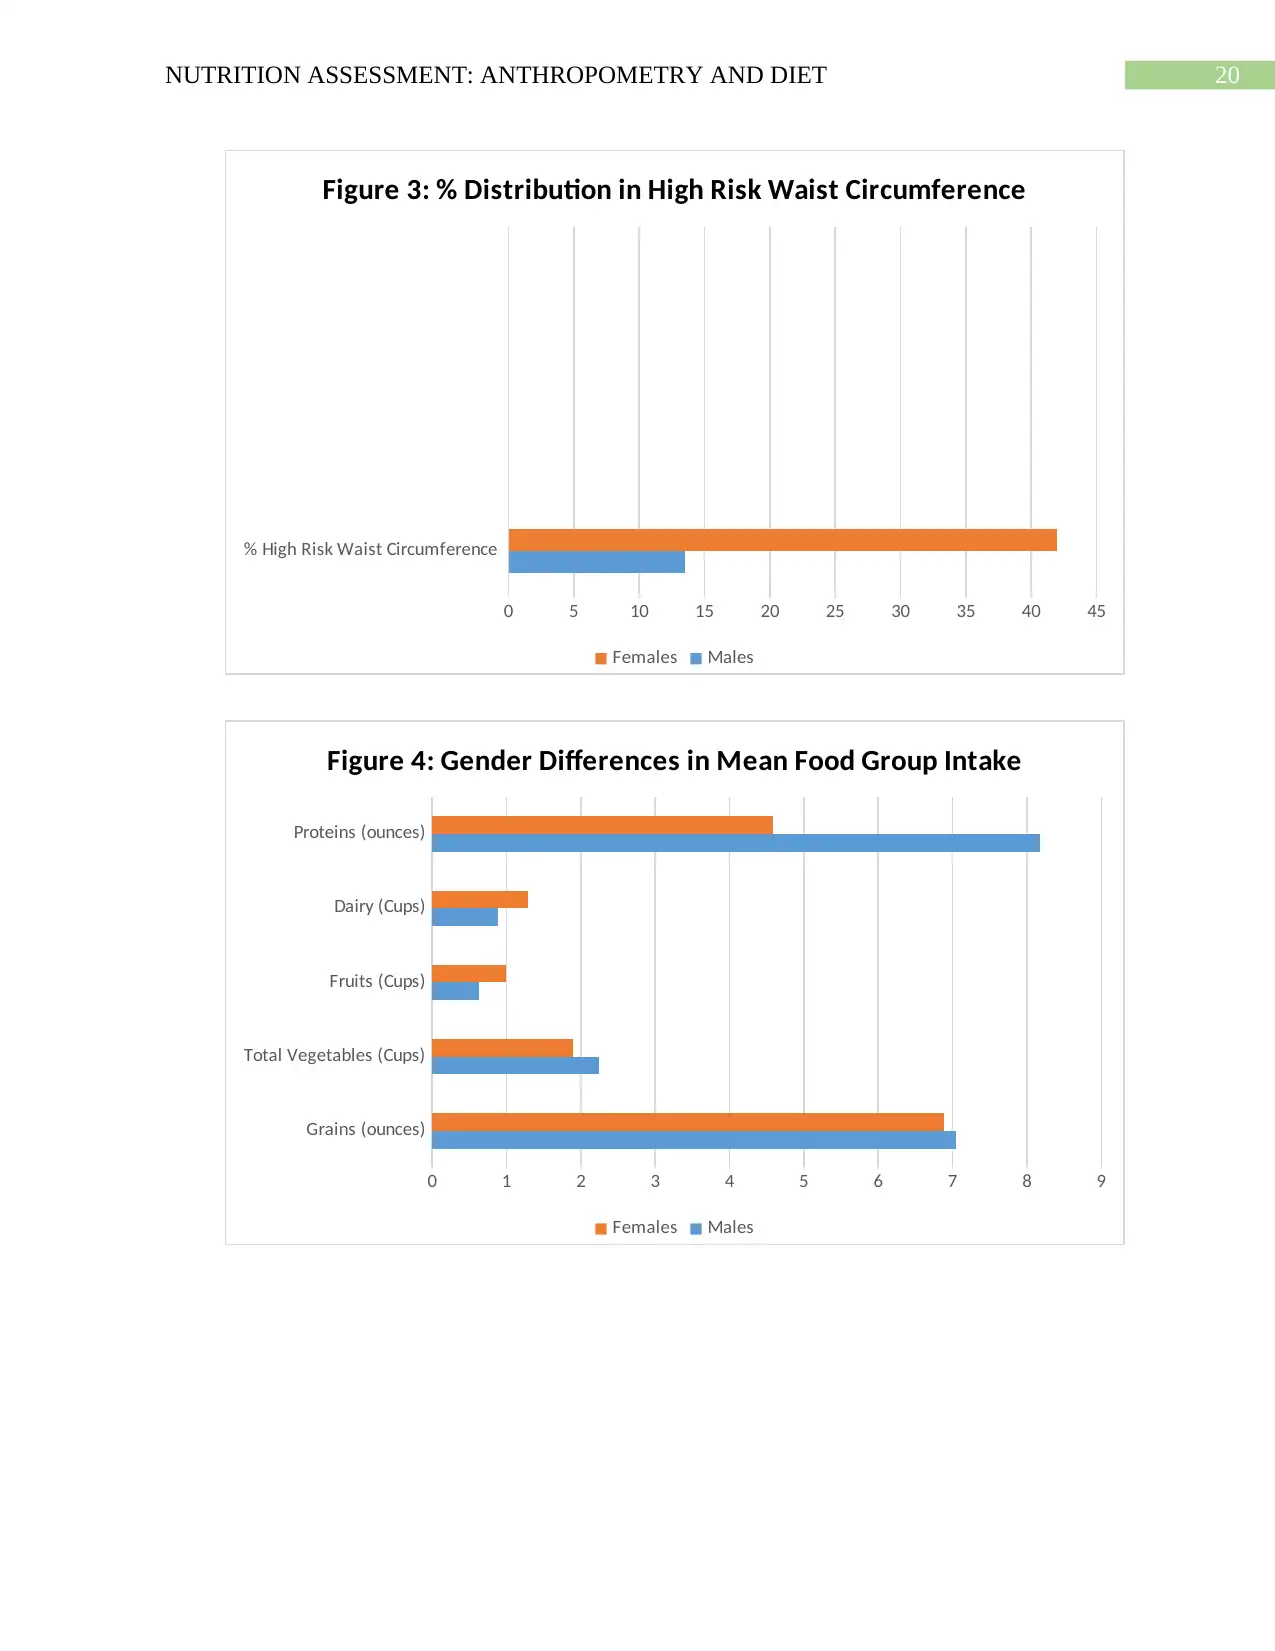
Another notable anthropometric data demonstrated a high rate of gender differences were
in terms of waist circumferences where findings indicate the percentage of females possessing a
high risk waist circumference (42 %, >88 cm) were much larger in comparison to males (13.5 %,
6NUTRITION ASSESSMENT: ANTHROPOMETRY AND DIET
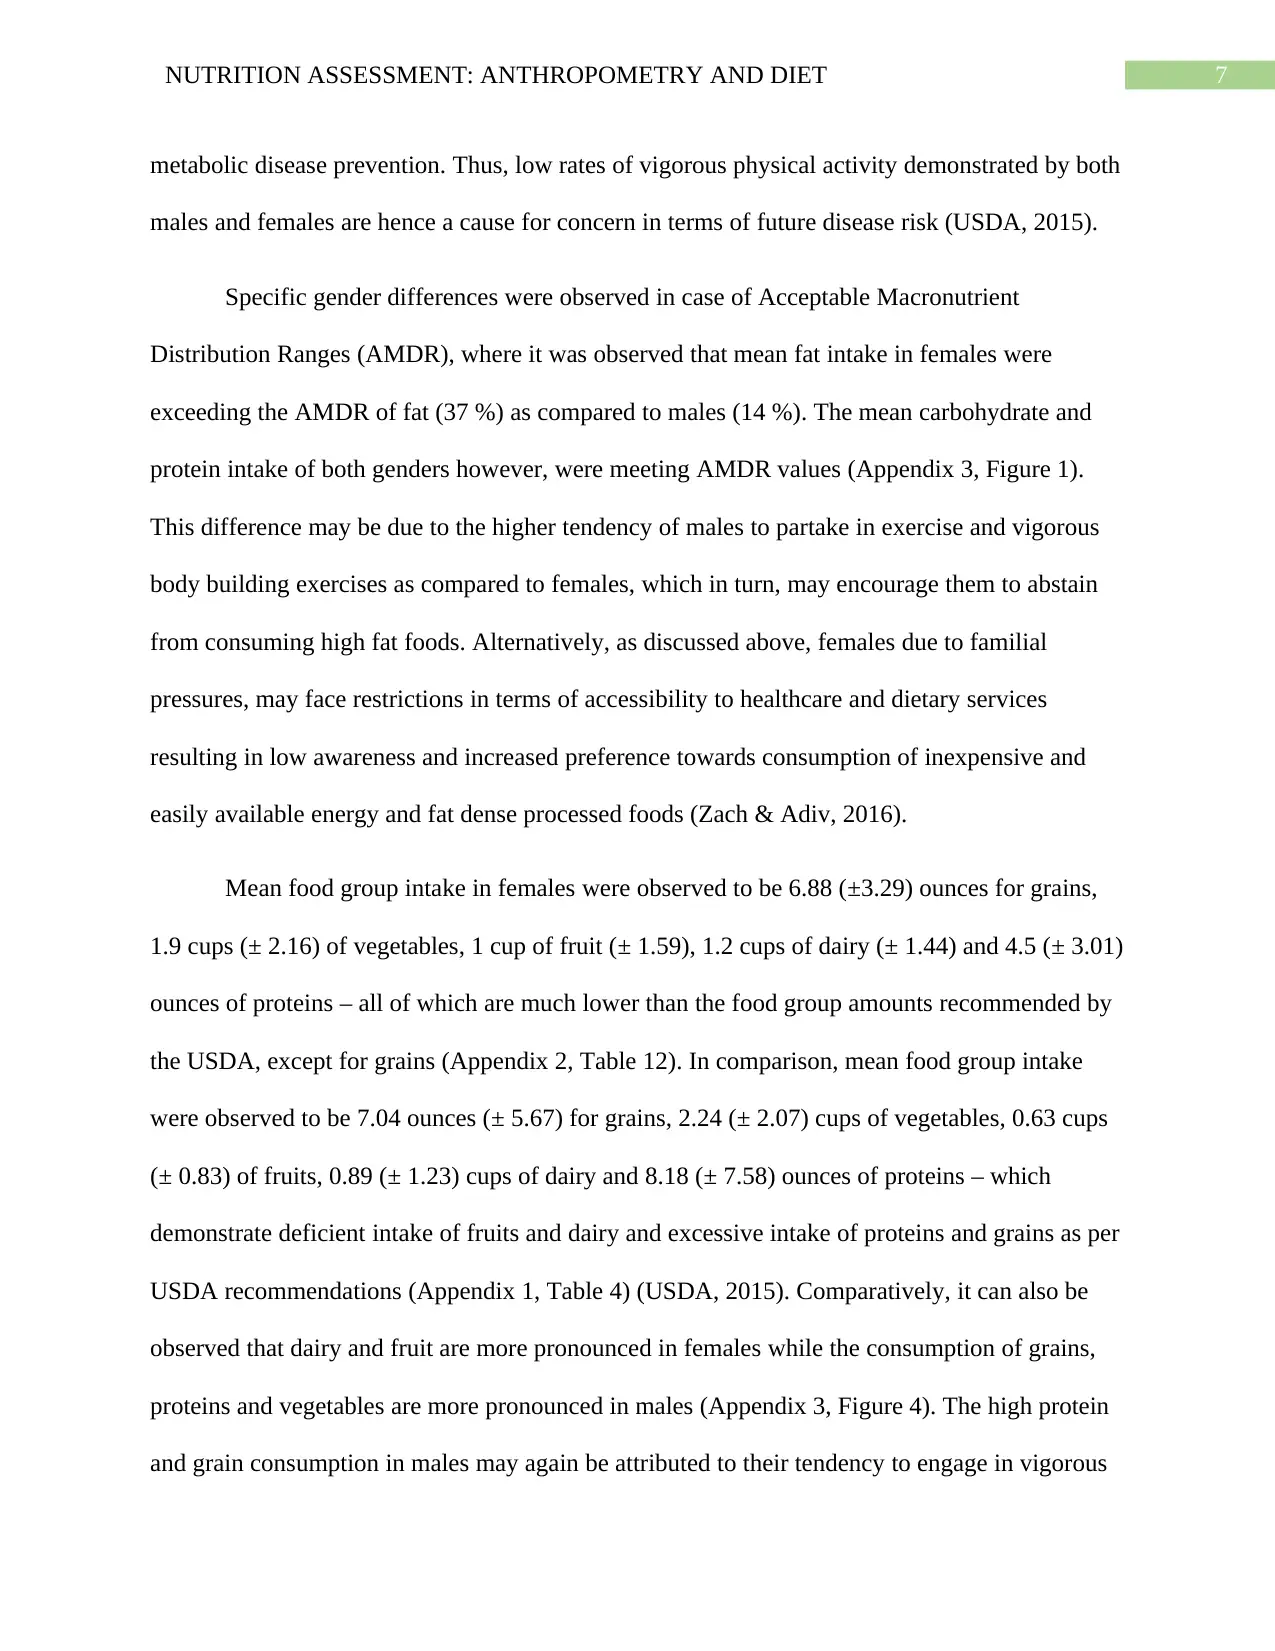
>102 cm) (Appendix 3, Figure 3). The concentration of females in the high risk waist
circumference group, again reflects that females may be at a higher risk of acquiring abdominal
obesity and thus, risk of acquiring metabolic complications like hypertension, diabetes,
hyperlipidemia and cardiovascular diseases (Rufa'i, Sajoh, Oyeyemi & Gwani, 2019). In addition
to the metabolic and tissue specificity differences as mentioned above, lifestyle may be a key
reason behind the higher risk of obesity in females. Females are often pressurized by families to
engage in household and occupational activities which may in turn, affect their ability and time
to engage in balance diet consumption and exercise, thus paving the way for increased obesity
risk (Broughton & Moley, 2017).
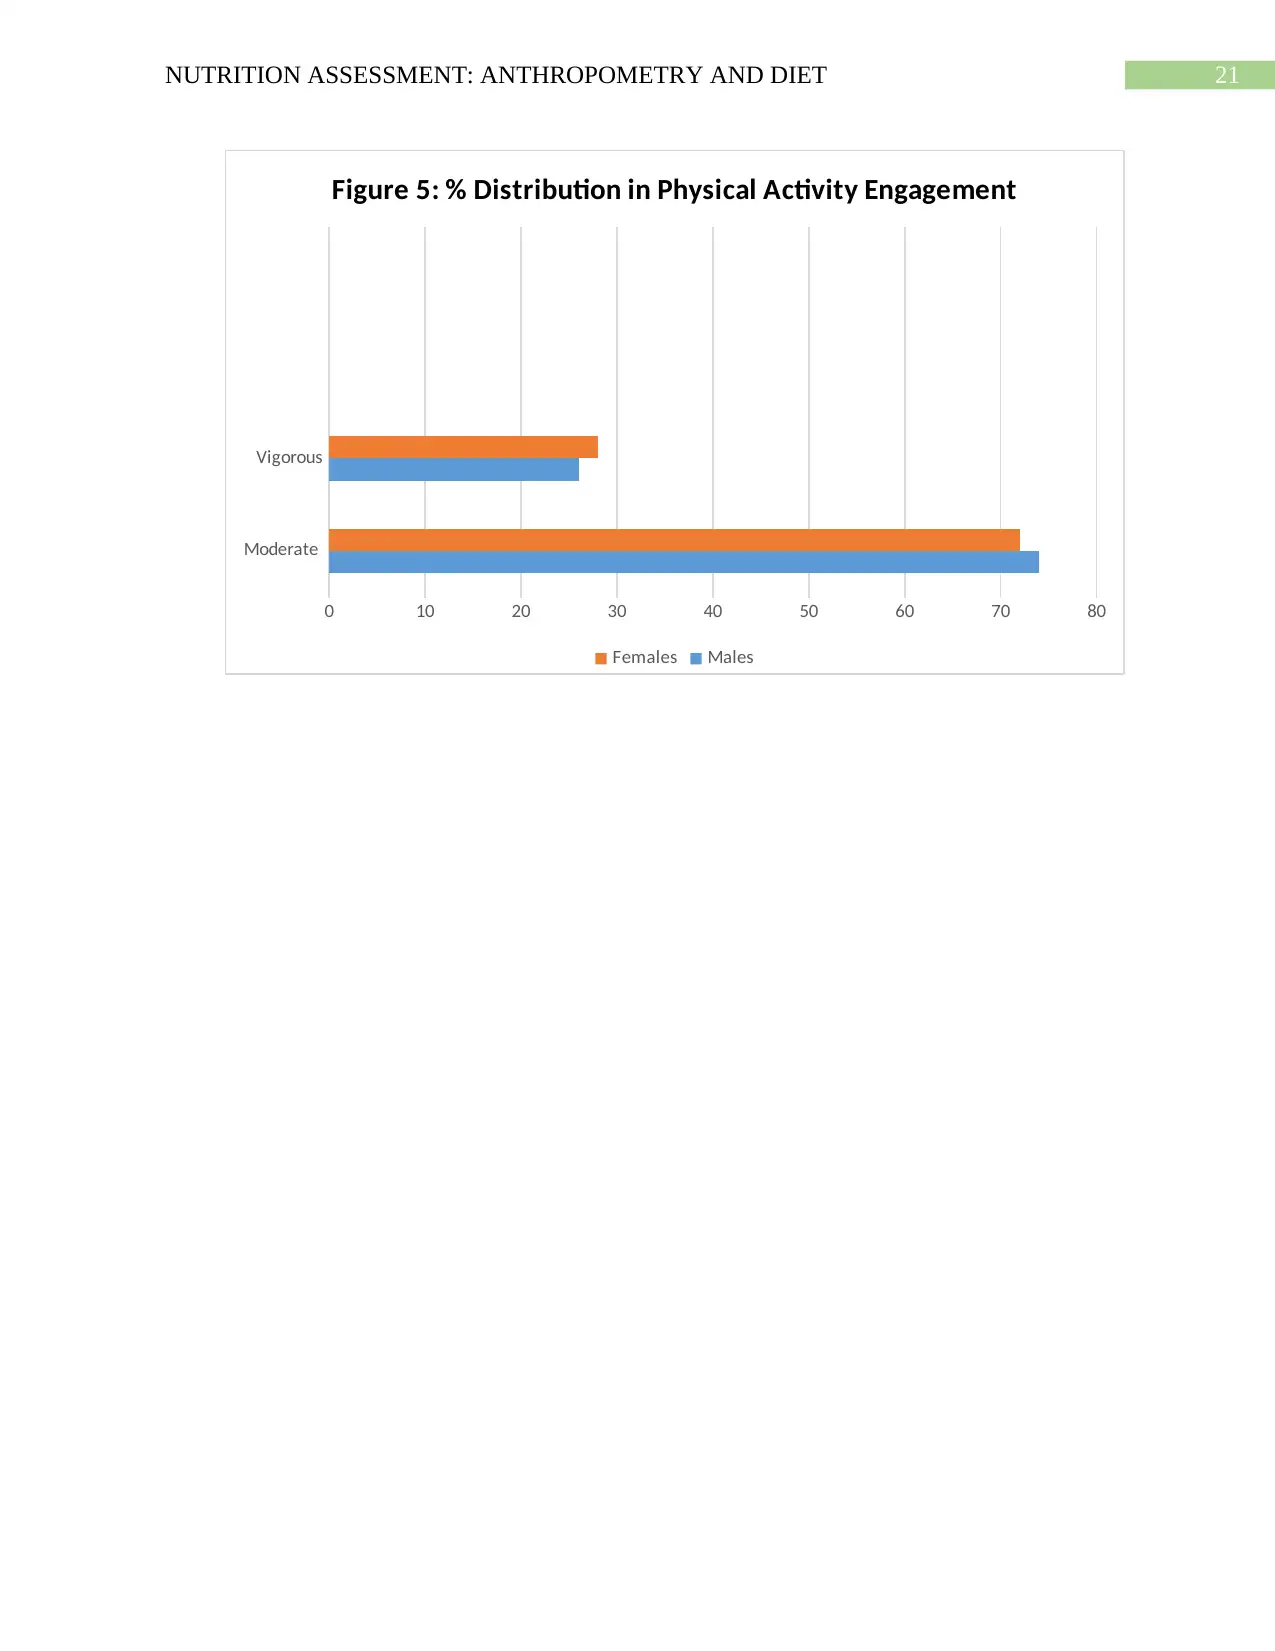
Interestingly, it was observed that while percentage of females engaging in vigorous
physical activity (28 %) were more as compared to males (26 %), the percentage of males
participating in moderate physical activity (74 %) was higher than that of females (72 %)
(Appendix 3, Figure 5). Current research present conflicting findings concerning the observed
gender differences. A key reason which may contribute to higher female participation in
vigorous activity as compared to males may again be due to the increased societal pressures on
females to achieve a particular type of physical appearance (Hallam, Boswell, DeVito & Kober,
2016). In criticism, it has also been evidenced that males are equally under pressure to meet up
to stereotypical physical appearance and physical activity standards which can explain why
major gender differences were not observed in the type of physical activity performed by the
students (Taber, Robinson, Bleich & Wang, 2016). However, the USDA recommends that in
addition to 150 to 300 minutes of moderate physical activity for 5 days a week, one must also
engage in 75 to 150 minutes of vigorous and strength enhancing activities for chronic and
>102 cm) (Appendix 3, Figure 3). The concentration of females in the high risk waist
circumference group, again reflects that females may be at a higher risk of acquiring abdominal
obesity and thus, risk of acquiring metabolic complications like hypertension, diabetes,
hyperlipidemia and cardiovascular diseases (Rufa'i, Sajoh, Oyeyemi & Gwani, 2019). In addition
to the metabolic and tissue specificity differences as mentioned above, lifestyle may be a key
reason behind the higher risk of obesity in females. Females are often pressurized by families to
engage in household and occupational activities which may in turn, affect their ability and time
to engage in balance diet consumption and exercise, thus paving the way for increased obesity
risk (Broughton & Moley, 2017).
Interestingly, it was observed that while percentage of females engaging in vigorous
physical activity (28 %) were more as compared to males (26 %), the percentage of males
participating in moderate physical activity (74 %) was higher than that of females (72 %)
(Appendix 3, Figure 5). Current research present conflicting findings concerning the observed
gender differences. A key reason which may contribute to higher female participation in
vigorous activity as compared to males may again be due to the increased societal pressures on
females to achieve a particular type of physical appearance (Hallam, Boswell, DeVito & Kober,
2016). In criticism, it has also been evidenced that males are equally under pressure to meet up
to stereotypical physical appearance and physical activity standards which can explain why
major gender differences were not observed in the type of physical activity performed by the
students (Taber, Robinson, Bleich & Wang, 2016). However, the USDA recommends that in
addition to 150 to 300 minutes of moderate physical activity for 5 days a week, one must also
engage in 75 to 150 minutes of vigorous and strength enhancing activities for chronic and
Paraphrase This Document
Need a fresh take? Get an instant paraphrase of this document with our AI Paraphraser
7NUTRITION ASSESSMENT: ANTHROPOMETRY AND DIET
metabolic disease prevention. Thus, low rates of vigorous physical activity demonstrated by both
males and females are hence a cause for concern in terms of future disease risk (USDA, 2015).
Specific gender differences were observed in case of Acceptable Macronutrient
Distribution Ranges (AMDR), where it was observed that mean fat intake in females were
exceeding the AMDR of fat (37 %) as compared to males (14 %). The mean carbohydrate and
protein intake of both genders however, were meeting AMDR values (Appendix 3, Figure 1).
This difference may be due to the higher tendency of males to partake in exercise and vigorous
body building exercises as compared to females, which in turn, may encourage them to abstain
from consuming high fat foods. Alternatively, as discussed above, females due to familial
pressures, may face restrictions in terms of accessibility to healthcare and dietary services
resulting in low awareness and increased preference towards consumption of inexpensive and
easily available energy and fat dense processed foods (Zach & Adiv, 2016).
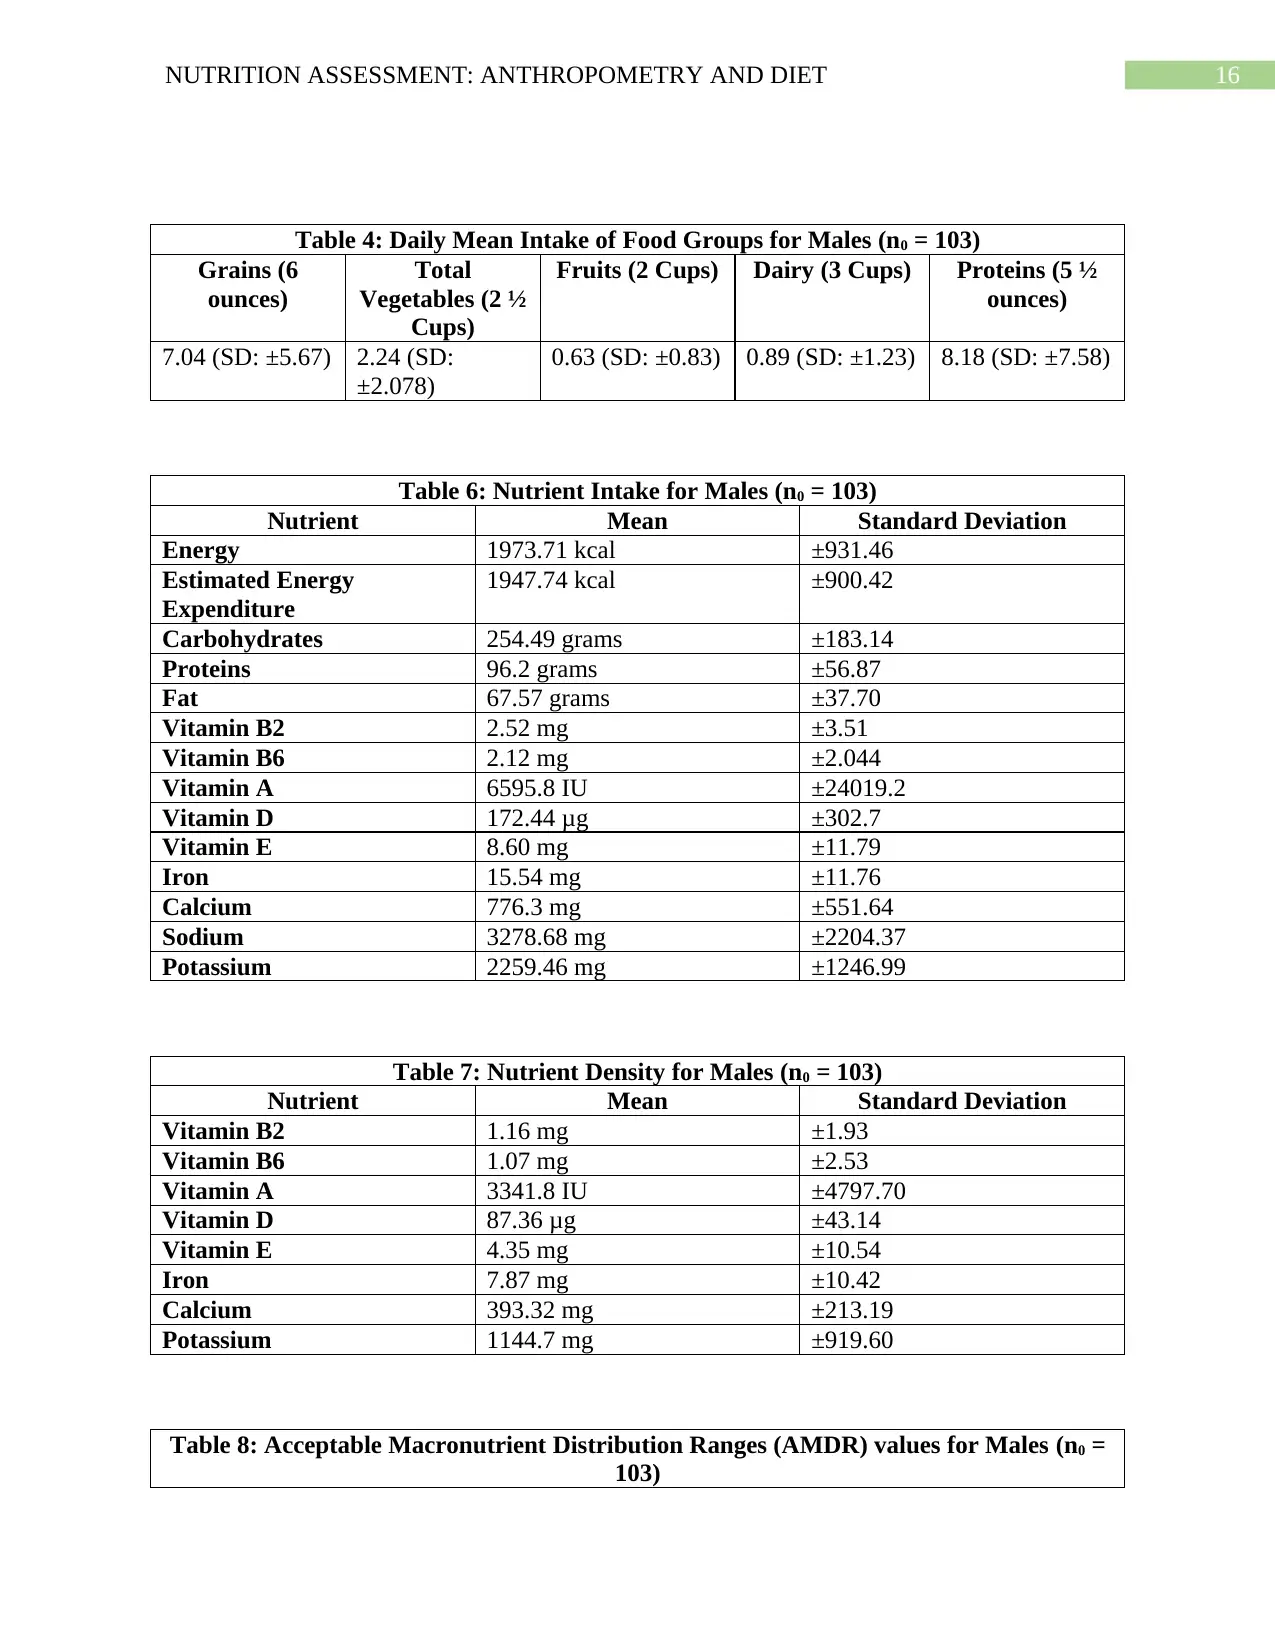
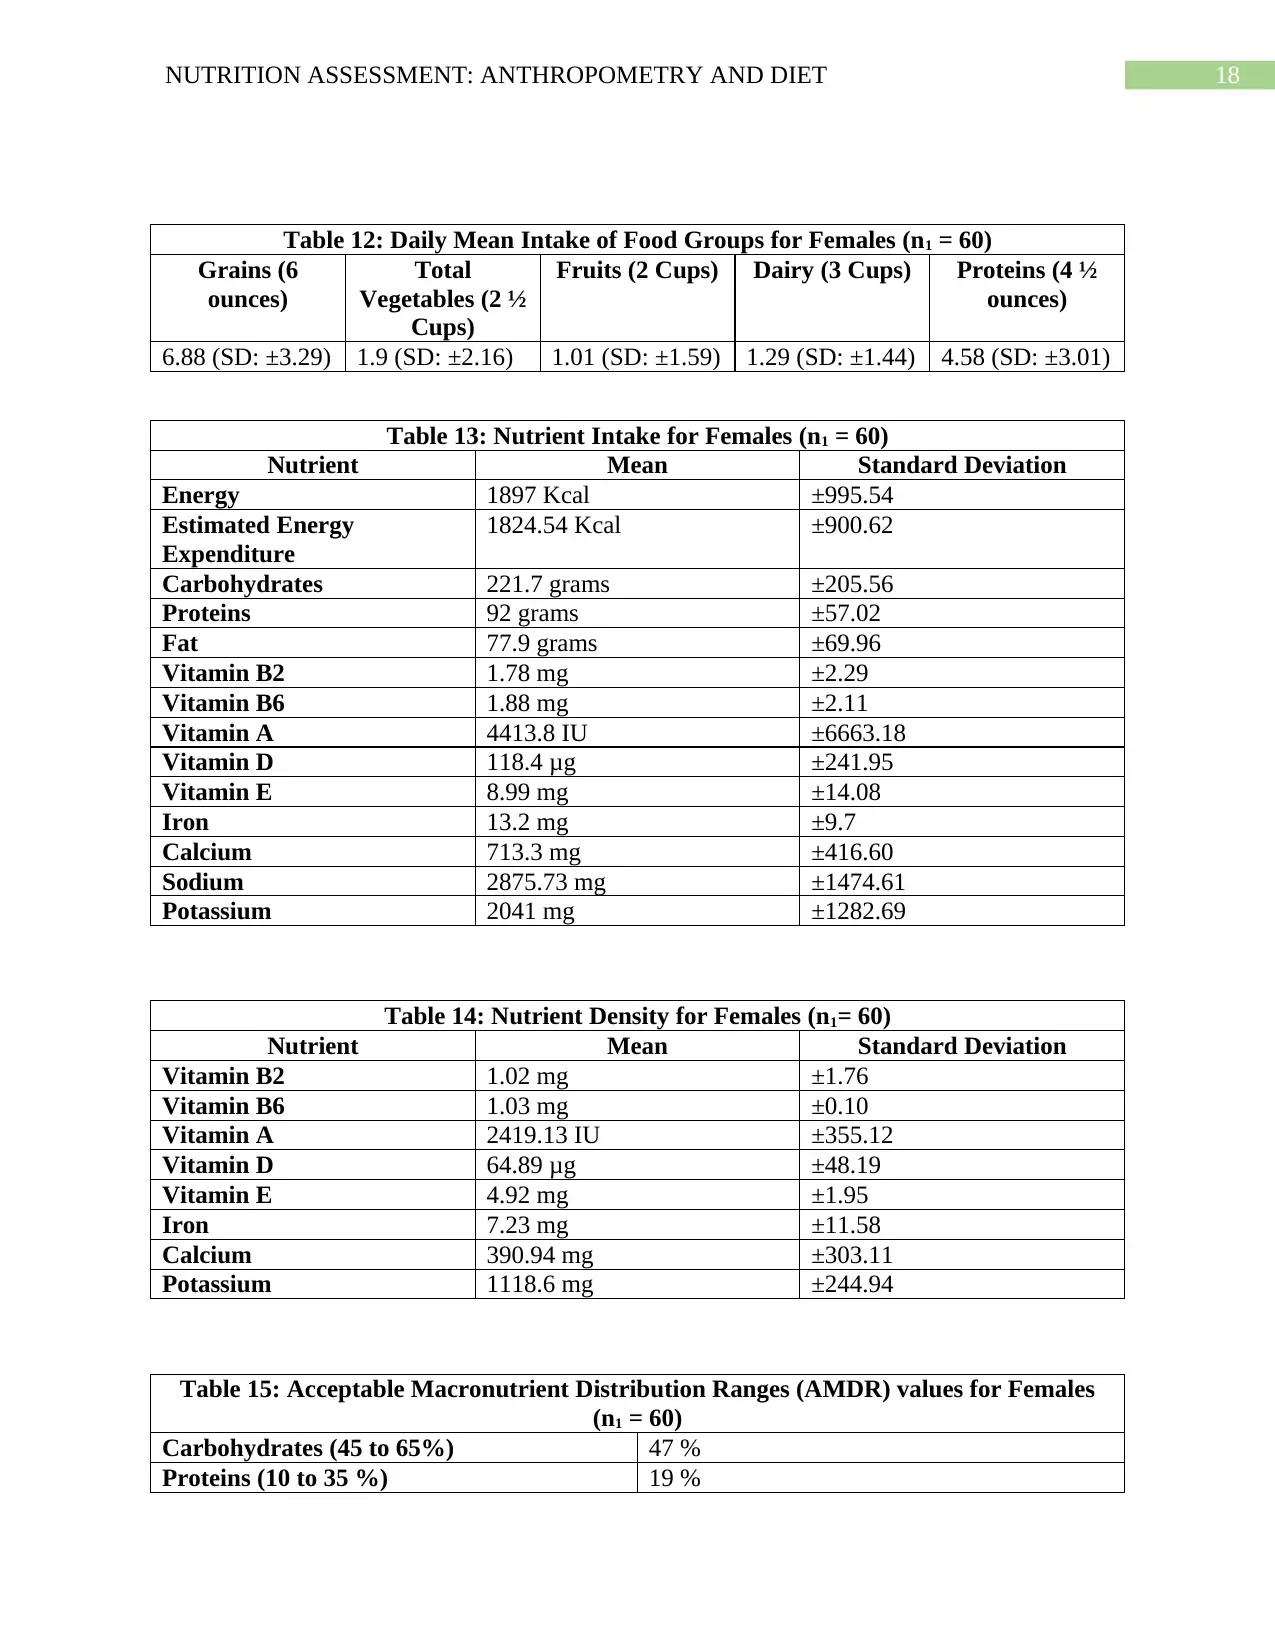
Mean food group intake in females were observed to be 6.88 (±3.29) ounces for grains,
1.9 cups (± 2.16) of vegetables, 1 cup of fruit (± 1.59), 1.2 cups of dairy (± 1.44) and 4.5 (± 3.01)
ounces of proteins – all of which are much lower than the food group amounts recommended by
the USDA, except for grains (Appendix 2, Table 12). In comparison, mean food group intake
were observed to be 7.04 ounces (± 5.67) for grains, 2.24 (± 2.07) cups of vegetables, 0.63 cups
(± 0.83) of fruits, 0.89 (± 1.23) cups of dairy and 8.18 (± 7.58) ounces of proteins – which
demonstrate deficient intake of fruits and dairy and excessive intake of proteins and grains as per
USDA recommendations (Appendix 1, Table 4) (USDA, 2015). Comparatively, it can also be
observed that dairy and fruit are more pronounced in females while the consumption of grains,
proteins and vegetables are more pronounced in males (Appendix 3, Figure 4). The high protein
and grain consumption in males may again be attributed to their tendency to engage in vigorous
metabolic disease prevention. Thus, low rates of vigorous physical activity demonstrated by both
males and females are hence a cause for concern in terms of future disease risk (USDA, 2015).
Specific gender differences were observed in case of Acceptable Macronutrient
Distribution Ranges (AMDR), where it was observed that mean fat intake in females were
exceeding the AMDR of fat (37 %) as compared to males (14 %). The mean carbohydrate and
protein intake of both genders however, were meeting AMDR values (Appendix 3, Figure 1).
This difference may be due to the higher tendency of males to partake in exercise and vigorous
body building exercises as compared to females, which in turn, may encourage them to abstain
from consuming high fat foods. Alternatively, as discussed above, females due to familial
pressures, may face restrictions in terms of accessibility to healthcare and dietary services
resulting in low awareness and increased preference towards consumption of inexpensive and
easily available energy and fat dense processed foods (Zach & Adiv, 2016).
Mean food group intake in females were observed to be 6.88 (±3.29) ounces for grains,
1.9 cups (± 2.16) of vegetables, 1 cup of fruit (± 1.59), 1.2 cups of dairy (± 1.44) and 4.5 (± 3.01)
ounces of proteins – all of which are much lower than the food group amounts recommended by
the USDA, except for grains (Appendix 2, Table 12). In comparison, mean food group intake
were observed to be 7.04 ounces (± 5.67) for grains, 2.24 (± 2.07) cups of vegetables, 0.63 cups
(± 0.83) of fruits, 0.89 (± 1.23) cups of dairy and 8.18 (± 7.58) ounces of proteins – which
demonstrate deficient intake of fruits and dairy and excessive intake of proteins and grains as per
USDA recommendations (Appendix 1, Table 4) (USDA, 2015). Comparatively, it can also be
observed that dairy and fruit are more pronounced in females while the consumption of grains,
proteins and vegetables are more pronounced in males (Appendix 3, Figure 4). The high protein
and grain consumption in males may again be attributed to their tendency to engage in vigorous
8NUTRITION ASSESSMENT: ANTHROPOMETRY AND DIET
training and nutrient and protein dense food consumption in order to live up to societal body
building standards. Stereotypes associated with physical appearance may also be a reason
contributing to the deficient mean food group intake in case of females (Eagleman, 2015).
Additionally, such food intake deficiencies across both genders may be due to the fact that the
sample comprised of university students who in turn, have been evidenced to engage in
inadequate food consumption as a result of lack of awareness, financial and time constraints
(Baig et al., 2015).
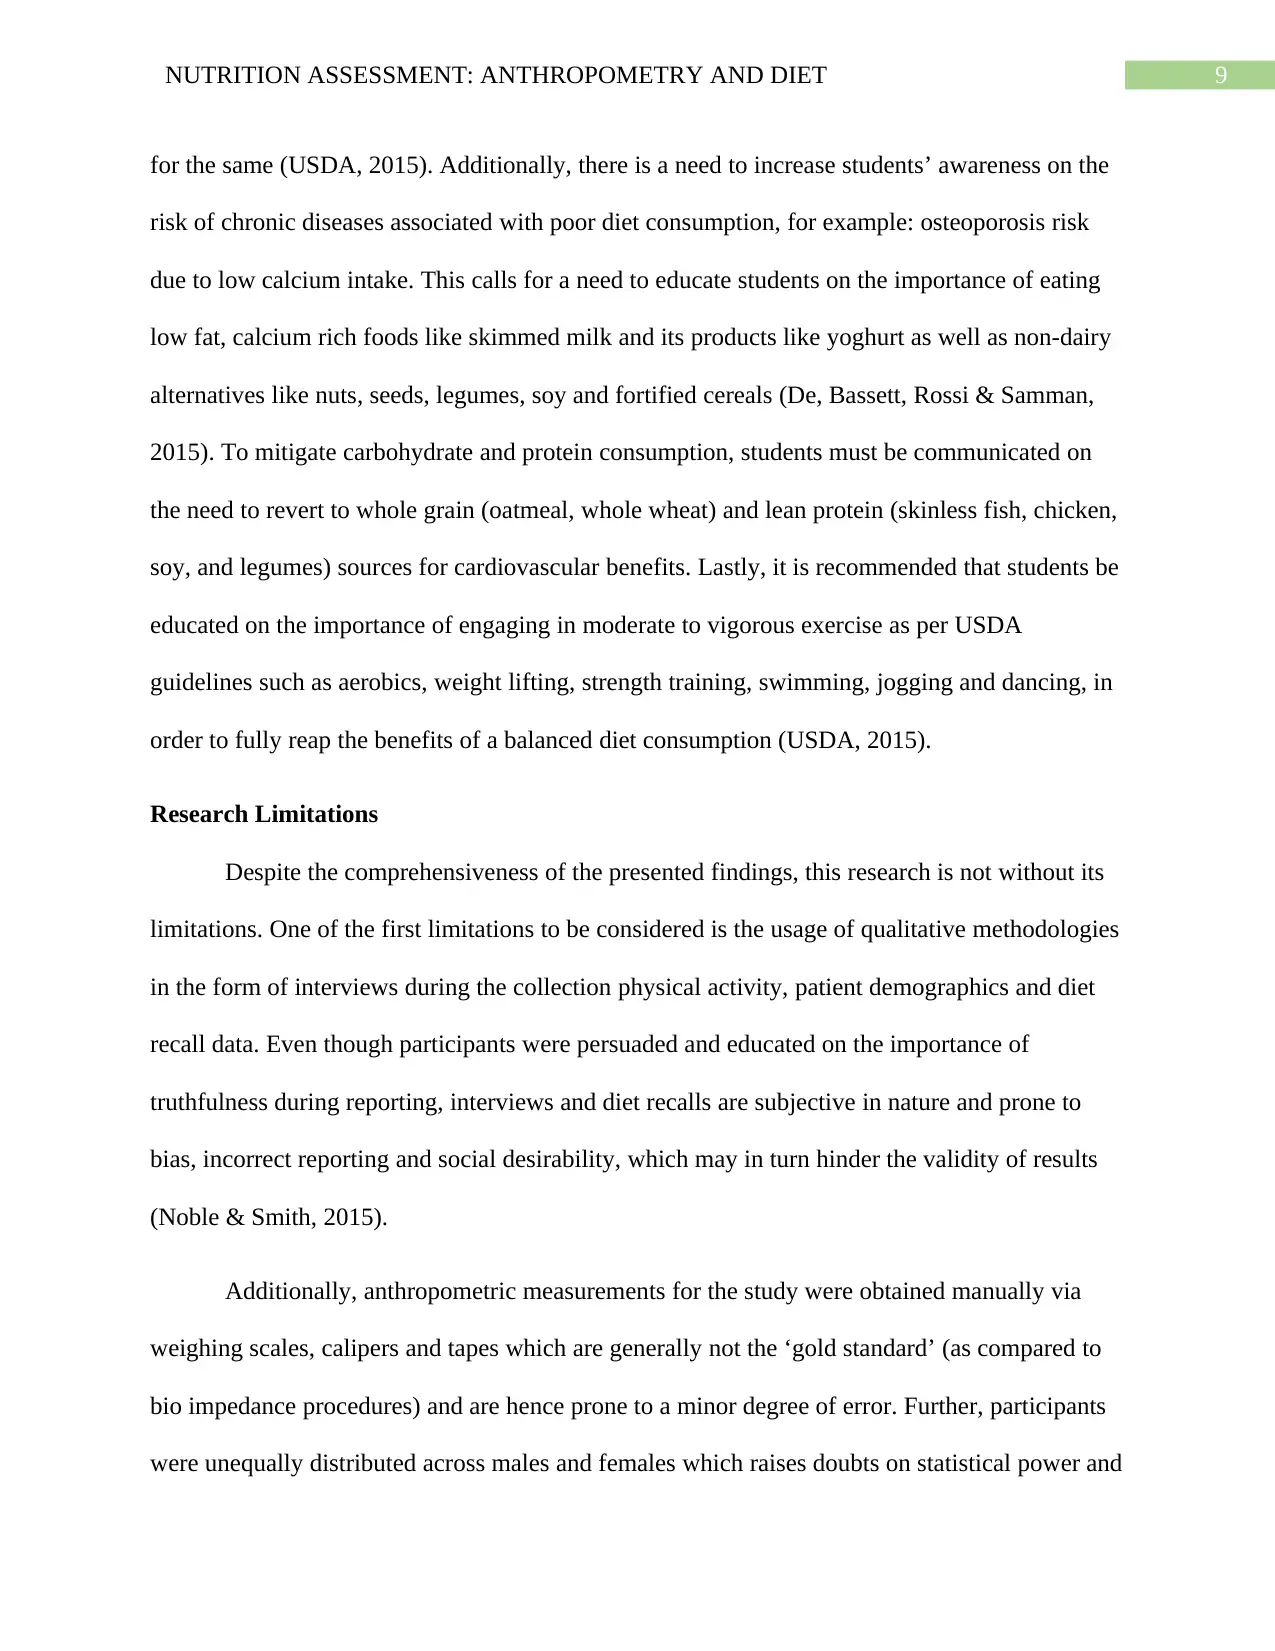
When compared with the USDA 2015 to 2020 dietary guidelines, discrepancies in
nutrient intake were observed in males, in the form of excessive carbohydrate (254.49 grams, ±
183.14), excessive protein (96.2 grams, ± 56.87) and deficient calcium (776.3 grams, ± 551.640)
consumption (Appendix 1, Table 6). Interestingly, similar excesses and deficiencies in terms of
carbohydrate (221.7 grams, ±205.56), protein (92 grams, ± 57.02) and calcium (713.3 grams, ±
416.60) consumption could be observed in females when compared with the recommendations
(Appendix 2, Table 13). In addition to the high risk of diabetes, cardiovascular disease and renal
disorders associated with high intake of carbohydrates and fats, the association between calcium
deficiency and osteoporosis risk is concerning issue from these findings, hence necessitating
nutritional education (Yahia, Wang, Rapley & Dey, 2016).
Recommendations and Interventions
Considering the above, students must firstly be educated on the importance of consuming
a balanced diet rich in all the USDA food groups such as grains, proteins, dairy, vegetables and
fruits to prevent deficiencies. Such education can be accompanied by teaching students on key
food selection and recipe strategies compliant to their budget and academic schedules
(Mehrabani & Mehrabani, 2016). Using the MyPlate tool developed by the USDA can be useful
training and nutrient and protein dense food consumption in order to live up to societal body
building standards. Stereotypes associated with physical appearance may also be a reason
contributing to the deficient mean food group intake in case of females (Eagleman, 2015).
Additionally, such food intake deficiencies across both genders may be due to the fact that the
sample comprised of university students who in turn, have been evidenced to engage in
inadequate food consumption as a result of lack of awareness, financial and time constraints
(Baig et al., 2015).
When compared with the USDA 2015 to 2020 dietary guidelines, discrepancies in
nutrient intake were observed in males, in the form of excessive carbohydrate (254.49 grams, ±
183.14), excessive protein (96.2 grams, ± 56.87) and deficient calcium (776.3 grams, ± 551.640)
consumption (Appendix 1, Table 6). Interestingly, similar excesses and deficiencies in terms of
carbohydrate (221.7 grams, ±205.56), protein (92 grams, ± 57.02) and calcium (713.3 grams, ±
416.60) consumption could be observed in females when compared with the recommendations
(Appendix 2, Table 13). In addition to the high risk of diabetes, cardiovascular disease and renal
disorders associated with high intake of carbohydrates and fats, the association between calcium
deficiency and osteoporosis risk is concerning issue from these findings, hence necessitating
nutritional education (Yahia, Wang, Rapley & Dey, 2016).
Recommendations and Interventions
Considering the above, students must firstly be educated on the importance of consuming
a balanced diet rich in all the USDA food groups such as grains, proteins, dairy, vegetables and
fruits to prevent deficiencies. Such education can be accompanied by teaching students on key
food selection and recipe strategies compliant to their budget and academic schedules
(Mehrabani & Mehrabani, 2016). Using the MyPlate tool developed by the USDA can be useful
9NUTRITION ASSESSMENT: ANTHROPOMETRY AND DIET
for the same (USDA, 2015). Additionally, there is a need to increase students’ awareness on the
risk of chronic diseases associated with poor diet consumption, for example: osteoporosis risk
due to low calcium intake. This calls for a need to educate students on the importance of eating
low fat, calcium rich foods like skimmed milk and its products like yoghurt as well as non-dairy
alternatives like nuts, seeds, legumes, soy and fortified cereals (De, Bassett, Rossi & Samman,
2015). To mitigate carbohydrate and protein consumption, students must be communicated on
the need to revert to whole grain (oatmeal, whole wheat) and lean protein (skinless fish, chicken,
soy, and legumes) sources for cardiovascular benefits. Lastly, it is recommended that students be
educated on the importance of engaging in moderate to vigorous exercise as per USDA
guidelines such as aerobics, weight lifting, strength training, swimming, jogging and dancing, in
order to fully reap the benefits of a balanced diet consumption (USDA, 2015).
Research Limitations
Despite the comprehensiveness of the presented findings, this research is not without its
limitations. One of the first limitations to be considered is the usage of qualitative methodologies
in the form of interviews during the collection physical activity, patient demographics and diet
recall data. Even though participants were persuaded and educated on the importance of
truthfulness during reporting, interviews and diet recalls are subjective in nature and prone to
bias, incorrect reporting and social desirability, which may in turn hinder the validity of results
(Noble & Smith, 2015).
Additionally, anthropometric measurements for the study were obtained manually via
weighing scales, calipers and tapes which are generally not the ‘gold standard’ (as compared to
bio impedance procedures) and are hence prone to a minor degree of error. Further, participants
were unequally distributed across males and females which raises doubts on statistical power and
Secure Best Marks with AI Grader
Need help grading? Try our AI Grader for instant feedback on your assignments.
10NUTRITION ASSESSMENT: ANTHROPOMETRY AND DIET
thus, contribute to gender differences in data (Mulasi, Kuchnia, Cole & Earthman, 2015). Lastly,
the sample size of the study was relatively small and comprised only of university students
which are likely to affect the applicability and generalizability of findings across populations like
adults and the elderly or in circumstances different than that of university settings. Further, this
study only took into consideration gender as the major independent variable, which raises the
possibility of results being affected by confounding variables such as participants’ age,
employment status and race. Such limitations thus demonstrate the need to conduct further
research using larger and diverse populations and scientifically credible methods in order to
produce valid, significant and applicable results (Heale & Twycross, 2015).
Conclusion
This paper thus provides and extensive and elaborate discussion on the notable
differences observed between male and female university students in terms of anthropometrics,
dietary and food intake values. While higher rates of overweight and high risk waist
circumferences were observed across females, males demonstrated considerably higher rates of
obesity as well as excessive consumption of proteins and carbohydrates. Deficiencies in calcium
must be addressed immediately to prevent future bone disease risk. To conclude, dietary and
exercise related educational strategies are recommended to correct such discrepancies in
university students.
11NUTRITION ASSESSMENT: ANTHROPOMETRY AND DIET
References
Armenta, B. G., Díaz, R. Z., Valencia, M. J., & Quizán, T. P. (2015). Obesity management in the
primary care setting by an intensive lifestyle intervention. Nutricion hospitalaria, 32(4),
1526-1534. doi: https://doi.org/10.3305/nh.2015.32.4.9366.
CDC. (2018). Adult Obesity Facts | Overweight & Obesity | CDC. Retrieved 18 December 2019,
from https://www.cdc.gov/obesity/data/adult.html.
Han, T. S., & Lean, M. E. (2016). A clinical perspective of obesity, metabolic syndrome and
cardiovascular disease. JRSM cardiovascular disease, 5, 2048004016633371. doi:
https://doi.org/10.1177%2F2048004016633371.
Poobalan, A., & Aucott, L. (2016). Obesity among young adults in developing countries: a
systematic overview. Current obesity reports, 5(1), 2-13. doi:
https://doi.org/10.1007/s13679-016-0187-x.
Cullen, K. W., & Chen, T. A. (2017). The contribution of the USDA school breakfast and lunch
program meals to student daily dietary intake. Preventive medicine reports, 5, 82-85. doi:
https://doi.org/10.1016/j.pmedr.2016.11.016.
Fang, S., Liu, C., Zhu, F., Delp, E. J., & Boushey, C. J. (2015, December). Single-view food
portion estimation based on geometric models. In 2015 IEEE International Symposium
on Multimedia (ISM) (pp. 385-390). IEEE. doi: https://doi.org/10.1109/ISM.2015.67.
Rayburn, B., Chen, S., & Phillips, C. (2015). Female college athletes’ perceptions on gender
stereotypes and discrimination in collegiate athletics. International Journal of Business
12NUTRITION ASSESSMENT: ANTHROPOMETRY AND DIET
and Social Sciences, 6(5), 28-36. Retrieved from:
http://ijbssnet.com/journals/Vol_6_No_5_May_2015/4.pdf.
Mitchell, S., & Shaw, D. (2015). The worldwide epidemic of female obesity. Best practice &
research Clinical obstetrics & gynaecology, 29(3), 289-299. doi:
https://doi.org/10.1016/j.bpobgyn.2014.10.002.
Rufa'i, A. A., Sajoh, K. I., Oyeyemi, A. L., & Gwani, A. S. (2019). Waist Circumference, Waist
Hip Ratio and Body Mass Index in Female Undergraduates of a Tertiary Institution in
Nigeria: a Cross-sectional Study. Internet Journal of Allied Health Sciences and
Practice, 17(1), 12. Retrieved from: https://nsuworks.nova.edu/ijahsp/vol17/iss1/12/.
Broughton, D. E., & Moley, K. H. (2017). Obesity and female infertility: potential mediators of
obesity's impact. Fertility and sterility, 107(4), 840-847. doi:
https://doi.org/10.1016/j.fertnstert.2017.01.017.
Hallam, J., Boswell, R. G., DeVito, E. E., & Kober, H. (2016). Focus: sex and gender health:
gender-related differences in food craving and obesity. The Yale journal of biology and
medicine, 89(2), 161. doi: PMC4918881.
Taber, D. R., Robinson, W. R., Bleich, S. N., & Wang, Y. C. (2016). Deconstructing race and
gender differences in adolescent obesity: Oaxaca‐blinder decomposition. Obesity, 24(3),
719-726. doi: https://doi.org/10.1002/oby.21369.
USDA. (2015). 2015-2020 Dietary Guidelines | Dietary Guidelines for Americans. Retrieved 18
December 2019, from
https://www.dietaryguidelines.gov/current-dietary-guidelines/2015-2020-dietary-
guidelines.
Paraphrase This Document
Need a fresh take? Get an instant paraphrase of this document with our AI Paraphraser
13NUTRITION ASSESSMENT: ANTHROPOMETRY AND DIET
Zach, S., & Adiv, T. (2016). Strength training in males and females–Motives, training habits,
knowledge, and stereotypic perceptions. Sex Roles, 74(7-8), 323-334. doi:
https://doi.org/10.1007/s11199-015-0544-3.
USDA. (2019). Back to Basics: All About MyPlate Food Groups. Retrieved 18 December 2019,
from https://www.usda.gov/media/blog/2017/09/26/back-basics-all-about-myplate-food-
groups.
Eagleman, A. N. (2015). Constructing gender differences: Newspaper portrayals of male and
female gymnasts at the 2012 Olympic Games. Sport in Society, 18(2), 234-247. doi:
https://doi.org/10.1080/17430437.2013.854509.
Baig, M., Gazzaz, Z. J., Gari, M. A., Al-Attallah, H. G., Al-Jedaani, K. S., Mesawa, A. T., & Al-
Hazmi, A. A. (2015). Prevalence of obesity and hypertension among University students’
and their knowledge and attitude towards risk factors of Cardiovascular Disease (CVD)
in Jeddah, Saudi Arabia. Pakistan journal of medical sciences, 31(4), 816. doi:
https://dx.doi.org/10.12669%2Fpjms.314.7953.
Yahia, N., Wang, D., Rapley, M., & Dey, R. (2016). Assessment of weight status, dietary habits
and beliefs, physical activity, and nutritional knowledge among university
students. Perspectives in public health, 136(4), 231-244. doi:
https://doi.org/10.1177%2F1757913915609945.
Mehrabani, F., & Mehrabani, J. (2016). Evaluation of the level of physical activity, physical
fitness, obesity, and musculoskeletal abnormalities in university students. Tabari
Biomedical Student Research Journal, 2(3), 33-43. doi: http://tbsrj.mazums.ac.ir/article-
1-3564-en.html.
14NUTRITION ASSESSMENT: ANTHROPOMETRY AND DIET
De, A. P., Bassett, N., Rossi, A., & Samman, N. (2015). Trends in food consumption of
university students. Nutricion hospitalaria, 31(4), 1824-1831. doi:
https://doi.org/10.3305/nh.2015.31.4.8361.
Noble, H., & Smith, J. (2015). Issues of validity and reliability in qualitative research. Evidence-
based nursing, 18(2), 34-35. doi: http://dx.doi.org/10.1136/eb-2015-102054.
Heale, R., & Twycross, A. (2015). Validity and reliability in quantitative studies. Evidence-
based nursing, 18(3), 66-67. doi: http://dx.doi.org/10.1136/eb-2015-102129.
Mulasi, U., Kuchnia, A. J., Cole, A. J., & Earthman, C. P. (2015). Bioimpedance at the bedside:
current applications, limitations, and opportunities. Nutrition in Clinical Practice, 30(2),
180-193. doi: https://doi.org/10.1177/0884533614568155.
WHO. (2018). Obesity and overweight. Retrieved 18 December 2019, from
https://www.who.int/news-room/fact-sheets/detail/obesity-and-overweight.
15NUTRITION ASSESSMENT: ANTHROPOMETRY AND DIET
Appendices
Appendices: Results for Male Participants
Table 1: Anthropometric Measurements for Males (n0 = 103)
Parameters Mean Standard Deviation
Body Mass Index 26.7 kg/m2 ±6.957
Waist Circumference 84.57 cm ±15.95
Percentage Males with High Risk Waist Circumference: 13.5 %
Hip Circumference 101.33 cm ±12
Waist Hip Ratio 0.83 ±0.112
MUAC 31.5 cm ±7.181
Arm Muscle Area 25.56 cm2 ±5.81
Sum of four skin folds 75 cm ±24.56
Body density 1.027 ±0.010
Percentage Body Fat 31.94 % ±4.78
Table 2: Participant Demographics (Males) (n0 = 103)
Parameter
Mean Age 29.5 (SD : ±12.5)
Percentages
Working Status: Full Time 16 %
Working Status: Part Time 11 %
Working Status: Unemployed 73 %
Ethnicity: White (Non-Hispanic) 14 %
Ethnicity White (Hispanic) 6 %
Ethnicity (Black) 4 %
Ethnicity (Asian) 17 %
Ethnicity (Pacific Islander) -
Ethnicity (American Indian/Alaskan Native) -
Ethnicity (Other) 57 %
Physical Activity Status: Moderate 74 %
Physical Activity Status: Vigorous 26 %
Table 3: Body Mass Index Percentages for Males (n0 = 103)
Underweight Normal to
Healthy Weight
Overweight Obese Extreme
Obesity
9 % 43 % 23 % 21 % 4 %
Secure Best Marks with AI Grader
Need help grading? Try our AI Grader for instant feedback on your assignments.
16NUTRITION ASSESSMENT: ANTHROPOMETRY AND DIET
Table 4: Daily Mean Intake of Food Groups for Males (n0 = 103)
Grains (6
ounces)
Total
Vegetables (2 ½
Cups)
Fruits (2 Cups) Dairy (3 Cups) Proteins (5 ½
ounces)
7.04 (SD: ±5.67) 2.24 (SD:
±2.078)
0.63 (SD: ±0.83) 0.89 (SD: ±1.23) 8.18 (SD: ±7.58)
Table 6: Nutrient Intake for Males (n0 = 103)
Nutrient Mean Standard Deviation
Energy 1973.71 kcal ±931.46
Estimated Energy
Expenditure
1947.74 kcal ±900.42
Carbohydrates 254.49 grams ±183.14
Proteins 96.2 grams ±56.87
Fat 67.57 grams ±37.70
Vitamin B2 2.52 mg ±3.51
Vitamin B6 2.12 mg ±2.044
Vitamin A 6595.8 IU ±24019.2
Vitamin D 172.44 μg ±302.7
Vitamin E 8.60 mg ±11.79
Iron 15.54 mg ±11.76
Calcium 776.3 mg ±551.64
Sodium 3278.68 mg ±2204.37
Potassium 2259.46 mg ±1246.99
Table 7: Nutrient Density for Males (n0 = 103)
Nutrient Mean Standard Deviation
Vitamin B2 1.16 mg ±1.93
Vitamin B6 1.07 mg ±2.53
Vitamin A 3341.8 IU ±4797.70
Vitamin D 87.36 μg ±43.14
Vitamin E 4.35 mg ±10.54
Iron 7.87 mg ±10.42
Calcium 393.32 mg ±213.19
Potassium 1144.7 mg ±919.60
Table 8: Acceptable Macronutrient Distribution Ranges (AMDR) values for Males (n0 =
103)
17NUTRITION ASSESSMENT: ANTHROPOMETRY AND DIET
Carbohydrates (45 to 65%) 52 %
Proteins (10 to 35 %) 19.4 %
Fats (20 to 35 %) 14 %
Appendix 2: Results for Females
Table 9: Anthropometric Measurements for Females (n1 = 60)
Parameters Mean Standard Deviation
Body Mass Index 26.5 kg/m2 ±7.0
Waist Circumference 86.4 cm ±17.29
Percentage Females with High Risk Waist Circumference: 42 %
Hip Circumference 102.4 cm ±12.34
Waist Hip Ratio 0.84 ±0.10
MUAC 31.4 cm ±6.13
Arm Muscle Area 20.52 cm2 ±5.74
Sum of four skin folds 72 cm ±26.91
Body density 1.029 ±0.01
Percentage Body Fat 31.11% ±5.79
Table 10: Participant Demographics (Females) (n1 = 60)
Parameter
Mean Age 35.3 (SD: ±14.60)
Percentages
Working Status: Full Time 45 %
Working Status: Part Time 13 %
Working Status: Unemployed 42 %
Ethnicity: White (Non-Hispanic) 42 %
Ethnicity White (Hispanic) 3 %
Ethnicity (Black) 15 %
Ethnicity (Asian) 32 %
Ethnicity (Pacific Islander) 2 %
Ethnicity (American Indian/Alaskan Native) -
Ethnicity (Other) -
Physical Activity Status: Moderate 72 %
Physical Activity Status: Vigorous 28 %
Table 11: Body Mass Index Percentages for Females (n1 = 60)
Underweight Normal to
Healthy Weight
Overweight Obese Extreme
Obesity
1 % 51 % 25 % 20 % 3 %
18NUTRITION ASSESSMENT: ANTHROPOMETRY AND DIET
Table 12: Daily Mean Intake of Food Groups for Females (n1 = 60)
Grains (6
ounces)
Total
Vegetables (2 ½
Cups)
Fruits (2 Cups) Dairy (3 Cups) Proteins (4 ½
ounces)
6.88 (SD: ±3.29) 1.9 (SD: ±2.16) 1.01 (SD: ±1.59) 1.29 (SD: ±1.44) 4.58 (SD: ±3.01)
Table 13: Nutrient Intake for Females (n1 = 60)
Nutrient Mean Standard Deviation
Energy 1897 Kcal ±995.54
Estimated Energy
Expenditure
1824.54 Kcal ±900.62
Carbohydrates 221.7 grams ±205.56
Proteins 92 grams ±57.02
Fat 77.9 grams ±69.96
Vitamin B2 1.78 mg ±2.29
Vitamin B6 1.88 mg ±2.11
Vitamin A 4413.8 IU ±6663.18
Vitamin D 118.4 μg ±241.95
Vitamin E 8.99 mg ±14.08
Iron 13.2 mg ±9.7
Calcium 713.3 mg ±416.60
Sodium 2875.73 mg ±1474.61
Potassium 2041 mg ±1282.69
Table 14: Nutrient Density for Females (n1= 60)
Nutrient Mean Standard Deviation
Vitamin B2 1.02 mg ±1.76
Vitamin B6 1.03 mg ±0.10
Vitamin A 2419.13 IU ±355.12
Vitamin D 64.89 μg ±48.19
Vitamin E 4.92 mg ±1.95
Iron 7.23 mg ±11.58
Calcium 390.94 mg ±303.11
Potassium 1118.6 mg ±244.94
Table 15: Acceptable Macronutrient Distribution Ranges (AMDR) values for Females
(n1 = 60)
Carbohydrates (45 to 65%) 47 %
Proteins (10 to 35 %) 19 %
Paraphrase This Document
Need a fresh take? Get an instant paraphrase of this document with our AI Paraphraser
19NUTRITION ASSESSMENT: ANTHROPOMETRY AND DIET
Fats (20 to 35 %) 37 %
Appendix 3: Figures
Carbohydrates (45 to 65 %)
Proteins (10 to 35 %)
Fats (20 to 35 %)
0 10 20 30 40 50 60
Figure 1: Gender Differences in AMDR Values
Females Males
Underweight
Normal
Overweight
Obese
Extreme
Obesity
0 10 20 30 40 50 60
Figure 2: Gender Differences in BMI Categories
Females Males
20NUTRITION ASSESSMENT: ANTHROPOMETRY AND DIET
% High Risk Waist Circumference
0 5 10 15 20 25 30 35 40 45
Figure 3: % Distribution in High Risk Waist Circumference
Females Males
Grains (ounces)
Total Vegetables (Cups)
Fruits (Cups)
Dairy (Cups)
Proteins (ounces)
0 1 2 3 4 5 6 7 8 9
Figure 4: Gender Differences in Mean Food Group Intake
Females Males
21NUTRITION ASSESSMENT: ANTHROPOMETRY AND DIET
Moderate
Vigorous
0 10 20 30 40 50 60 70 80
Figure 5: % Distribution in Physical Activity Engagement
Females Males
Moderate
Vigorous
0 10 20 30 40 50 60 70 80
Figure 5: % Distribution in Physical Activity Engagement
Females Males
1 out of 22
Related Documents


Your All-in-One AI-Powered Toolkit for Academic Success.
+13062052269
info@desklib.com
Available 24*7 on WhatsApp / Email
![[object Object]](/_next/static/media/star-bottom.7253800d.svg)
Unlock your academic potential
© 2024 | Zucol Services PVT LTD | All rights reserved.