In-Depth Nutrition Assessment: Analyzing Diet and Nutrient Intake
VerifiedAdded on 2023/06/15
|32
|3950
|457
Report
AI Summary
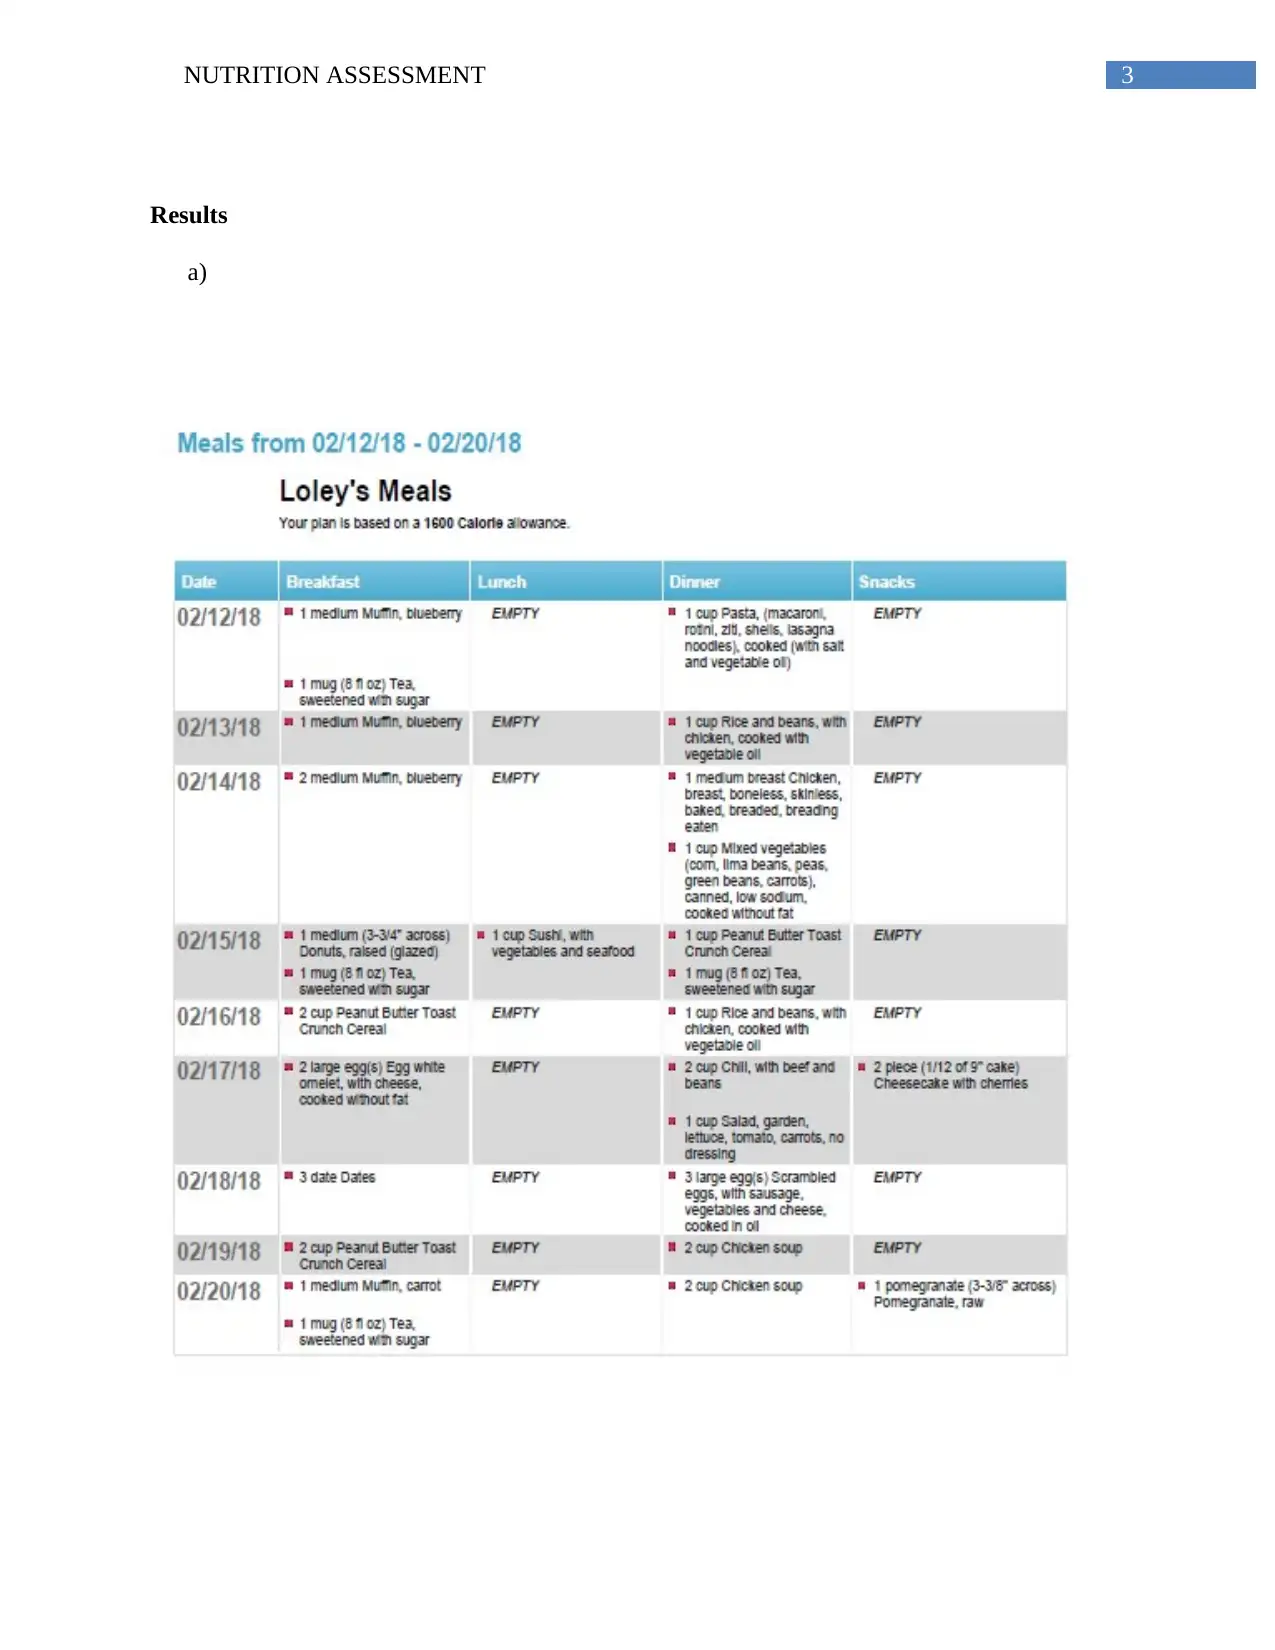
This assignment presents a comprehensive nutrition assessment based on a 7-day diet plan. The analysis includes evaluating energy, carbohydrate, fat, and protein intake, as well as assessing vitamin and mineral consumption. The report reveals that the diet is high in carbohydrates, sugars, fats, and cholesterol, with inadequate intake of fresh fruits, vegetables, and dairy. The assessment compares actual nutrient intake with recommended daily allowances (RDAs) and suggests dietary modifications to improve overall health. Specific areas of focus include increasing fiber intake, reducing saturated fat consumption, and balancing protein sources. The analysis also identifies specific foods contributing to high sugar and fat intake and recommends alternative, nutrient-rich options. This detailed evaluation provides a foundation for developing a personalized nutrition care plan to address identified deficiencies and promote better health.

1 out of 32
Related Documents


Your All-in-One AI-Powered Toolkit for Academic Success.
+13062052269
info@desklib.com
Available 24*7 on WhatsApp / Email
![[object Object]](/_next/static/media/star-bottom.7253800d.svg)
Copyright © 2020–2026 A2Z Services. All Rights Reserved. Developed and managed by ZUCOL.