Ask a question from expert
Occupational Health and Safety (OHS) Assignment
13 Pages2698 Words194 Views
Added on 2020-03-16
Occupational Health and Safety (OHS) Assignment
Added on 2020-03-16
BookmarkShareRelated Documents
4. Finding and AnalysisOccupational health and safety (OHS) measurement with the impact with injurieswhere the lost time injury frequency rate (LTIFR) is the indicator of OHS and Workers'compensation claims is the indicator of frequency of injuries.We have data of lost time injury frequency rate (LTIFR) and Workers' compensationclaims collected for Coles, Kmart, Target and Officework from the year 2013 to 2017. In thiswe analysis the data using different statistical techniques like descriptive statistics, correlationanalysis and regression analysis.Table 1, shows the lost time injury frequency rate (LTIFR) recorded for the Coles,Kmart, Target and Officework from the year 2013 to 2017. In Figure 1, we have represent thelost time injury frequency rate for Coles, Kmart, Target and Officework from the year 2013to 2017. We can observe from Table 1 and Figure 1 that lost time injury frequency rate(LTIFR) has been decreasing from year 2013 to 2017 for all the considered industries.Decrement is different for each industry.Table 1: Lost time injury frequency rate (LTIFR) recorded for the Coles, Kmart,Target and Officework from the year 2013 to 2017Company20132014201520162017Coles9.47.88.18.48.8Kmart9.16.96.76.76Target8.45.74.84.52.9Officeworks9.87.25.02.94.7
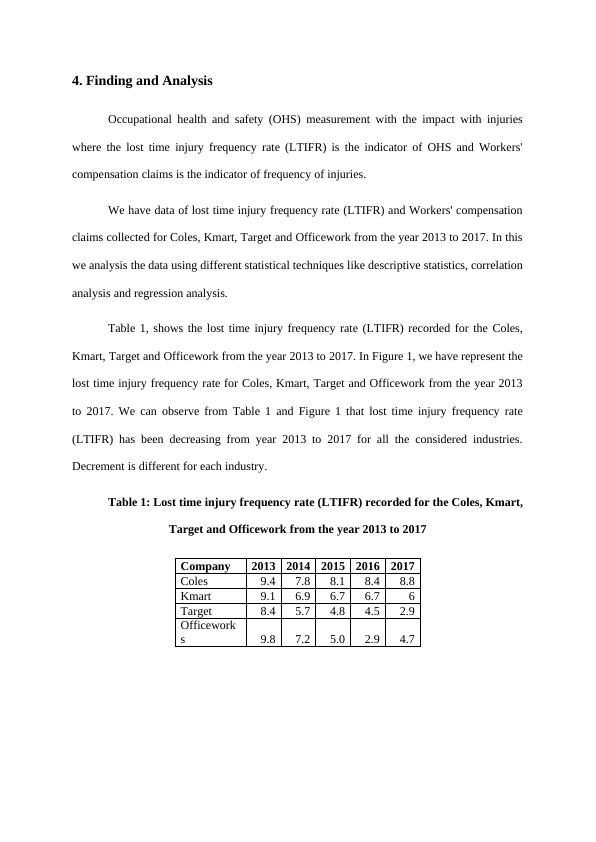
Figure 1: Graphical representation of lost time injury frequency rate (LTIFR)recorded for the Coles, Kmart, Target and Officework from the year 2013 to 2017Table 2 represented the Workers' compensation claims for the Coles, Kmart, Targetand Officework from the year 2013 to 2017. Figure 2 shows the Workers' compensationclaims for the Coles, Kmart, Target and Officework from the year 2013 to 2017. We canobserved that workers’ compensation claim is much higher for Coles industry than any otherindustries under study. Workers’ claim compensation is decreasing with time. Rate ofdecrement in workers’ compensation claim is different for each industry.Table 2: Workers' compensation claims recorded for the Coles, Kmart, Targetand Officeworks from the year 2013 to 2017Company20132014201520162017Coles58125449507150594503Kmart796727777681505Target619519483396283Officeworks19113113810888
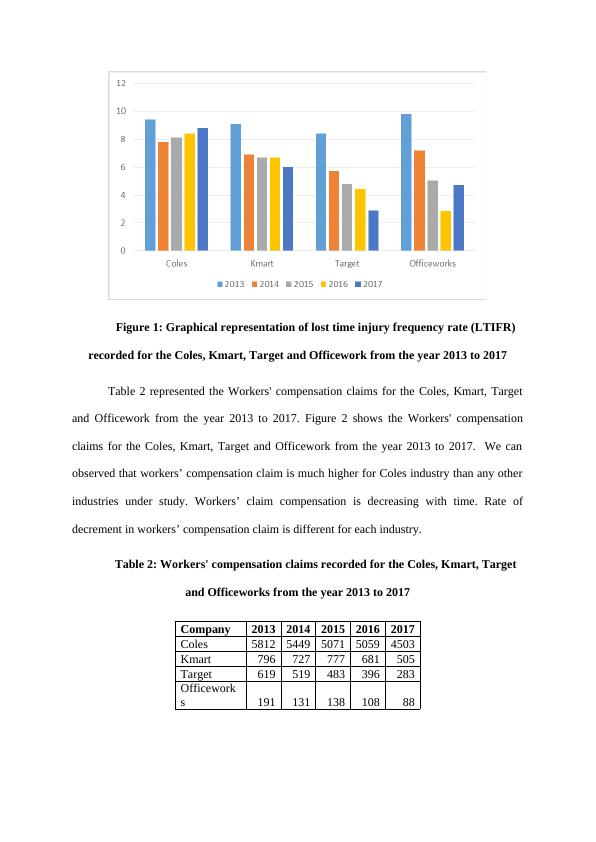
Figure 2: Graphical representation of Workers' compensation claims recordedfor the Coles, Kmart, Target and Officework from the year 2013 to 2017 4.1 Descriptive Statistics:In this subsection, we presented the summary statistics of lost time injury frequencyrate and workers’ compensation claim including maximum, minimum, range mean andstandard deviation. Table 3 represents the summary statistics for lost time injury frequencyrate. From Table 3, we can see that average lost time injury frequency rate is higher for Colesfollowed by Kmart. The average lost time injury frequency rate is lower for Target which isfollowed by Officeworks. Maximum lost time injury frequency rate is found for Officeworkswhereas Minimum is observed for Target. Standard deviation is lower for Coles industrywhere as it is higher for Officeworks. We can also observe the spread of lost time injuryfrequency rate by observing the range.
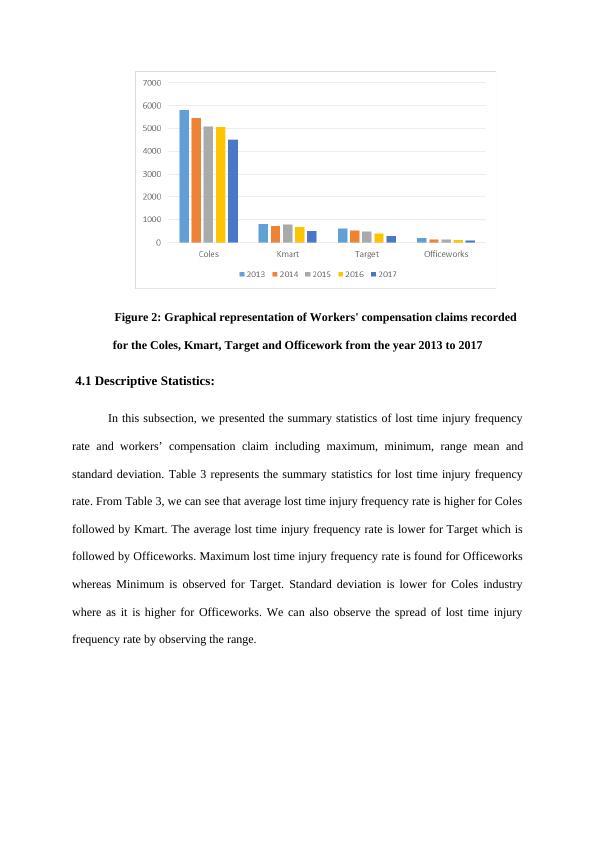
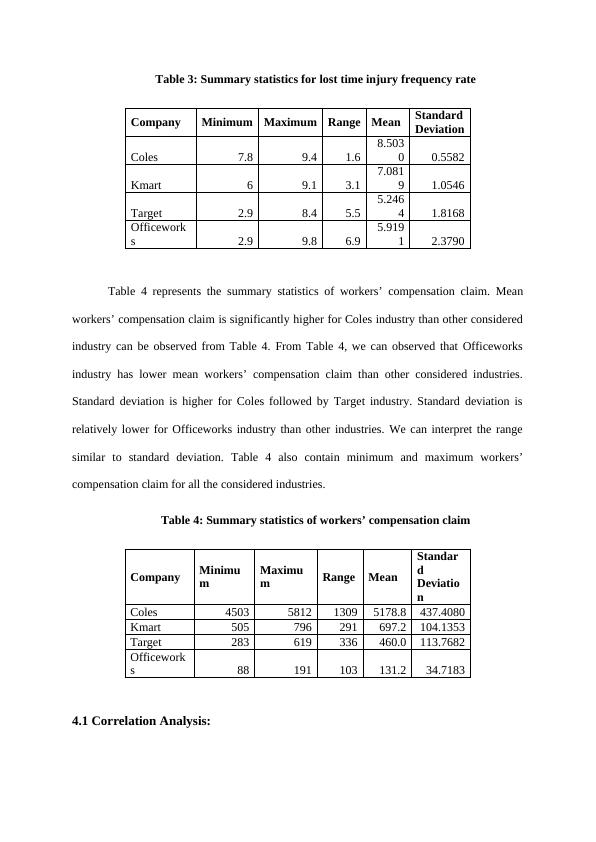
Table 3: Summary statistics for lost time injury frequency rateCompanyMinimumMaximumRangeMeanStandardDeviationColes7.89.41.68.50300.5582Kmart69.13.17.08191.0546Target2.98.45.55.24641.8168Officeworks2.99.86.95.91912.3790Table 4 represents the summary statistics of workers’ compensation claim. Meanworkers’ compensation claim is significantly higher for Coles industry than other consideredindustry can be observed from Table 4. From Table 4, we can observed that Officeworksindustry has lower mean workers’ compensation claim than other considered industries.Standard deviation is higher for Coles followed by Target industry. Standard deviation isrelatively lower for Officeworks industry than other industries. We can interpret the rangesimilar to standard deviation. Table 4 also contain minimum and maximum workers’compensation claim for all the considered industries.Table 4: Summary statistics of workers’ compensation claimCompanyMinimumMaximumRangeMeanStandardDeviationColes4503581213095178.8437.4080Kmart505796291697.2104.1353Target283619336460.0113.7682Officeworks88191103131.234.71834.1 Correlation Analysis:
End of preview
Want to access all the pages? Upload your documents or become a member.
Related Documents
Sustainable Business Management of Wesfarmerslg...
|13
|1695
|469
Occupational Health and Safety in Construction Industry - JKL Constructionslg...
|21
|4319
|285