Customer Analytics in Valeur: OLAP Queries and Data Warehouse Design
VerifiedAdded on 2023/06/14
|18
|1900
|289
Report
AI Summary
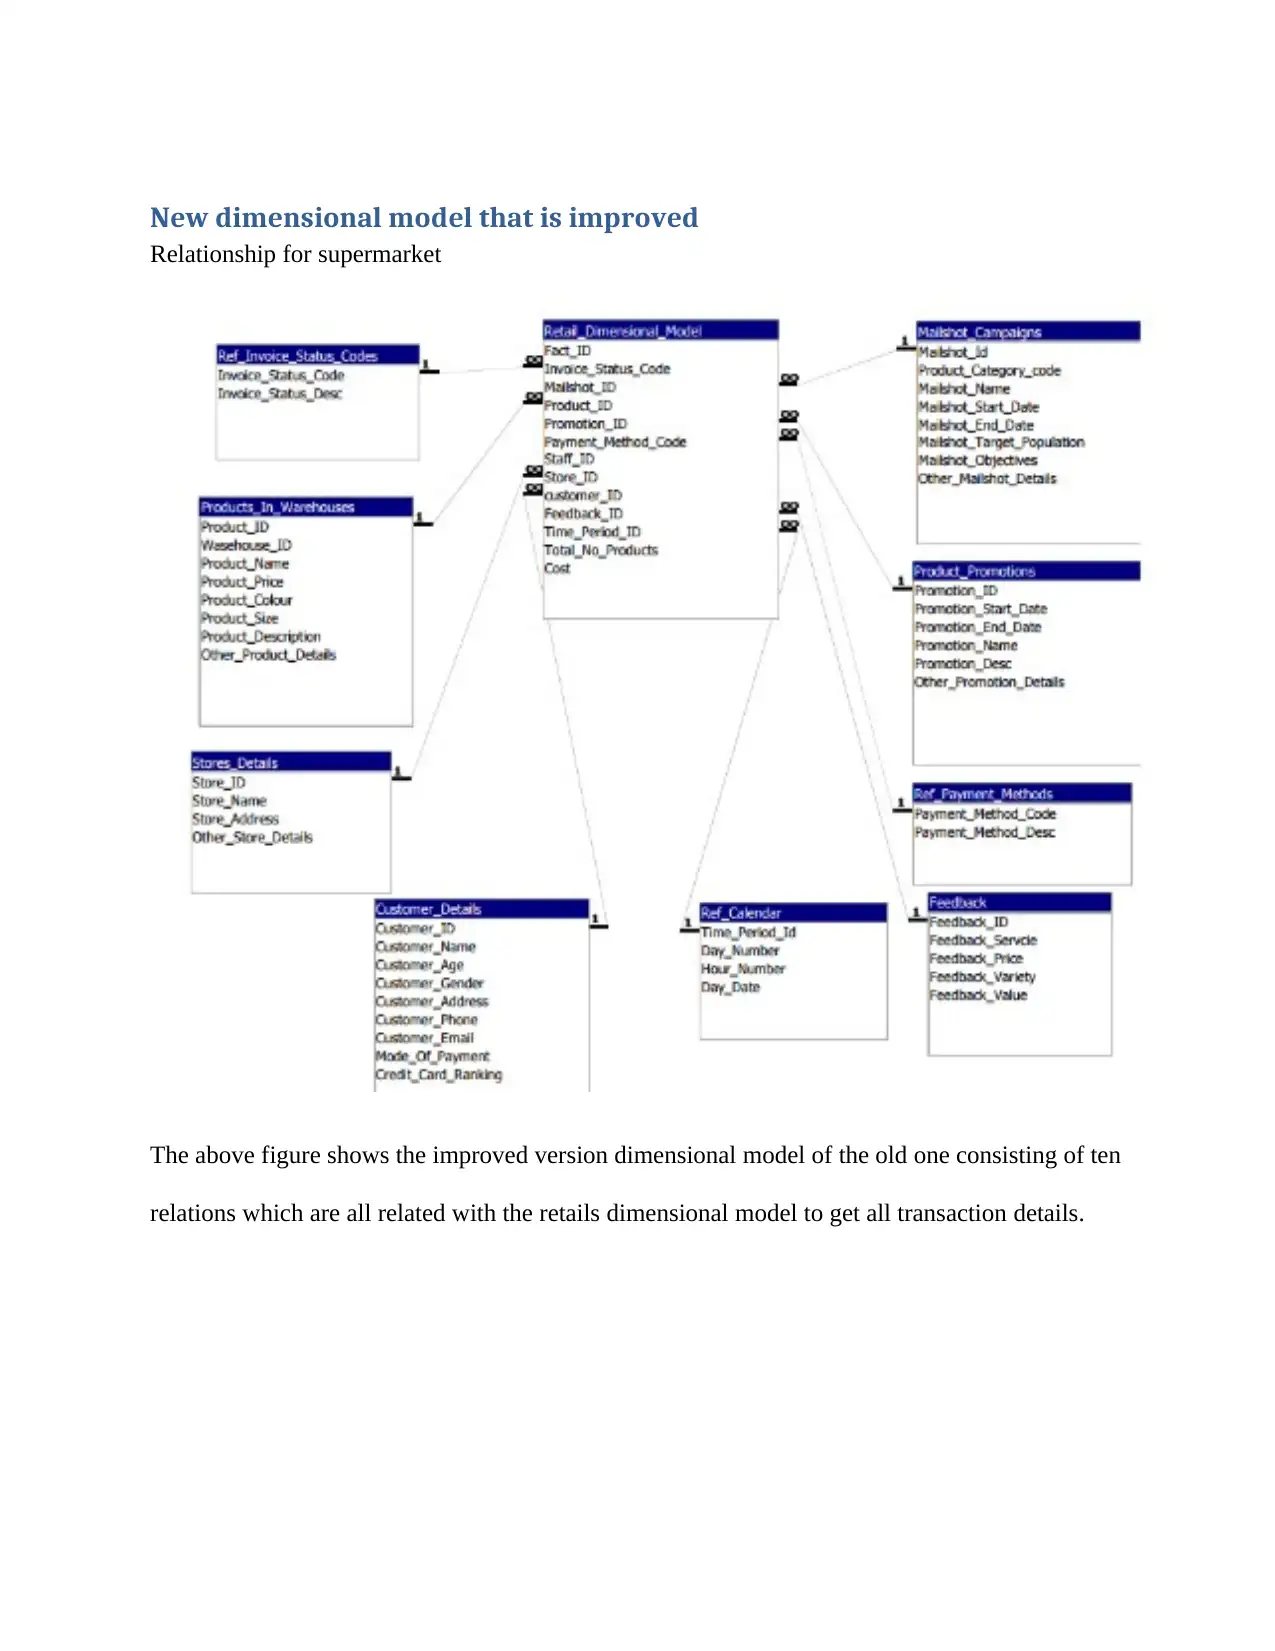
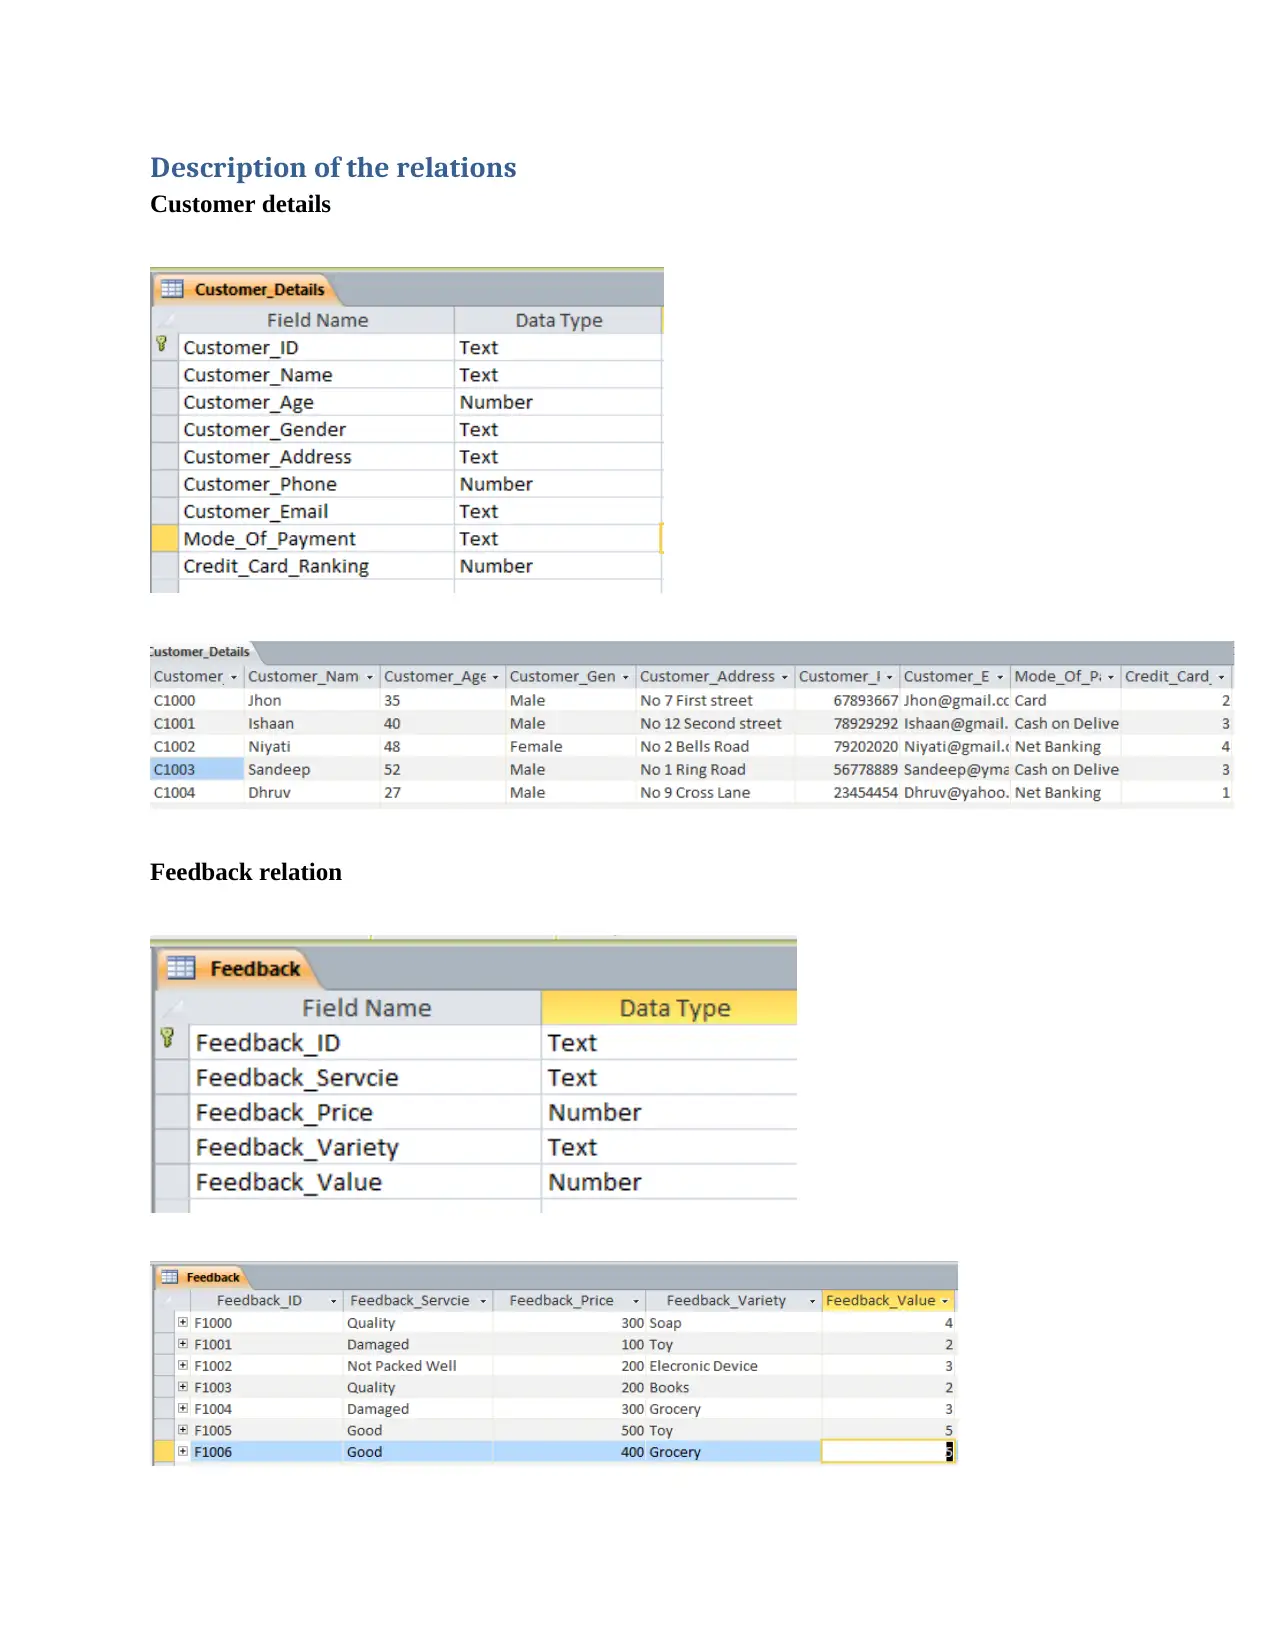
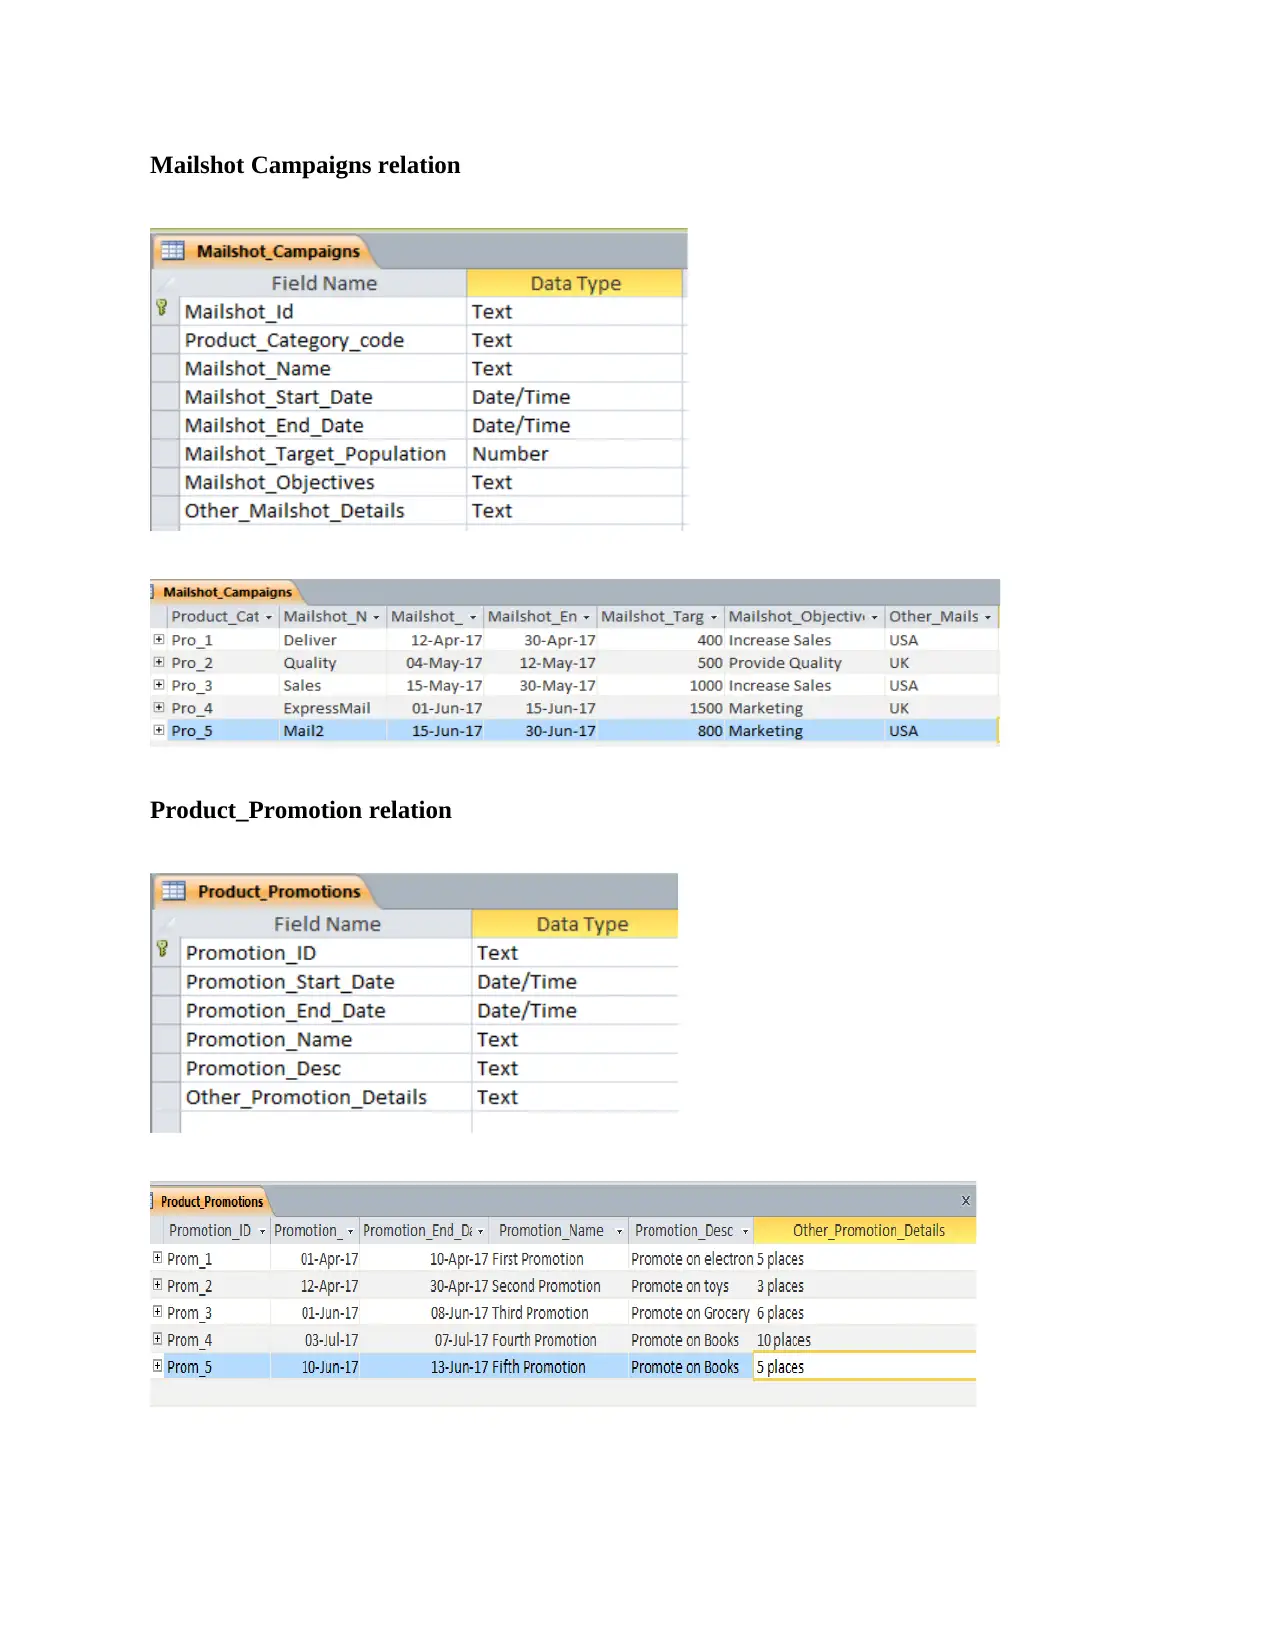
This report details the implementation of OLAP cubes and queries within a retail data warehouse environment to enhance customer analytics. It addresses the need for a more comprehensive understanding of customer behavior through both transactional data and demographic analysis. The report includes an improved dimensional model designed to capture relevant customer information, along with OLAP queries used to analyze customer purchasing patterns, product pricing, store performance, and customer feedback. Key improvements to the dimensional model include the incorporation of transaction fact tables and dimension surrogate keys. The analysis provides actionable insights for targeted marketing strategies and improved customer relationship management, aiming to convert low-value customers into high-value ones by identifying potential sales and marketing opportunities. The document also discusses the strategic advantages of analyzing customer flow and strategically upselling or downselling products. Desklib provides access to this report and other solved assignments for students.

1 out of 18


Your All-in-One AI-Powered Toolkit for Academic Success.
+13062052269
info@desklib.com
Available 24*7 on WhatsApp / Email
![[object Object]](/_next/static/media/star-bottom.7253800d.svg)
Copyright © 2020–2026 A2Z Services. All Rights Reserved. Developed and managed by ZUCOL.