Statistics: ANOVA Test, Chi-Square Test, T-Test, Correlation Analysis
Added on 2023-04-22
12 Pages2065 Words109 Views
Statistics
Student Name:
Instructor Name:
Course Number:
Student Name:
Instructor Name:
Course Number:
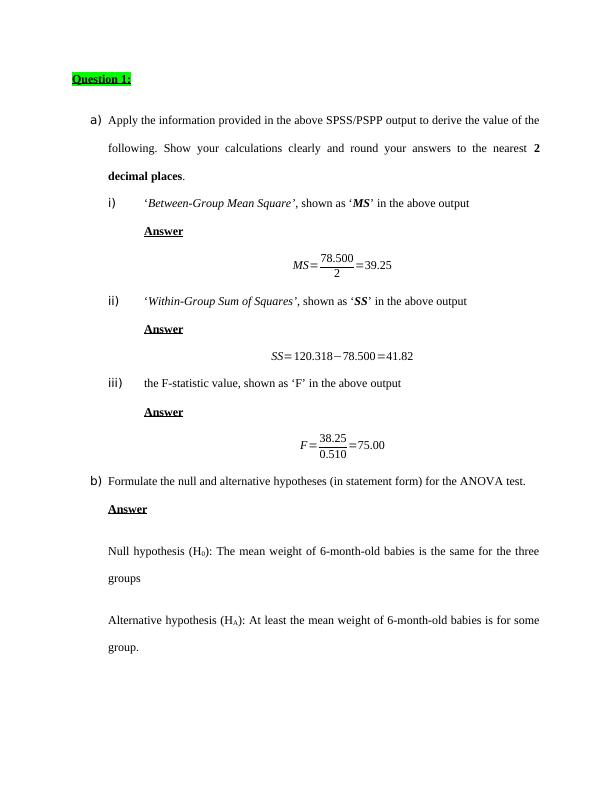
Question 1:
a) Apply the information provided in the above SPSS/PSPP output to derive the value of the
following. Show your calculations clearly and round your answers to the nearest 2
decimal places.
i) ‘Between-Group Mean Square’, shown as ‘MS’ in the above output
Answer
MS= 78.500
2 =39.25
ii) ‘Within-Group Sum of Squares’, shown as ‘SS’ in the above output
Answer
SS=120.318−78.500=41.82
iii) the F-statistic value, shown as ‘F’ in the above output
Answer
F= 38.25
0.510 =75.00
b) Formulate the null and alternative hypotheses (in statement form) for the ANOVA test.
Answer
Null hypothesis (H0): The mean weight of 6-month-old babies is the same for the three
groups
Alternative hypothesis (HA): At least the mean weight of 6-month-old babies is for some
group.
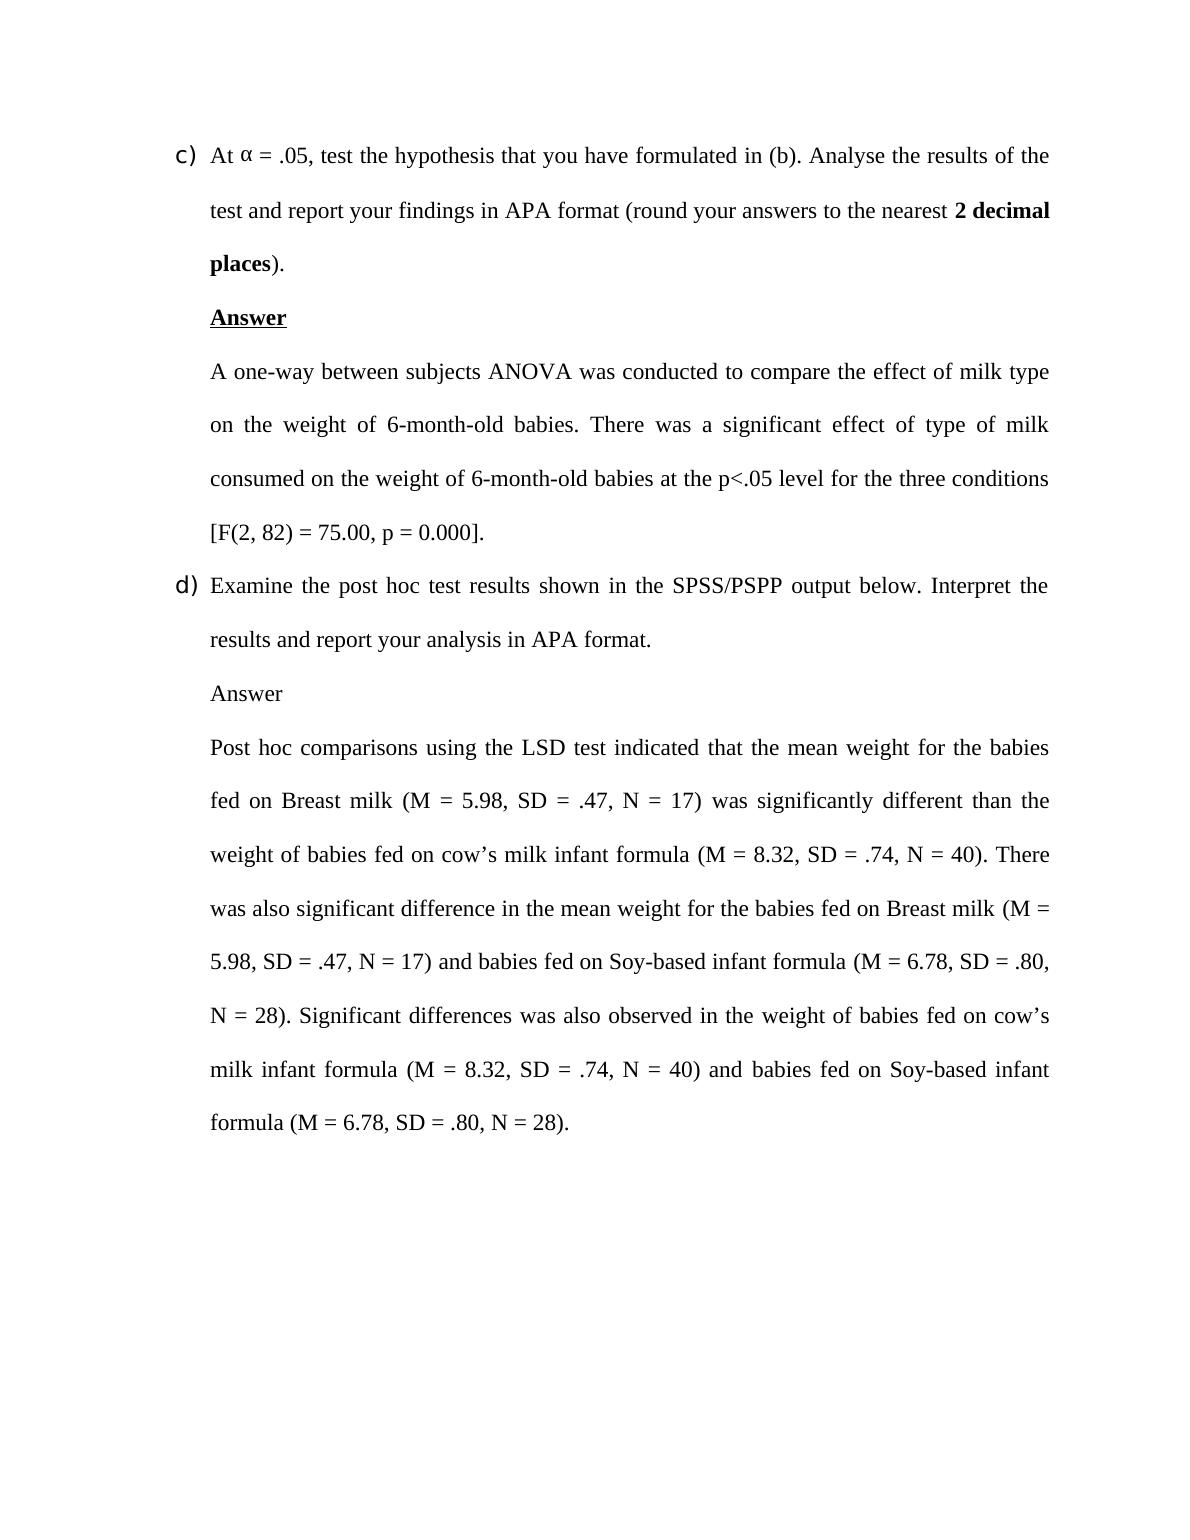
c) At α = .05, test the hypothesis that you have formulated in (b). Analyse the results of the
test and report your findings in APA format (round your answers to the nearest 2 decimal
places).
Answer
A one-way between subjects ANOVA was conducted to compare the effect of milk type
on the weight of 6-month-old babies. There was a significant effect of type of milk
consumed on the weight of 6-month-old babies at the p<.05 level for the three conditions
[F(2, 82) = 75.00, p = 0.000].
d) Examine the post hoc test results shown in the SPSS/PSPP output below. Interpret the
results and report your analysis in APA format.
Answer
Post hoc comparisons using the LSD test indicated that the mean weight for the babies
fed on Breast milk (M = 5.98, SD = .47, N = 17) was significantly different than the
weight of babies fed on cow’s milk infant formula (M = 8.32, SD = .74, N = 40). There
was also significant difference in the mean weight for the babies fed on Breast milk (M =
5.98, SD = .47, N = 17) and babies fed on Soy-based infant formula (M = 6.78, SD = .80,
N = 28). Significant differences was also observed in the weight of babies fed on cow’s
milk infant formula (M = 8.32, SD = .74, N = 40) and babies fed on Soy-based infant
formula (M = 6.78, SD = .80, N = 28).
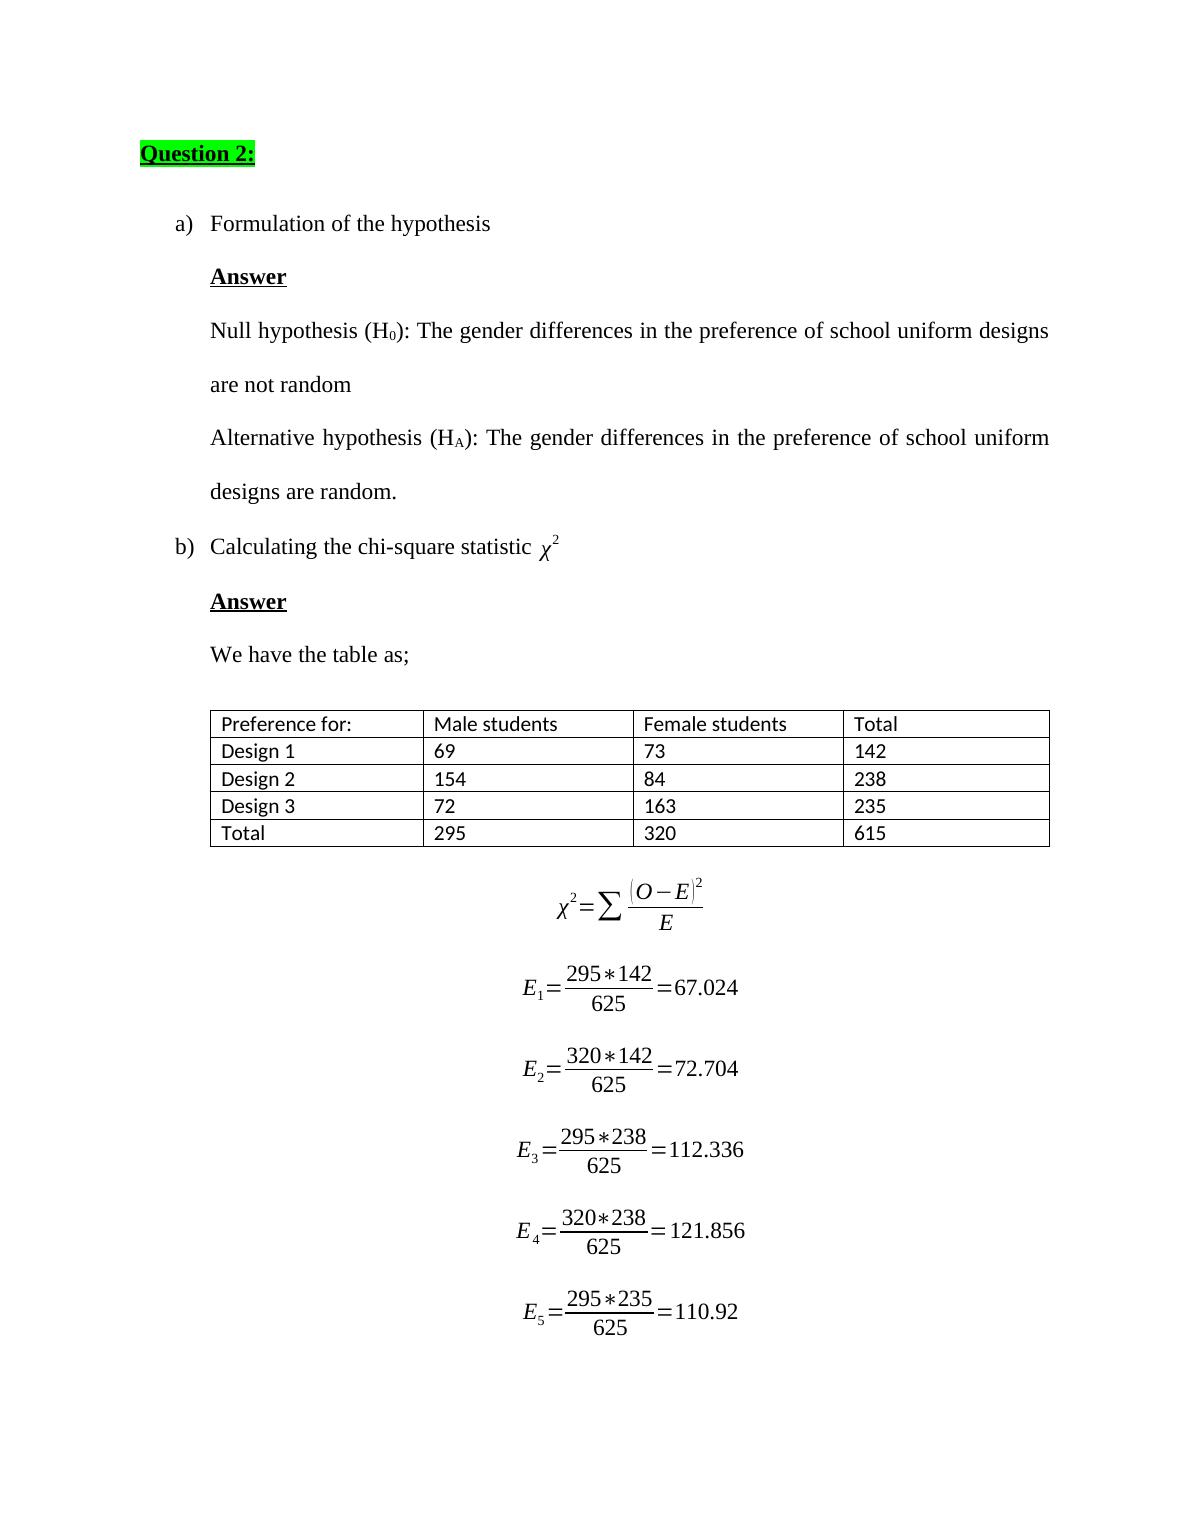
Question 2:
a) Formulation of the hypothesis
Answer
Null hypothesis (H0): The gender differences in the preference of school uniform designs
are not random
Alternative hypothesis (HA): The gender differences in the preference of school uniform
designs are random.
b) Calculating the chi-square statistic χ2
Answer
We have the table as;
Preference for: Male students Female students Total
Design 1 69 73 142
Design 2 154 84 238
Design 3 72 163 235
Total 295 320 615
χ2=∑ ( O−E )2
E
E1= 295∗142
625 =67.024
E2= 320∗142
625 =72.704
E3 =295∗238
625 =112.336
E4= 320∗238
625 =121.856
E5 =295∗235
625 =110.92
End of preview
Want to access all the pages? Upload your documents or become a member.