Analyzing Glebe Farm's Financial Ratios and Business Performance
VerifiedAdded on 2023/06/12
|9
|3028
|346
Report
AI Summary
This report provides a comprehensive financial analysis of Glebe Farm, focusing on the years 2020 and 2021. It calculates and interprets key financial ratios such as the gearing ratio, interest coverage ratio, quick ratio, inventory days, and receivable days. The analysis identifies trends, discusses the implications of changes in these metrics, and assesses the overall financial health of the company. Furthermore, it advises the financial director on the sufficiency of the financial statements for a bank loan application and highlights the limitations of financial record analysis. The report also addresses operational aspects, examining demand variability sources at Glebe Farm and evaluating capacity management options like chase demand, level capacity, and demand management.

OPEN BOOK EXAM
Paraphrase This Document
Need a fresh take? Get an instant paraphrase of this document with our AI Paraphraser
Contents
PART B...........................................................................................................................................3
Question 1....................................................................................................................................3
a) Define in relation with law of variability that rising variability always degrade the
performance of a delivery-based system. What are the sources of demand variability
applicable to Glebe farm and how they affect their related results?............................................3
b) Explain buffering mechanisms that are available for identified demand variabilities in Glebe
farm..............................................................................................................................................3
c) Examine which capacity option (chase demand, level capacity and demand management)
that could be and which cannot be an option in relation to reconcile capacity with demand
variation observed in Glebe farm................................................................................................4
d) What sort of factors must Glebe farm owner should consider while deciding the quantity of
flavours from 5-10.......................................................................................................................5
PART C: FINANCIAL MANAGEMENT......................................................................................6
Question 2....................................................................................................................................6
a) Calculate the following ratios for the years 2020 and 2021....................................................6
b) Comments should include whether each metric is improving or deteriorating versus prior
year and against the standard terms of business for the company if applicable. You should
identify the potential causes/implications of each change...........................................................7
C) You should give an overall opinion on the financial health of the company, based on your
analysis. Is there evidence that the company may not be a ‘going concern’?.............................9
D) Give advice to financial director whether financial statement is sufficient to apply for bank
loan and also describe the limitations of financial record analysis need to be considered:.........9
PART B
Question 1.
a) Define in relation with law of variability that rising variability always degrade the
performance of a delivery-based system. What are the sources of demand variability
applicable to Glebe farm and how they affect their related results?
Law of variability: It can be explained as a tool that helps to measure to what extent
demand would vary in associated business. It defines the difference between what one
expects to take place and what actually happens. There are many reasons that are
responsible for such variations and which contribute in degrading the functioning of a
system dealing in delivery as well. Sources of demand variability are described below:
Complexity: In Glebe farm case It can be justified as a complicated function that
takes in account whether what is being planned or predicted would give exact
results that are expected and thus what would be related measure that would help
to achieve such goals in area of ice cream and milking factory.
Uncertainty: It can be stated as a situation that is developed through force and
existence of external factors present in market and which would cause demand to
rise or fall unexpectedly. In Glebe farm area there are many local shops available
around that might attract consumer and thus is not necessary that the demand
would rise. In case of milking, it has to manage number of visitors and in case of
ice cream sales it has to increase number of flavours.
Volatility: It can be explained as a alternation and rapid change observed in rise of
unpredictable demand taking place in business related environment. In relation
with Glebe farm it is observed that the demand is expected to rise for certain
flavours that must be met by the business for smooth working and carrying out of
operations and for milking tour it must manage related space required for
increasing visitors.
b) Explain buffering mechanisms that are available for identified demand variabilities in Glebe
farm.
The variation in buffering recorded in delivery systems takes place because of mixtures of
inventory, capacity and time. The buffering here states the unpredictable increment or decrement
⊘ This is a preview!⊘
Do you want full access?
Subscribe today to unlock all pages.
Trusted by 1+ million students worldwide
in demand are related to goods that can be captivated by keeping a hold of buffer or new quantity
of commodity. There are various kind of buffering mechanism explained as below:
Time buffering: It simply relates to queue of the related consumers and the visitors as well. It
primarily takes place when there is a occasion or at the time of holiday. The batch size restricts a
limited number of 12 persons for viewing the milking process of cows that results in generation
of inventory and production of stock as well. It can be substituted if frequency rate of batch is
limited and number of visitor gets increased to a level of 80 persons which are able to see cow
milking for a duration of one hour. It would be fruitful for corporate as well as for consumer
would be attracted and visitor will also rise in number. This would result in occupying 100%
capacity of visitors.
Capacity buffering: It hangs on buffering of inventory variation and as the decision expects to
generate more capacity of goods that depends on batch area which must be manufactured in a
larger quantity. The variability in quantity is related to buffering of inventory that states to ignore
capacity buffering, inventory should be at a reducing rate.
Inventory buffering: In area of Glebe farm, the buffering of inventory can be buffered with the
help of delivering raw material that must be processed so that demand of farm related products
could be matched. It can be achieved with the help of variation in internal result of work- in
progress of commodities. Capacity of inventory buffering can be predicted the reason being as
the material and production level can be carried out smoothly only if the required capacity is
met. From the given case study, it can be said that inventory buffering can be reduced by
possessing large amount of raw material and expecting that the number of customers during
holidays will increase according to required capacity and time set.
c) Examine which capacity option (chase demand, level capacity and demand management) that
could be and which cannot be an option in relation to reconcile capacity with demand
variation observed in Glebe farm.
Chase demand: It explains where the capacity is required to be adjusted according to
variation observed in demand cycle. It is useful mainly in service-related industries such
as construction or tourism. Thus, in case of Glebe farm products such as ice cream and
milk factories it is not a beneficial option that can be considered.
Level capacity: It is described as a situation where the decision maker has to decide ways
to meet requirements of consumers at the time of peak durations. Applying it in situation
Paraphrase This Document
Need a fresh take? Get an instant paraphrase of this document with our AI Paraphraser
of Glebe farm it would prove to be fruitful as Gill has to manage visitor place of 80 in
peak hours at peak days and produce more number of flavours for expected rise in scale
of consumers & to increase profit, sale. Thus, it can be considered as an better option that
would help in reconciling capacity in relation with demand variation. It would help to
engage more customers in other areas as well and attract them for increasing profitability
of the business.
Demand management: It is helpful where the demand deals in seasonal products such as
ice cream flavours being produced in Glebe farm that would help to manage demand &
balance its associated customers. Whereas in case of Milking area Gill is expected to
make best use of available resources and manage increasing visitors in peak hours for the
milking tour. It would be helpful in long run and to better fulfil unpredictable needs and
expectations of consumers. Demand can be managed by proper planning and production
in the factory and making best use of available resources.
d) What sort of factors must Glebe farm owner should consider while deciding the quantity of
flavours from 5-10.
While raising the quantity of ice cream flavour for promoting sale is a good idea, the amount
of every flavour to be created is uncertain, and also if or not is of comparable amounts related to
all varieties must be produced. For that concern Glebe farm must understand buying patterns of
customers and how they can be met if an unexpected rise is observed. If in the near future any
new demand for a related product seems to rise and which is not available with them to be
offered to customer it would lead to dissatisfaction and bad impact. It is possible that Glebe farm
records more amount of losses if it produces flavours that are not frequently demanded and are
produced more in quantity. Another hurdle that might affect the farm is whether they have
enough workforce for production and enough funds for carrying out increased operations.
Finally, it can be said that if the demand does not increase, it won’t improve sales and profits will
not rise and inventory might go wasted for a longer duration. Hence, it is necessary for Glebe
farm to plan and handle the idea to increase the quantity of variety carefully that requires only
the investment of ingredients flavoured and no increased staff. It would be helpful if farm
focuses more on making best use of available resources and funds & not increase expense of
carrying out additional operations.
PART C: FINANCIAL MANAGEMENT
Question 2
a) Calculate the following ratios for the years 2020 and 2021.
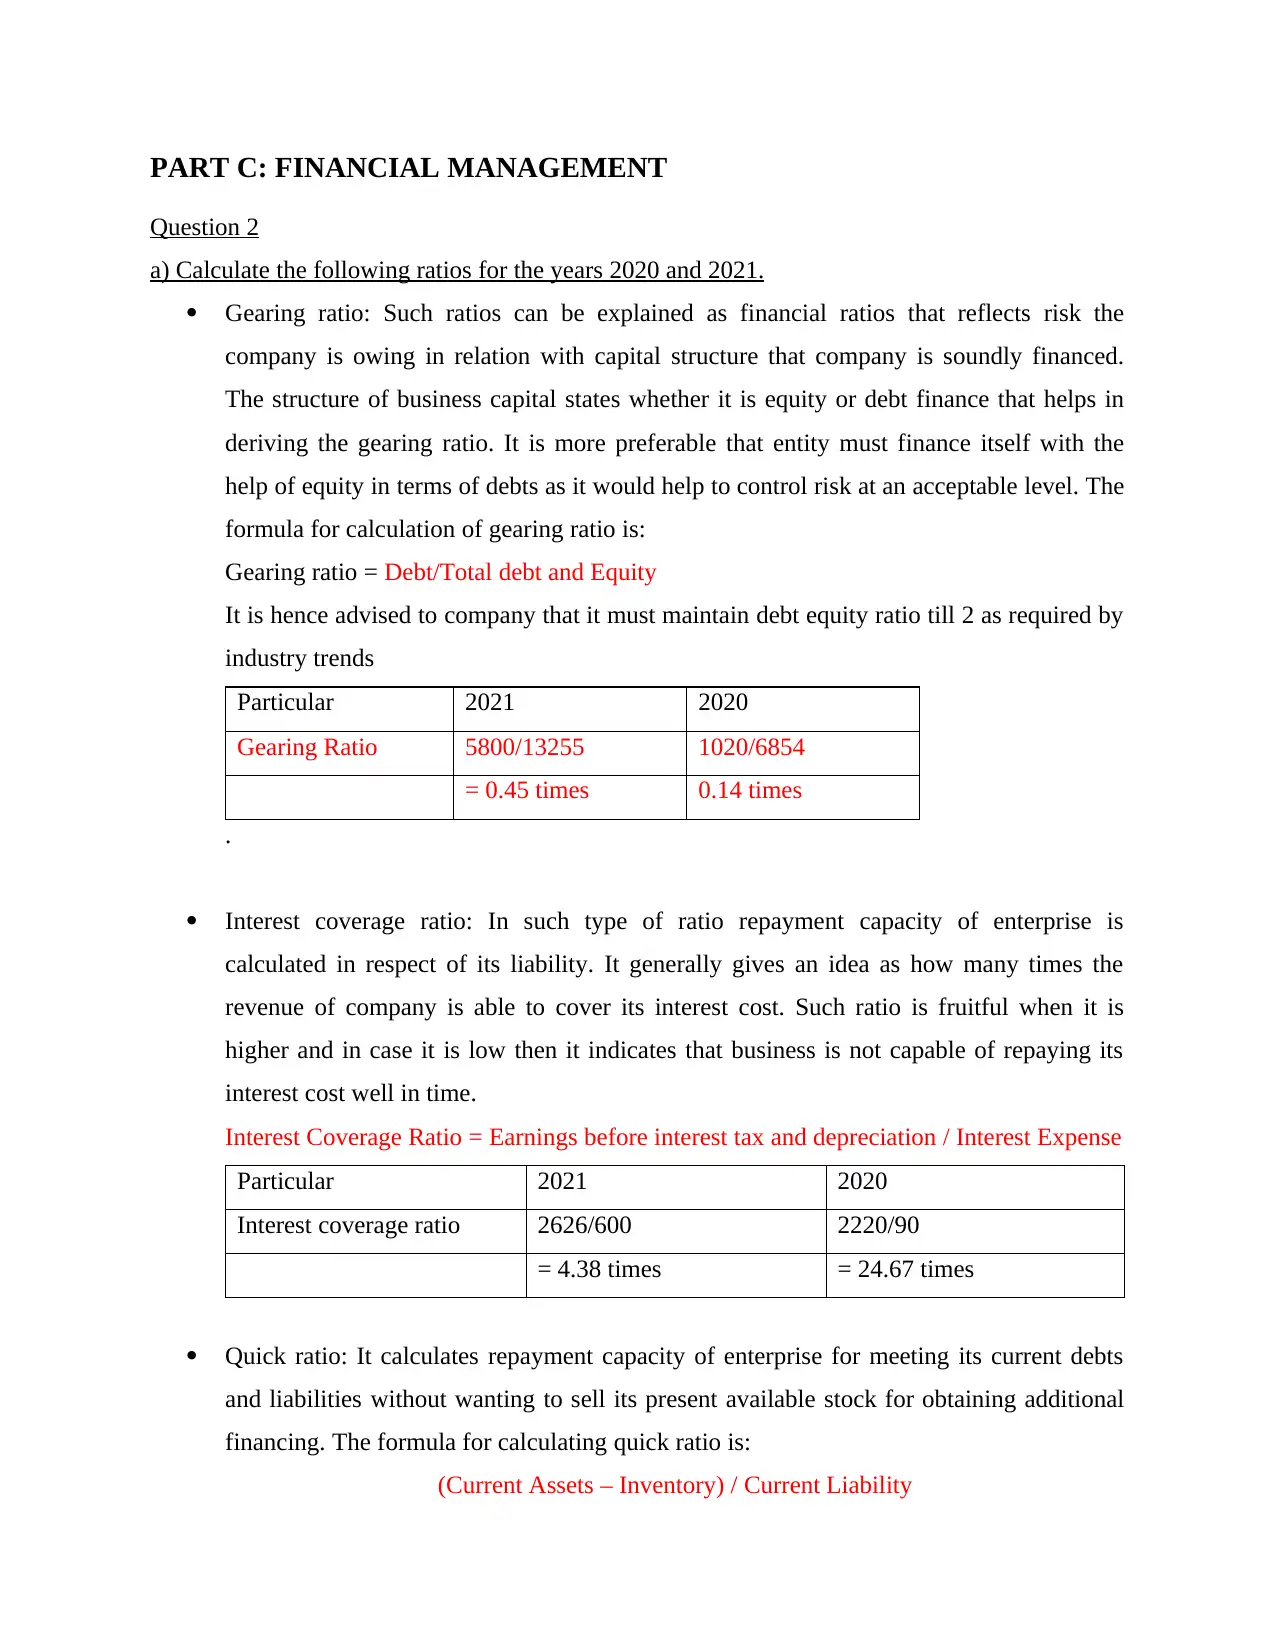
Gearing ratio: Such ratios can be explained as financial ratios that reflects risk the
company is owing in relation with capital structure that company is soundly financed.
The structure of business capital states whether it is equity or debt finance that helps in
deriving the gearing ratio. It is more preferable that entity must finance itself with the
help of equity in terms of debts as it would help to control risk at an acceptable level. The
formula for calculation of gearing ratio is:
Gearing ratio = Debt/Total debt and Equity
It is hence advised to company that it must maintain debt equity ratio till 2 as required by
industry trends
Particular 2021 2020
Gearing Ratio 5800/13255 1020/6854
= 0.45 times 0.14 times
.
Interest coverage ratio: In such type of ratio repayment capacity of enterprise is
calculated in respect of its liability. It generally gives an idea as how many times the
revenue of company is able to cover its interest cost. Such ratio is fruitful when it is
higher and in case it is low then it indicates that business is not capable of repaying its
interest cost well in time.
Interest Coverage Ratio = Earnings before interest tax and depreciation / Interest Expense
Particular 2021 2020
Interest coverage ratio 2626/600 2220/90
= 4.38 times = 24.67 times
Quick ratio: It calculates repayment capacity of enterprise for meeting its current debts
and liabilities without wanting to sell its present available stock for obtaining additional
financing. The formula for calculating quick ratio is:
(Current Assets – Inventory) / Current Liability
Question 2
a) Calculate the following ratios for the years 2020 and 2021.
Gearing ratio: Such ratios can be explained as financial ratios that reflects risk the
company is owing in relation with capital structure that company is soundly financed.
The structure of business capital states whether it is equity or debt finance that helps in
deriving the gearing ratio. It is more preferable that entity must finance itself with the
help of equity in terms of debts as it would help to control risk at an acceptable level. The
formula for calculation of gearing ratio is:
Gearing ratio = Debt/Total debt and Equity
It is hence advised to company that it must maintain debt equity ratio till 2 as required by
industry trends
Particular 2021 2020
Gearing Ratio 5800/13255 1020/6854
= 0.45 times 0.14 times
.
Interest coverage ratio: In such type of ratio repayment capacity of enterprise is
calculated in respect of its liability. It generally gives an idea as how many times the
revenue of company is able to cover its interest cost. Such ratio is fruitful when it is
higher and in case it is low then it indicates that business is not capable of repaying its
interest cost well in time.
Interest Coverage Ratio = Earnings before interest tax and depreciation / Interest Expense
Particular 2021 2020
Interest coverage ratio 2626/600 2220/90
= 4.38 times = 24.67 times
Quick ratio: It calculates repayment capacity of enterprise for meeting its current debts
and liabilities without wanting to sell its present available stock for obtaining additional
financing. The formula for calculating quick ratio is:
(Current Assets – Inventory) / Current Liability
⊘ This is a preview!⊘
Do you want full access?
Subscribe today to unlock all pages.
Trusted by 1+ million students worldwide
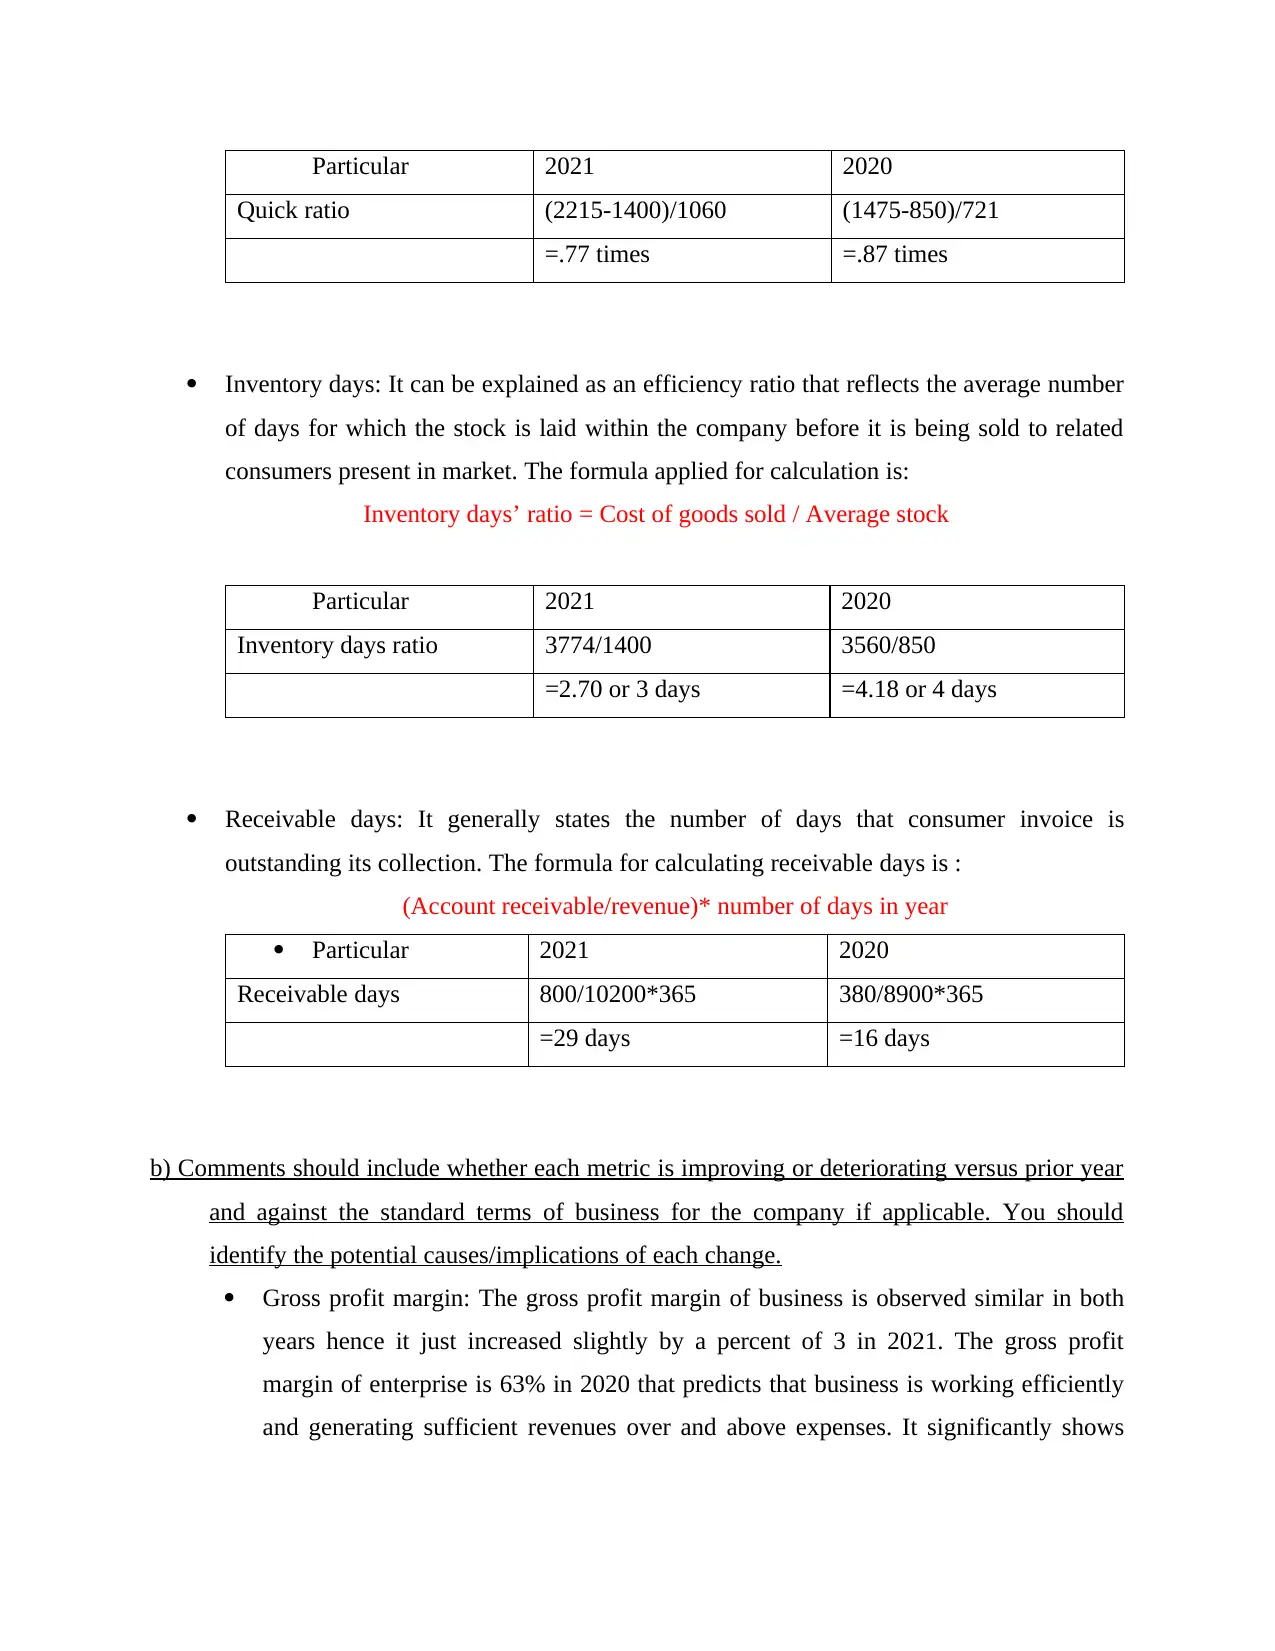
Particular 2021 2020
Quick ratio (2215-1400)/1060 (1475-850)/721
=.77 times =.87 times
Inventory days: It can be explained as an efficiency ratio that reflects the average number
of days for which the stock is laid within the company before it is being sold to related
consumers present in market. The formula applied for calculation is:
Inventory days’ ratio = Cost of goods sold / Average stock
Particular 2021 2020
Inventory days ratio 3774/1400 3560/850
=2.70 or 3 days =4.18 or 4 days
Receivable days: It generally states the number of days that consumer invoice is
outstanding its collection. The formula for calculating receivable days is :
(Account receivable/revenue)* number of days in year
Particular 2021 2020
Receivable days 800/10200*365 380/8900*365
=29 days =16 days
b) Comments should include whether each metric is improving or deteriorating versus prior year
and against the standard terms of business for the company if applicable. You should
identify the potential causes/implications of each change.
Gross profit margin: The gross profit margin of business is observed similar in both
years hence it just increased slightly by a percent of 3 in 2021. The gross profit
margin of enterprise is 63% in 2020 that predicts that business is working efficiently
and generating sufficient revenues over and above expenses. It significantly shows
Paraphrase This Document
Need a fresh take? Get an instant paraphrase of this document with our AI Paraphraser
that is company sells product at 100 then the margin is 60 on such goods that is
outstanding and further such percent will prove to be good in terms of development.
Operating profit margin: The operating profit margin of company is 25.70% and
24.90% for respective year as 2021 and 2020 that explains that entity is utilising its
related resources on efficient and effective grounds. It is also seen that they are
earning adequate profits which is filling their pockets. Further the margin of 25% is
good as it states that they are able to convert their sales volume in actual profits and
there can be a rise recorded which shows the growth and expansion of business &
also serve as a competitive advantage over others already present in market.
Return on capital employed: The return on capital employed of entity is 19.81% and
32.39% respected in 2021 and 2020 that shows the negative performance of business
when compared to previous year performance. The lesser return on capital indicates
that the firm is not able to generate adequate revenues for their invested amount that
would affect the market cap adversely and it must be improved.
Operating cash cycle ratio: It generally indicates the alteration in days when an
business purchase commodities and sell them to clients after certain processing on
them. The cash operating cycle in 2021 is observed to be higher when compared to
previous year by a amount of 30 days that is adverse for the business as the fund are
seen to be blocked for more than 30 days and it impacts the working capital and cash
flow record of company as well. The higher the cycle is not better for business and it
would also harm the liquidity as well.
Gearing ratio: The debt and equity ratio is under 2 in both year that is good and
fruitful for the corporates as they do not have much burden over them. However,
there is an increase observed in gearing ratio when compared to previous year but the
entity is expected to work on it for maintaining it up to 2 and not exceeding it more
than that.
Interest coverage ratio: The interest coverage ratio of entity is 4.38 recorded for
current year that is far behind when compared to year 2020 which is 24.67 times that
shows that entity does not provide proper coverage to their debt holder for current
year. Such ratios are considered good if they are higher but for present year it proves
to be adverse and proper monitoring is required by corporates.
Quick Ratio: In 2021 and 2020, the company quick ratio will be 0.77 and 0.87 times,
respectively, implying essentially identical profitability in both years. If it is less than
working capital, it simply signifies that assets are not dependent on stocks and that
the company is spending its spare money in more income-generating sources.
Inventory Ratio: Businesses should keep their inventory as low as possible. It
basically means that the company will transfer its shares on a regular basis. In the
example above, inventory turnover is 3 and 4, which is advantageous to the entity's
welfare and therefore should be kept as low as reasonably achievable.
Receivable Days: The trade receivables in 2021 and 2020 are 29 and 16, respectively,
showing that revenues received by the firm are taking longer this year, impacting its
liquid assets in comparison to previous years, which must be addressed given the
company's prior performance.
C) You should give an overall opinion on the financial health of the company, based on your
analysis. Is there evidence that the company may not be a ‘going concern’?
The health of the company can be predicted better and sound that can be improved because
from the analysis of above defined ratios the gearing ratio can be said to be under control that
simply indicates that company does not have enough liability and debt the reason being they are
sound and have equity finance on a large scale. Further, the profitability and liquidity of
corporates can be seen improving and in a good manner that helps to understand that company at
given point of time is working well.
D) Give advice to financial director whether financial statement is sufficient to apply for bank
loan and also describe the limitations of financial record analysis need to be considered:
From the above analysis of profitability and examining performance of organisation it
can be said that entity can easily apply and receive loan amount from banks/ financial
institutions. The reason behind is that their gearing and liquidity ratio are in enough amount for
processing of loan. The limitation of financial statements is:
It is prepared on historical cost basis and exact value cannot be calculated.
It ignores the effect of all non-monetary related aspects.
They do not give any correct positioning of business in market point of view.
⊘ This is a preview!⊘
Do you want full access?
Subscribe today to unlock all pages.
Trusted by 1+ million students worldwide
1 out of 9

Your All-in-One AI-Powered Toolkit for Academic Success.
+13062052269
info@desklib.com
Available 24*7 on WhatsApp / Email
![[object Object]](/_next/static/media/star-bottom.7253800d.svg)
Unlock your academic potential
Copyright © 2020–2026 A2Z Services. All Rights Reserved. Developed and managed by ZUCOL.