B21365 Operations Management: Recycling Centre Corporation Case Study
VerifiedAdded on 2023/01/10
|15
|5468
|61
Case Study
AI Summary
This case study analyzes the operations of Recycling Centre Corporation (RCC), a commodity processing and trading company facing challenges in achieving profitability. The analysis includes calculating the capacity of the heavy-duty shredder, break-even calculations, and customer mapping to identify inbound and outbound clients (municipalities, construction companies, scrap traders, and manufacturers). It also examines operational issues such as waiting times and proposes solutions. Furthermore, the study considers strategic direction using the Ansoff matrix and discusses management decisions to improve RCC's performance, focusing on waste management, environmental awareness, and recycling strategies. The assignment aims to provide a strategic operational analysis of RCC for the Board, covering key aspects of operations management to address the company's challenges.

Operations Management
B21365
B21365
Paraphrase This Document
Need a fresh take? Get an instant paraphrase of this document with our AI Paraphraser
Table of Contents
INTRODUCTION...........................................................................................................................1
CAPACITY ANALYSIS AND BREAK-EVEN CALCULATIONS.............................................1
CUSTOMER MAPPING.................................................................................................................3
OPERATIONS ANALYSIS............................................................................................................6
STRATEGIC DIRECTION.............................................................................................................7
MANAGEMENT DECISIONS.......................................................................................................9
CONCLUSION..............................................................................................................................10
REFERENCES..............................................................................................................................12
INTRODUCTION
Operations management can be defined as the process of supervising, organising and
planning to make improvements and enhance profitability of the entity (Operations
management, 2019). All the managers in the companies are responsible to make sure that
they are able to control, evaluate, monitor and assess the progress of business as it is required
to assure success of all the projects. While planning to make sure that the plans that are
formulated for betterment of entity will be able to result positively or negatively it is essential
to pay attention towards the concept of operations management (Babich and Hilary, 2020). It
can help to analyse the key factors that should be focused to attain success and learn from it.
In other words, it could be defined as the administration of such practices that can help to
create highest level of efficiency for the organisation. Main aim of this report is to understand
the importance of it for an entity which is planning to grow its business. This assignment is
based upon the case of a Recycling Centre Corporation. This project covers various topics
such as capacity analysis and calculation of break-even for the organisation, customer
mapping for inbound and outbound clients, operations analysis etc. Apart from this, Ansoff
matrix for the purpose of identifying best strategic directions along with management
decisions is also covered in this assignment.
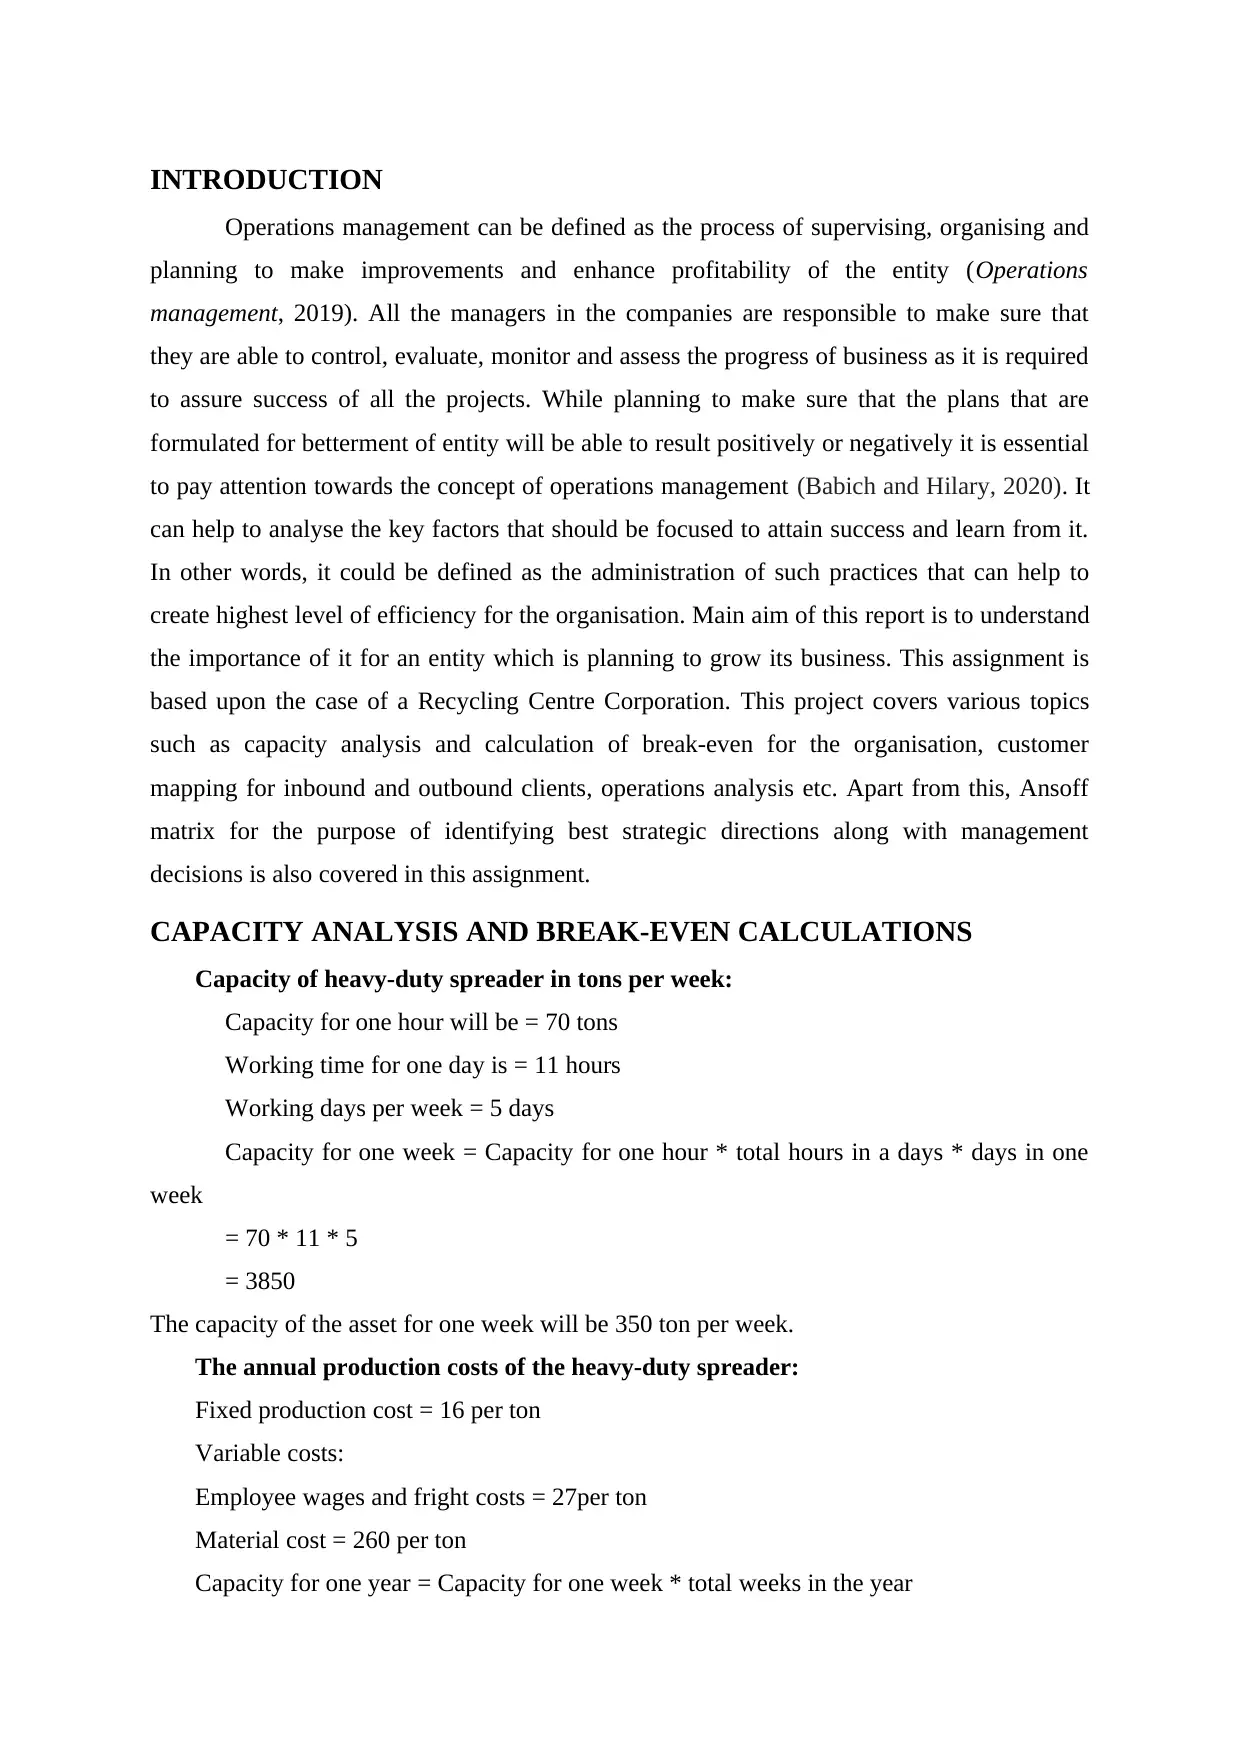
CAPACITY ANALYSIS AND BREAK-EVEN CALCULATIONS
Capacity of heavy-duty spreader in tons per week:
Capacity for one hour will be = 70 tons
Working time for one day is = 11 hours
Working days per week = 5 days
Capacity for one week = Capacity for one hour * total hours in a days * days in one
week
= 70 * 11 * 5
= 3850
The capacity of the asset for one week will be 350 ton per week.
The annual production costs of the heavy-duty spreader:
Fixed production cost = 16 per ton
Variable costs:
Employee wages and fright costs = 27per ton
Material cost = 260 per ton
Capacity for one year = Capacity for one week * total weeks in the year
Operations management can be defined as the process of supervising, organising and
planning to make improvements and enhance profitability of the entity (Operations
management, 2019). All the managers in the companies are responsible to make sure that
they are able to control, evaluate, monitor and assess the progress of business as it is required
to assure success of all the projects. While planning to make sure that the plans that are
formulated for betterment of entity will be able to result positively or negatively it is essential
to pay attention towards the concept of operations management (Babich and Hilary, 2020). It
can help to analyse the key factors that should be focused to attain success and learn from it.
In other words, it could be defined as the administration of such practices that can help to
create highest level of efficiency for the organisation. Main aim of this report is to understand
the importance of it for an entity which is planning to grow its business. This assignment is
based upon the case of a Recycling Centre Corporation. This project covers various topics
such as capacity analysis and calculation of break-even for the organisation, customer
mapping for inbound and outbound clients, operations analysis etc. Apart from this, Ansoff
matrix for the purpose of identifying best strategic directions along with management
decisions is also covered in this assignment.
CAPACITY ANALYSIS AND BREAK-EVEN CALCULATIONS
Capacity of heavy-duty spreader in tons per week:
Capacity for one hour will be = 70 tons
Working time for one day is = 11 hours
Working days per week = 5 days
Capacity for one week = Capacity for one hour * total hours in a days * days in one
week
= 70 * 11 * 5
= 3850
The capacity of the asset for one week will be 350 ton per week.
The annual production costs of the heavy-duty spreader:
Fixed production cost = 16 per ton
Variable costs:
Employee wages and fright costs = 27per ton
Material cost = 260 per ton
Capacity for one year = Capacity for one week * total weeks in the year
⊘ This is a preview!⊘
Do you want full access?
Subscribe today to unlock all pages.
Trusted by 1+ million students worldwide
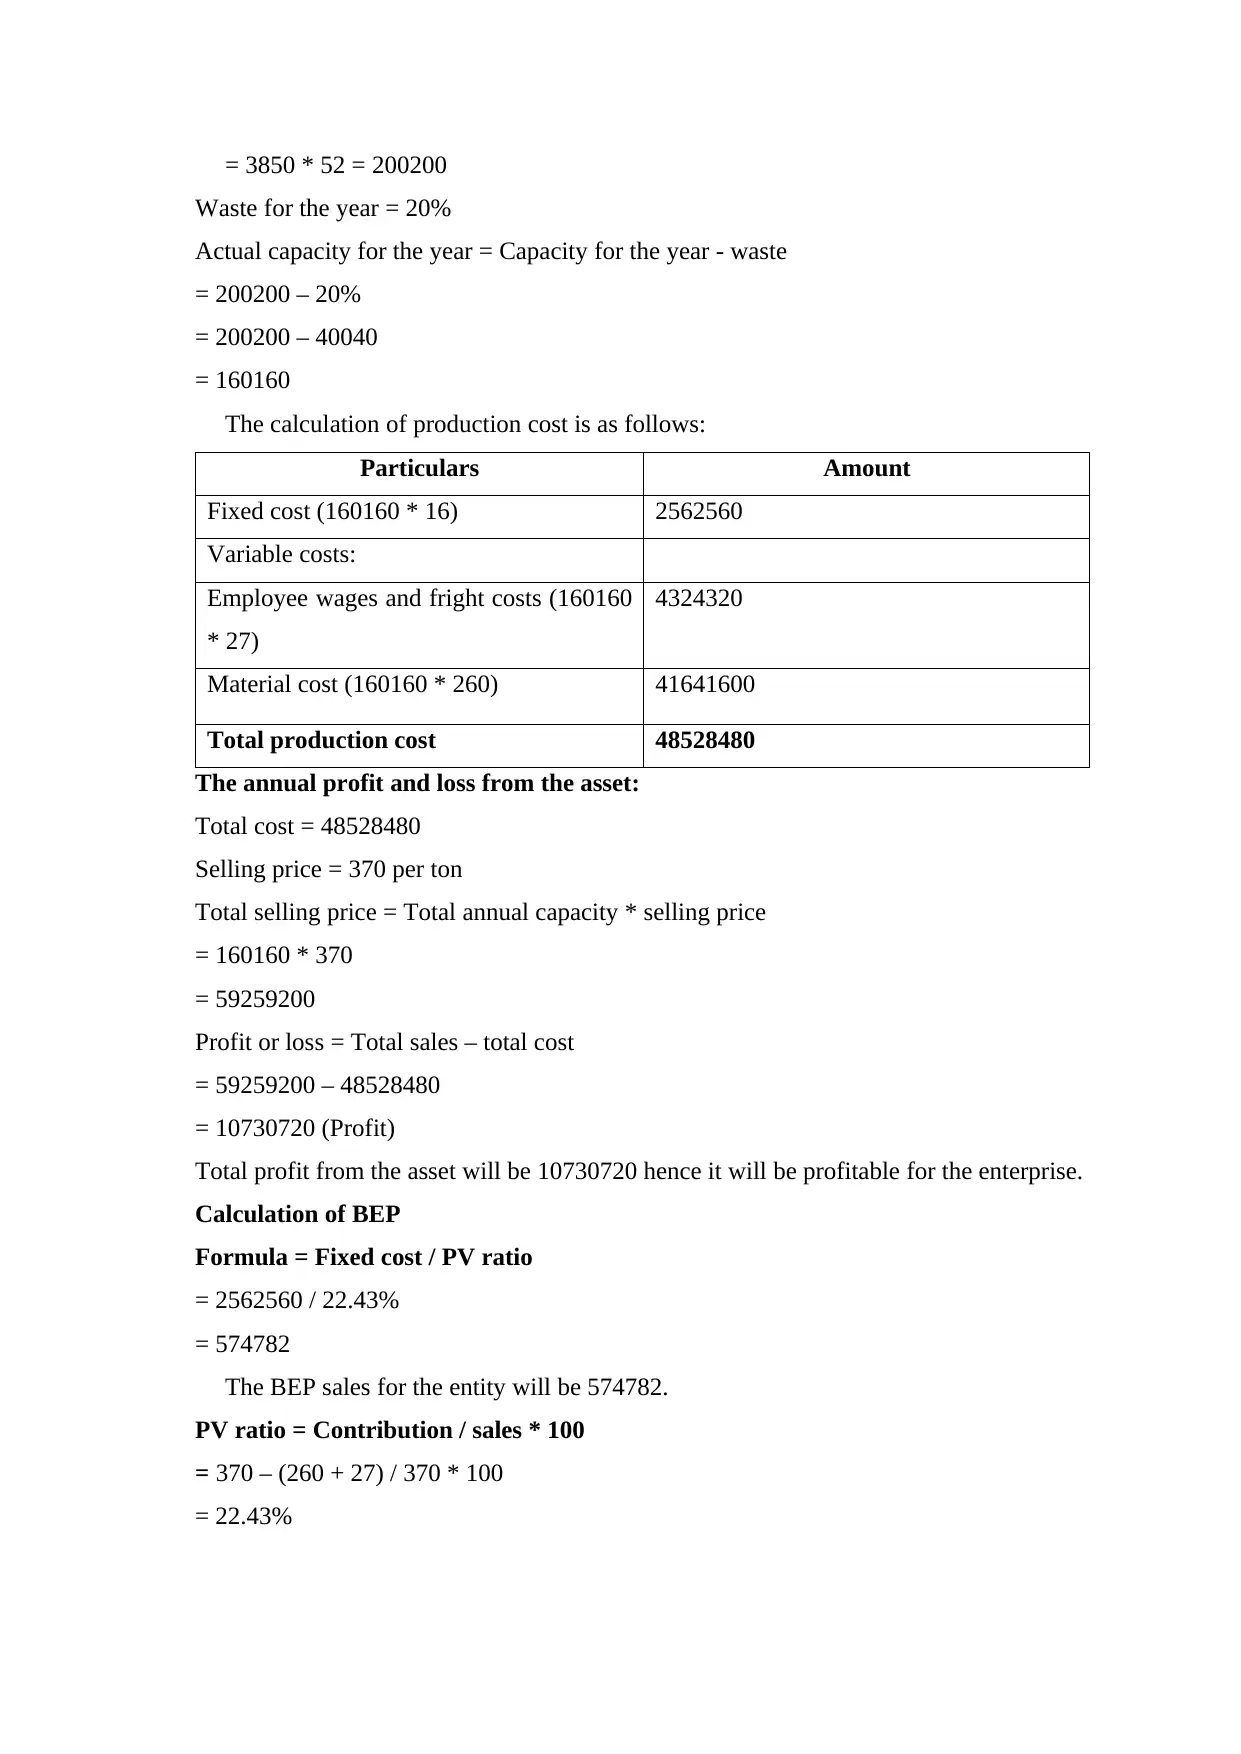
= 3850 * 52 = 200200
Waste for the year = 20%
Actual capacity for the year = Capacity for the year - waste
= 200200 – 20%
= 200200 – 40040
= 160160
The calculation of production cost is as follows:
Particulars Amount
Fixed cost (160160 * 16) 2562560
Variable costs:
Employee wages and fright costs (160160
* 27)
4324320
Material cost (160160 * 260) 41641600
Total production cost 48528480
The annual profit and loss from the asset:
Total cost = 48528480
Selling price = 370 per ton
Total selling price = Total annual capacity * selling price
= 160160 * 370
= 59259200
Profit or loss = Total sales – total cost
= 59259200 – 48528480
= 10730720 (Profit)
Total profit from the asset will be 10730720 hence it will be profitable for the enterprise.
Calculation of BEP
Formula = Fixed cost / PV ratio
= 2562560 / 22.43%
= 574782
The BEP sales for the entity will be 574782.
PV ratio = Contribution / sales * 100
= 370 – (260 + 27) / 370 * 100
= 22.43%
Paraphrase This Document
Need a fresh take? Get an instant paraphrase of this document with our AI Paraphraser
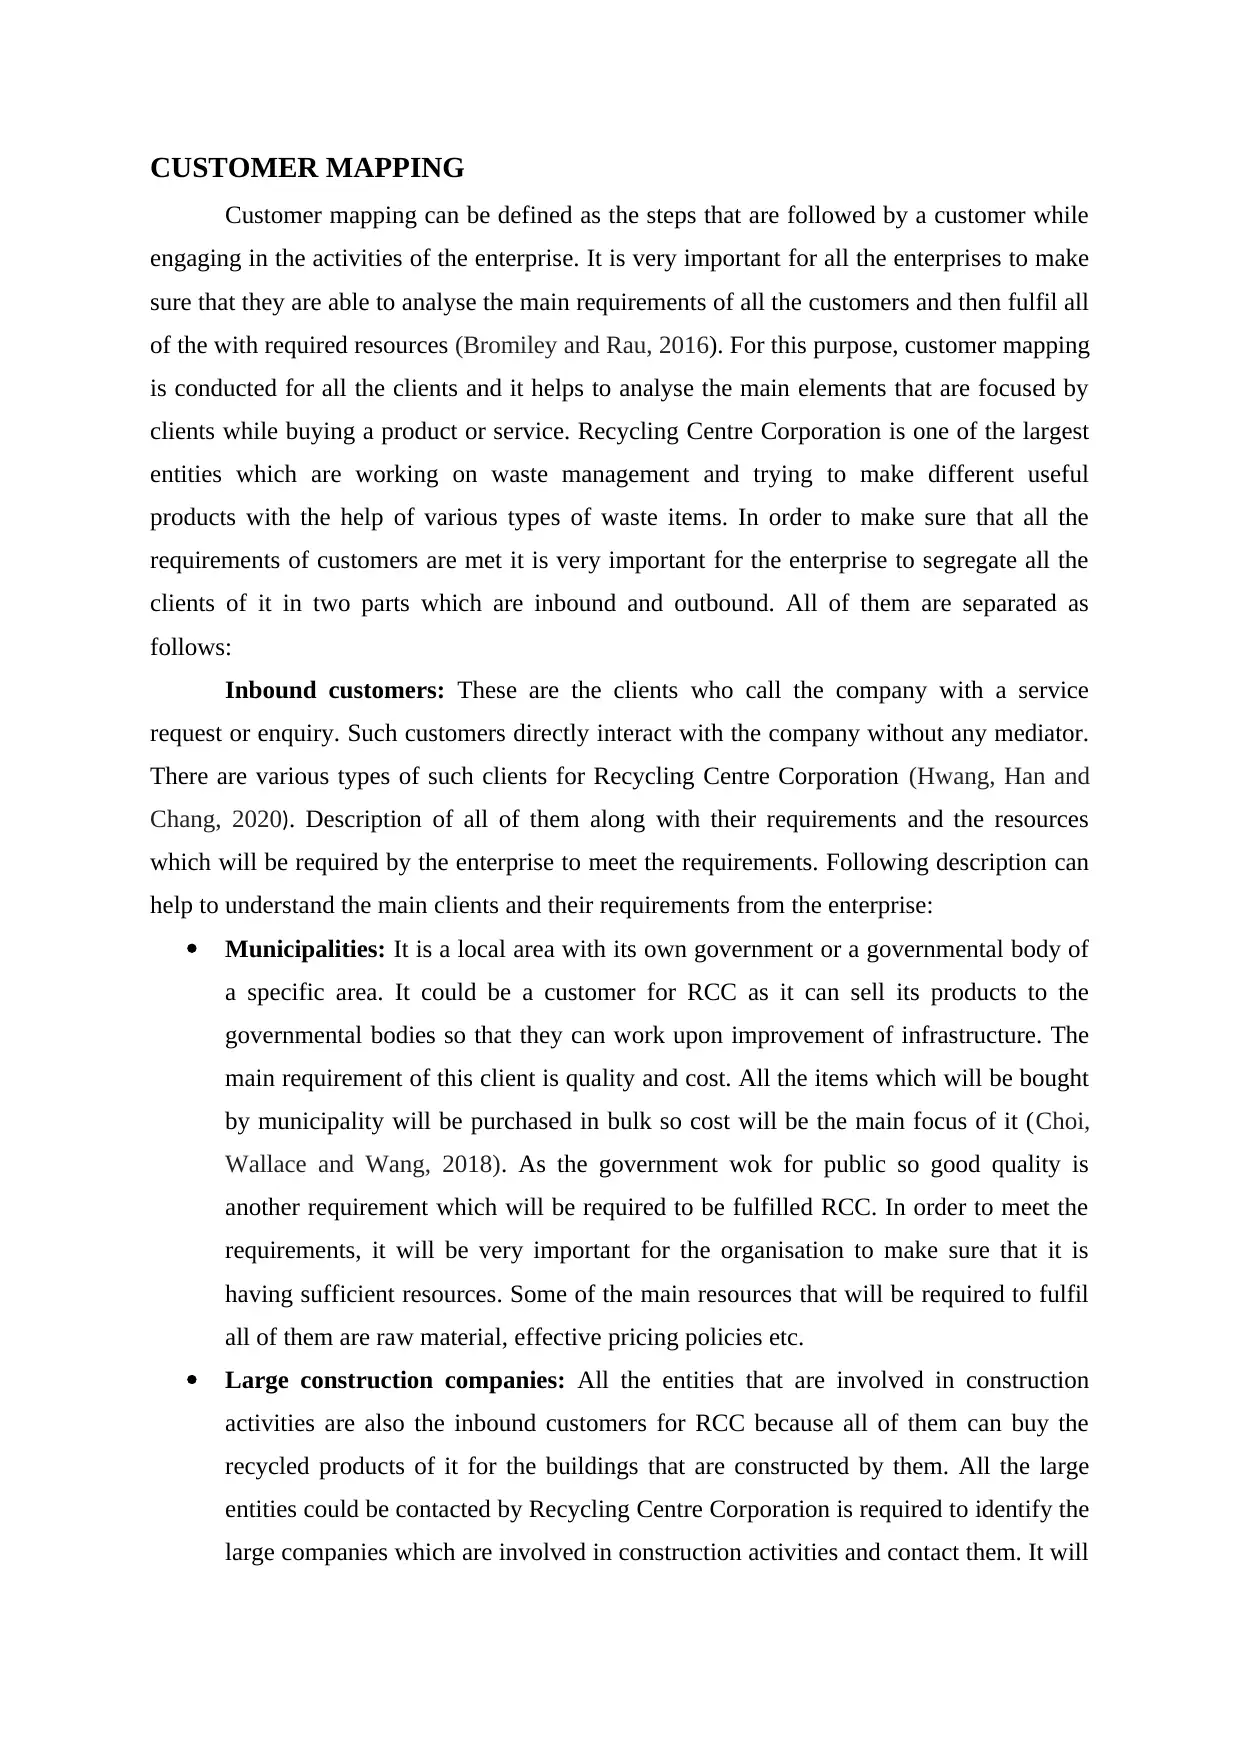
CUSTOMER MAPPING
Customer mapping can be defined as the steps that are followed by a customer while
engaging in the activities of the enterprise. It is very important for all the enterprises to make
sure that they are able to analyse the main requirements of all the customers and then fulfil all
of the with required resources (Bromiley and Rau, 2016). For this purpose, customer mapping
is conducted for all the clients and it helps to analyse the main elements that are focused by
clients while buying a product or service. Recycling Centre Corporation is one of the largest
entities which are working on waste management and trying to make different useful
products with the help of various types of waste items. In order to make sure that all the
requirements of customers are met it is very important for the enterprise to segregate all the
clients of it in two parts which are inbound and outbound. All of them are separated as
follows:
Inbound customers: These are the clients who call the company with a service
request or enquiry. Such customers directly interact with the company without any mediator.
There are various types of such clients for Recycling Centre Corporation (Hwang, Han and
Chang, 2020). Description of all of them along with their requirements and the resources
which will be required by the enterprise to meet the requirements. Following description can
help to understand the main clients and their requirements from the enterprise:
Municipalities: It is a local area with its own government or a governmental body of
a specific area. It could be a customer for RCC as it can sell its products to the
governmental bodies so that they can work upon improvement of infrastructure. The
main requirement of this client is quality and cost. All the items which will be bought
by municipality will be purchased in bulk so cost will be the main focus of it (Choi,
Wallace and Wang, 2018). As the government wok for public so good quality is
another requirement which will be required to be fulfilled RCC. In order to meet the
requirements, it will be very important for the organisation to make sure that it is
having sufficient resources. Some of the main resources that will be required to fulfil
all of them are raw material, effective pricing policies etc.
Large construction companies: All the entities that are involved in construction
activities are also the inbound customers for RCC because all of them can buy the
recycled products of it for the buildings that are constructed by them. All the large
entities could be contacted by Recycling Centre Corporation is required to identify the
large companies which are involved in construction activities and contact them. It will
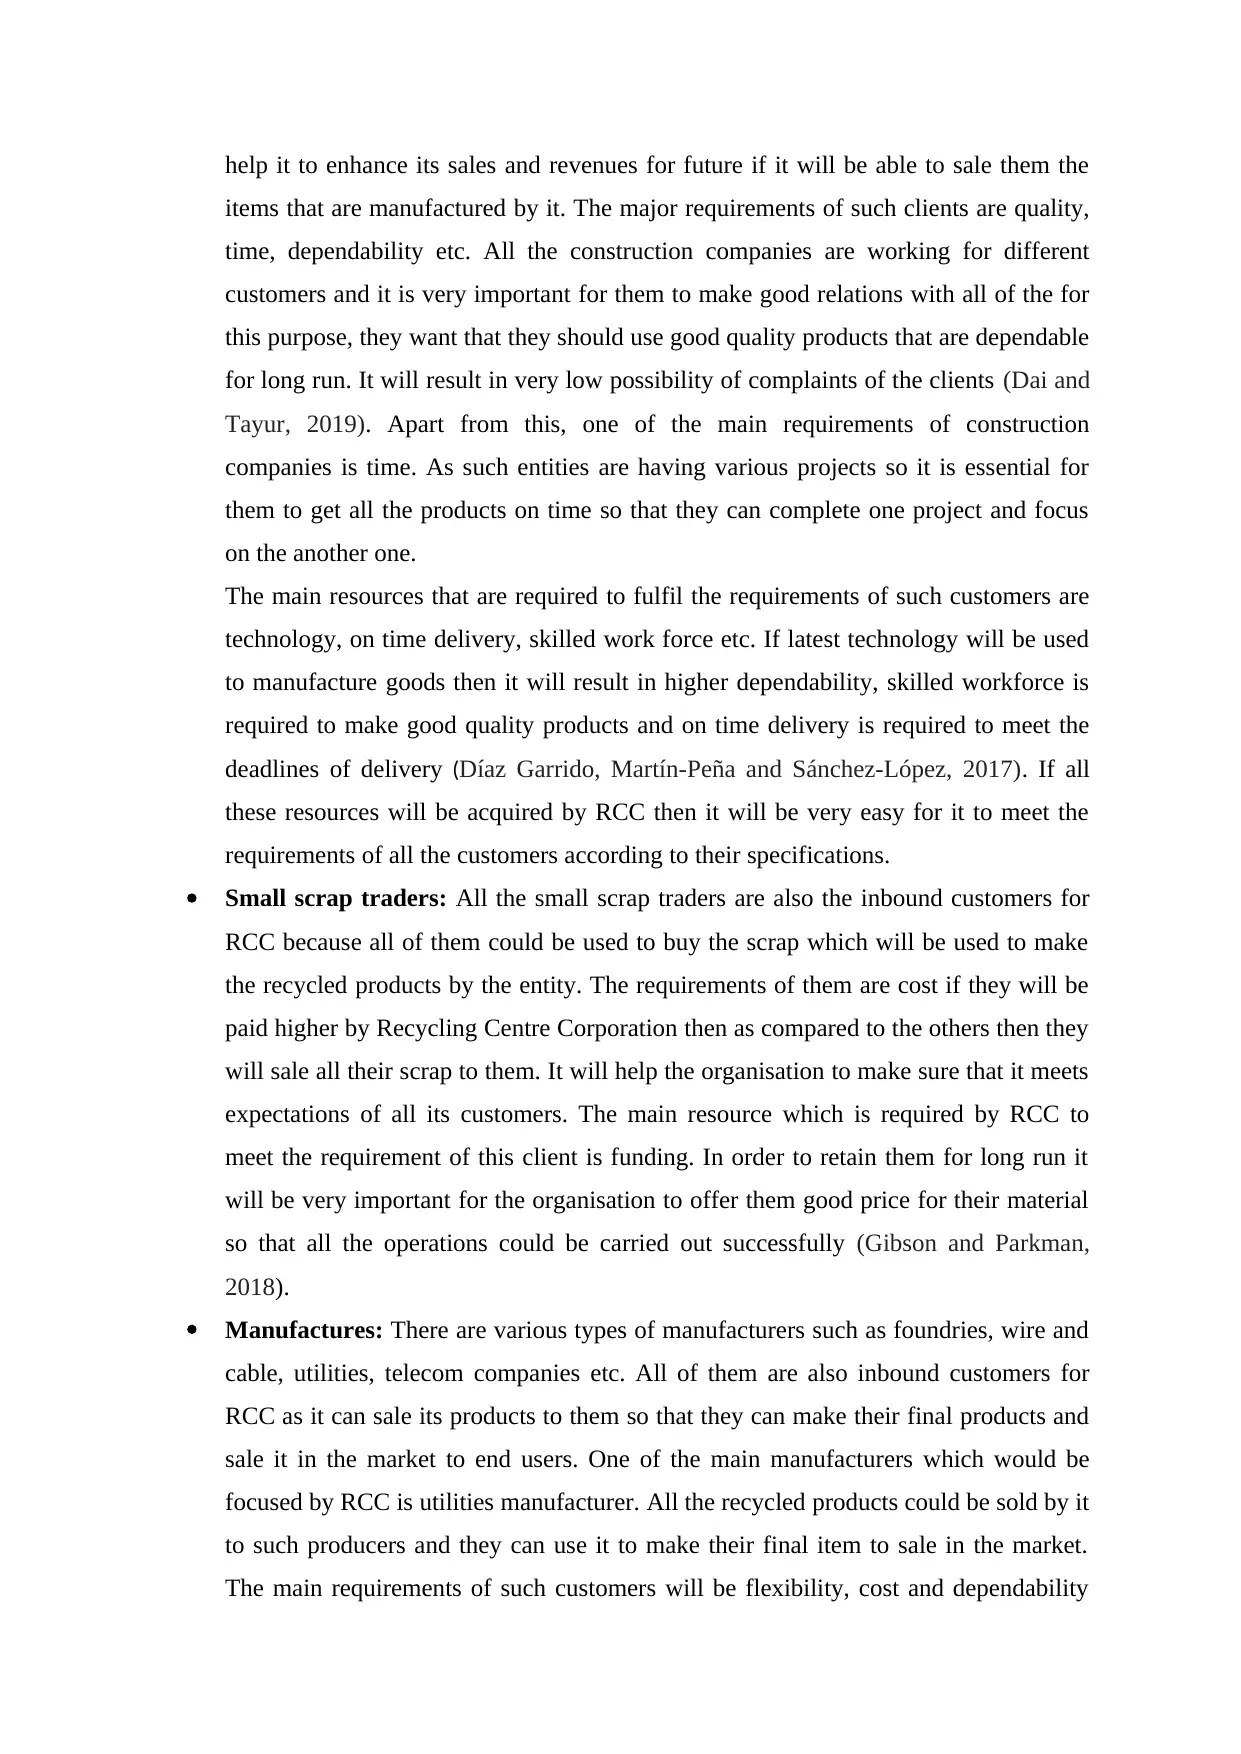
help it to enhance its sales and revenues for future if it will be able to sale them the
items that are manufactured by it. The major requirements of such clients are quality,
time, dependability etc. All the construction companies are working for different
customers and it is very important for them to make good relations with all of the for
this purpose, they want that they should use good quality products that are dependable
for long run. It will result in very low possibility of complaints of the clients (Dai and
Tayur, 2019). Apart from this, one of the main requirements of construction
companies is time. As such entities are having various projects so it is essential for
them to get all the products on time so that they can complete one project and focus
on the another one.
The main resources that are required to fulfil the requirements of such customers are
technology, on time delivery, skilled work force etc. If latest technology will be used
to manufacture goods then it will result in higher dependability, skilled workforce is
required to make good quality products and on time delivery is required to meet the
deadlines of delivery (Díaz Garrido, Martín-Peña and Sánchez-López, 2017). If all
these resources will be acquired by RCC then it will be very easy for it to meet the
requirements of all the customers according to their specifications.
Small scrap traders: All the small scrap traders are also the inbound customers for
RCC because all of them could be used to buy the scrap which will be used to make
the recycled products by the entity. The requirements of them are cost if they will be
paid higher by Recycling Centre Corporation then as compared to the others then they
will sale all their scrap to them. It will help the organisation to make sure that it meets
expectations of all its customers. The main resource which is required by RCC to
meet the requirement of this client is funding. In order to retain them for long run it
will be very important for the organisation to offer them good price for their material
so that all the operations could be carried out successfully (Gibson and Parkman,
2018).
Manufactures: There are various types of manufacturers such as foundries, wire and
cable, utilities, telecom companies etc. All of them are also inbound customers for
RCC as it can sale its products to them so that they can make their final products and
sale it in the market to end users. One of the main manufacturers which would be
focused by RCC is utilities manufacturer. All the recycled products could be sold by it
to such producers and they can use it to make their final item to sale in the market.
The main requirements of such customers will be flexibility, cost and dependability
⊘ This is a preview!⊘
Do you want full access?
Subscribe today to unlock all pages.
Trusted by 1+ million students worldwide
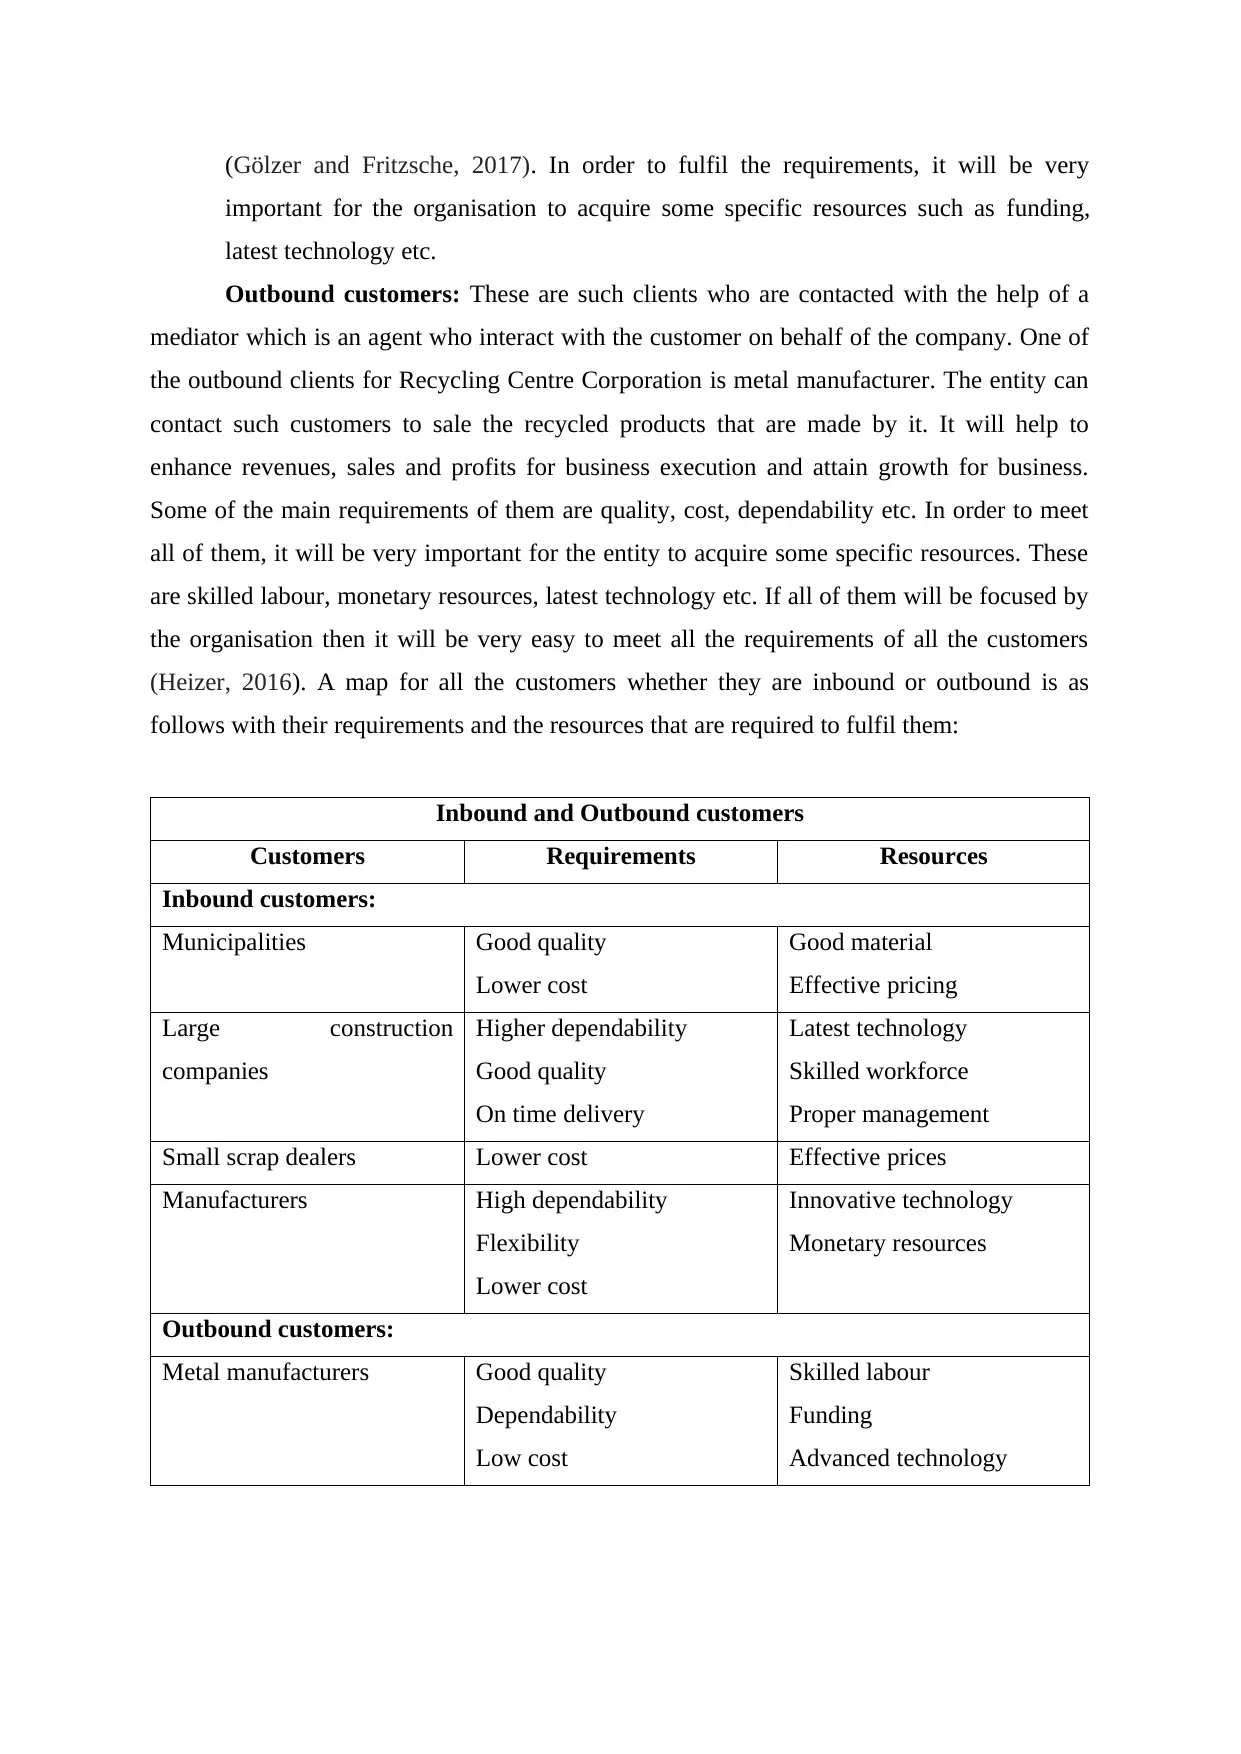
(Gölzer and Fritzsche, 2017). In order to fulfil the requirements, it will be very
important for the organisation to acquire some specific resources such as funding,
latest technology etc.
Outbound customers: These are such clients who are contacted with the help of a
mediator which is an agent who interact with the customer on behalf of the company. One of
the outbound clients for Recycling Centre Corporation is metal manufacturer. The entity can
contact such customers to sale the recycled products that are made by it. It will help to
enhance revenues, sales and profits for business execution and attain growth for business.
Some of the main requirements of them are quality, cost, dependability etc. In order to meet
all of them, it will be very important for the entity to acquire some specific resources. These
are skilled labour, monetary resources, latest technology etc. If all of them will be focused by
the organisation then it will be very easy to meet all the requirements of all the customers
(Heizer, 2016). A map for all the customers whether they are inbound or outbound is as
follows with their requirements and the resources that are required to fulfil them:
Inbound and Outbound customers
Customers Requirements Resources
Inbound customers:
Municipalities Good quality
Lower cost
Good material
Effective pricing
Large construction
companies
Higher dependability
Good quality
On time delivery
Latest technology
Skilled workforce
Proper management
Small scrap dealers Lower cost Effective prices
Manufacturers High dependability
Flexibility
Lower cost
Innovative technology
Monetary resources
Outbound customers:
Metal manufacturers Good quality
Dependability
Low cost
Skilled labour
Funding
Advanced technology
Paraphrase This Document
Need a fresh take? Get an instant paraphrase of this document with our AI Paraphraser
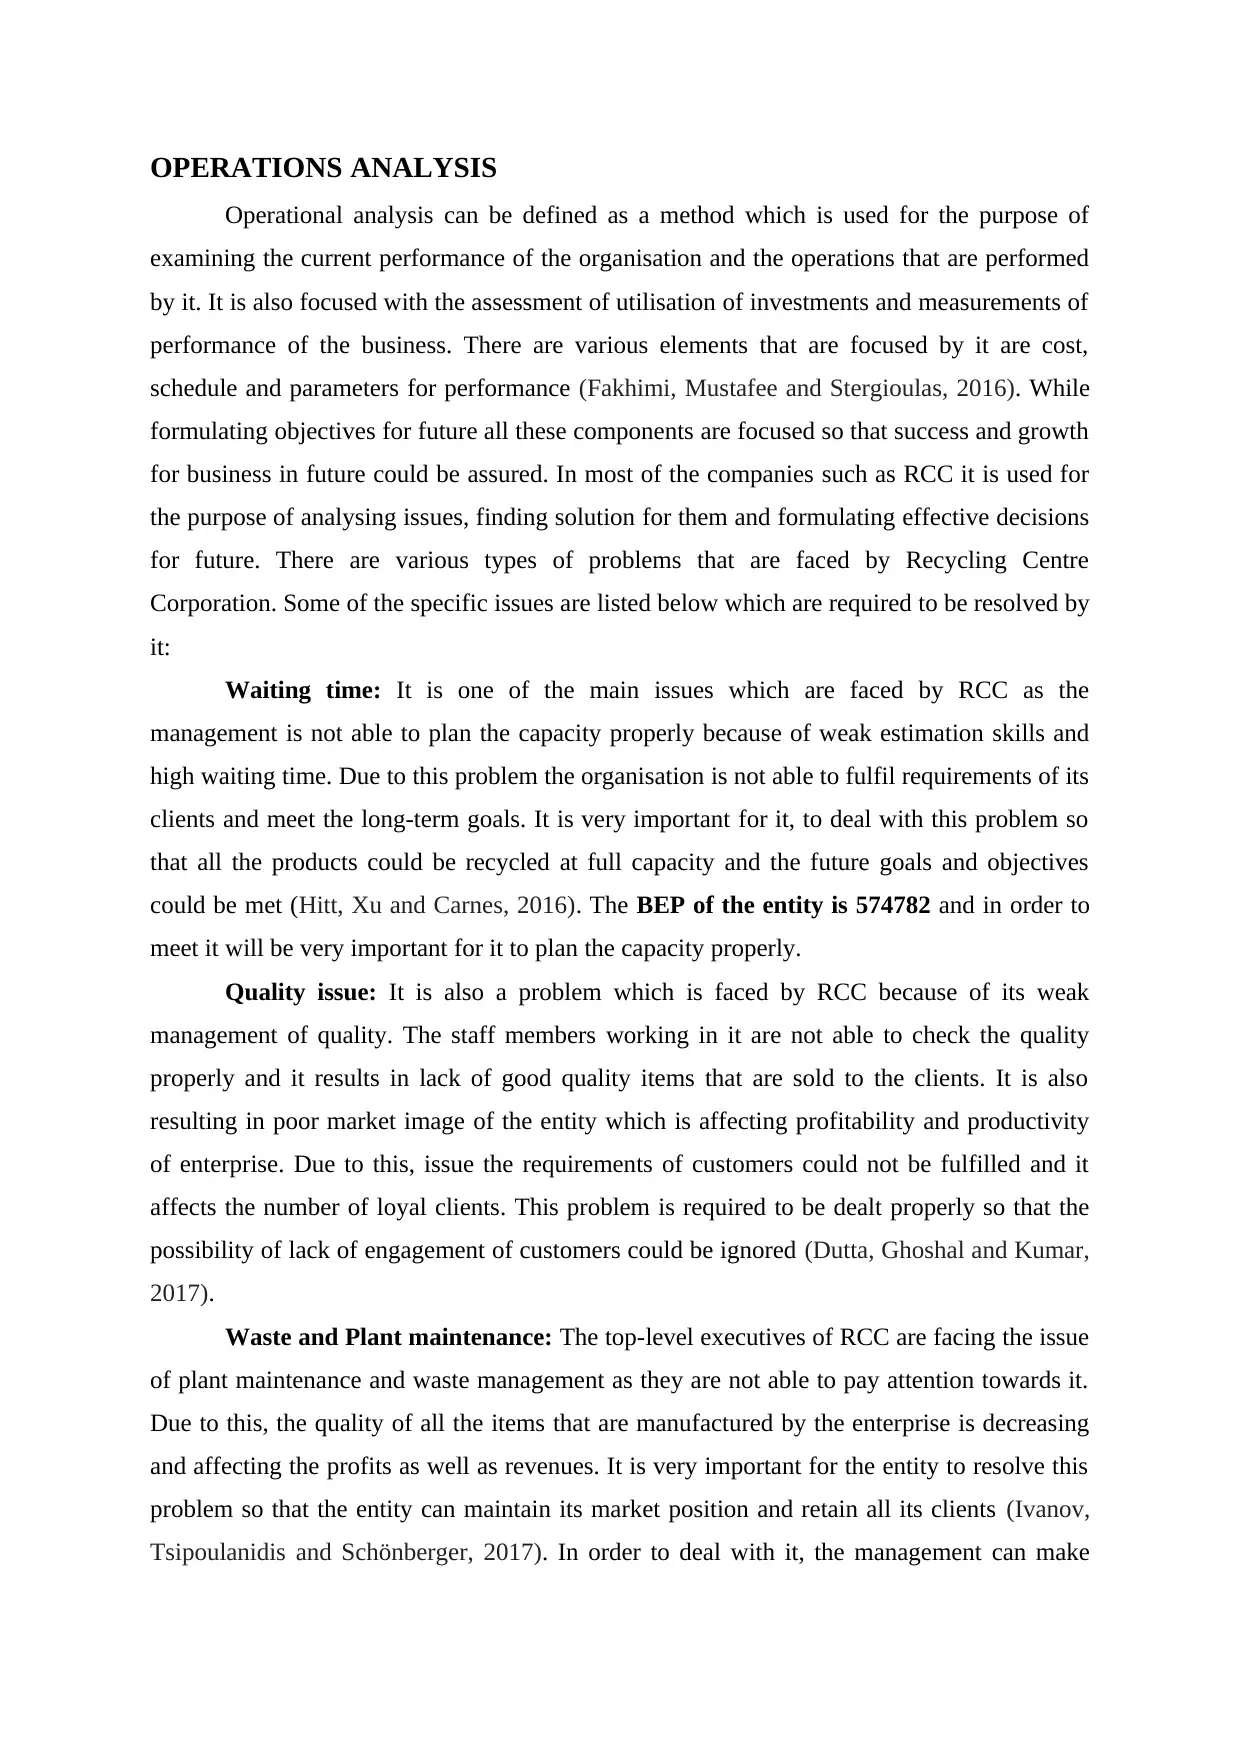
OPERATIONS ANALYSIS
Operational analysis can be defined as a method which is used for the purpose of
examining the current performance of the organisation and the operations that are performed
by it. It is also focused with the assessment of utilisation of investments and measurements of
performance of the business. There are various elements that are focused by it are cost,
schedule and parameters for performance (Fakhimi, Mustafee and Stergioulas, 2016). While
formulating objectives for future all these components are focused so that success and growth
for business in future could be assured. In most of the companies such as RCC it is used for
the purpose of analysing issues, finding solution for them and formulating effective decisions
for future. There are various types of problems that are faced by Recycling Centre
Corporation. Some of the specific issues are listed below which are required to be resolved by
it:
Waiting time: It is one of the main issues which are faced by RCC as the
management is not able to plan the capacity properly because of weak estimation skills and
high waiting time. Due to this problem the organisation is not able to fulfil requirements of its
clients and meet the long-term goals. It is very important for it, to deal with this problem so
that all the products could be recycled at full capacity and the future goals and objectives
could be met (Hitt, Xu and Carnes, 2016). The BEP of the entity is 574782 and in order to
meet it will be very important for it to plan the capacity properly.
Quality issue: It is also a problem which is faced by RCC because of its weak
management of quality. The staff members working in it are not able to check the quality
properly and it results in lack of good quality items that are sold to the clients. It is also
resulting in poor market image of the entity which is affecting profitability and productivity
of enterprise. Due to this, issue the requirements of customers could not be fulfilled and it
affects the number of loyal clients. This problem is required to be dealt properly so that the
possibility of lack of engagement of customers could be ignored (Dutta, Ghoshal and Kumar,
2017).
Waste and Plant maintenance: The top-level executives of RCC are facing the issue
of plant maintenance and waste management as they are not able to pay attention towards it.
Due to this, the quality of all the items that are manufactured by the enterprise is decreasing
and affecting the profits as well as revenues. It is very important for the entity to resolve this
problem so that the entity can maintain its market position and retain all its clients (Ivanov,
Tsipoulanidis and Schönberger, 2017). In order to deal with it, the management can make
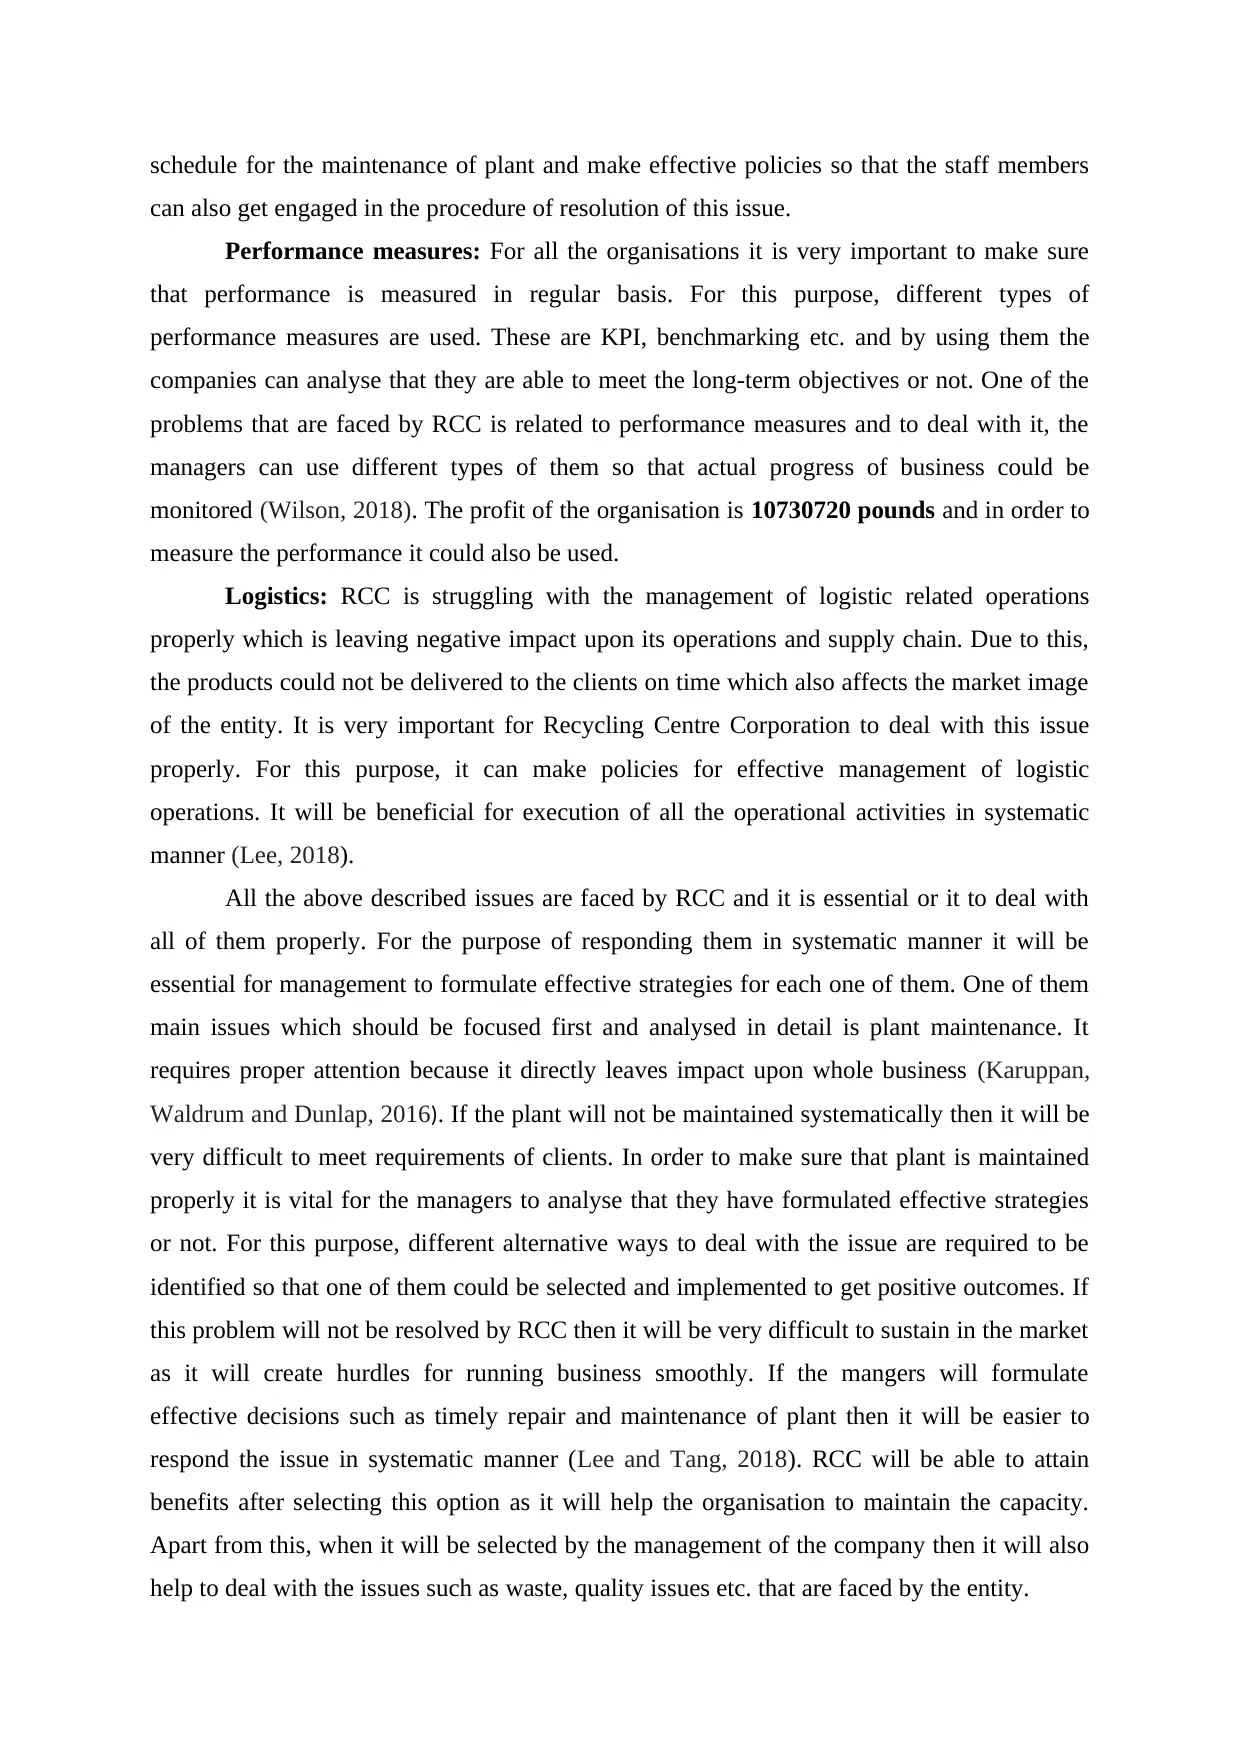
schedule for the maintenance of plant and make effective policies so that the staff members
can also get engaged in the procedure of resolution of this issue.
Performance measures: For all the organisations it is very important to make sure
that performance is measured in regular basis. For this purpose, different types of
performance measures are used. These are KPI, benchmarking etc. and by using them the
companies can analyse that they are able to meet the long-term objectives or not. One of the
problems that are faced by RCC is related to performance measures and to deal with it, the
managers can use different types of them so that actual progress of business could be
monitored (Wilson, 2018). The profit of the organisation is 10730720 pounds and in order to
measure the performance it could also be used.
Logistics: RCC is struggling with the management of logistic related operations
properly which is leaving negative impact upon its operations and supply chain. Due to this,
the products could not be delivered to the clients on time which also affects the market image
of the entity. It is very important for Recycling Centre Corporation to deal with this issue
properly. For this purpose, it can make policies for effective management of logistic
operations. It will be beneficial for execution of all the operational activities in systematic
manner (Lee, 2018).
All the above described issues are faced by RCC and it is essential or it to deal with
all of them properly. For the purpose of responding them in systematic manner it will be
essential for management to formulate effective strategies for each one of them. One of them
main issues which should be focused first and analysed in detail is plant maintenance. It
requires proper attention because it directly leaves impact upon whole business (Karuppan,
Waldrum and Dunlap, 2016). If the plant will not be maintained systematically then it will be
very difficult to meet requirements of clients. In order to make sure that plant is maintained
properly it is vital for the managers to analyse that they have formulated effective strategies
or not. For this purpose, different alternative ways to deal with the issue are required to be
identified so that one of them could be selected and implemented to get positive outcomes. If
this problem will not be resolved by RCC then it will be very difficult to sustain in the market
as it will create hurdles for running business smoothly. If the mangers will formulate
effective decisions such as timely repair and maintenance of plant then it will be easier to
respond the issue in systematic manner (Lee and Tang, 2018). RCC will be able to attain
benefits after selecting this option as it will help the organisation to maintain the capacity.
Apart from this, when it will be selected by the management of the company then it will also
help to deal with the issues such as waste, quality issues etc. that are faced by the entity.
⊘ This is a preview!⊘
Do you want full access?
Subscribe today to unlock all pages.
Trusted by 1+ million students worldwide
STRATEGIC DIRECTION
Strategic direction can be defined as the option which is selected by the organisation
to attain growth for future. While planning to select on strategic direction it is very important
or all the entities to make sure that different alternatives are selected by them. RCC is also
looking for possible options for it so that it can grow its business and enhance sales and
profits. One of the best models which could be used for this purpose is Ansoff Matrix
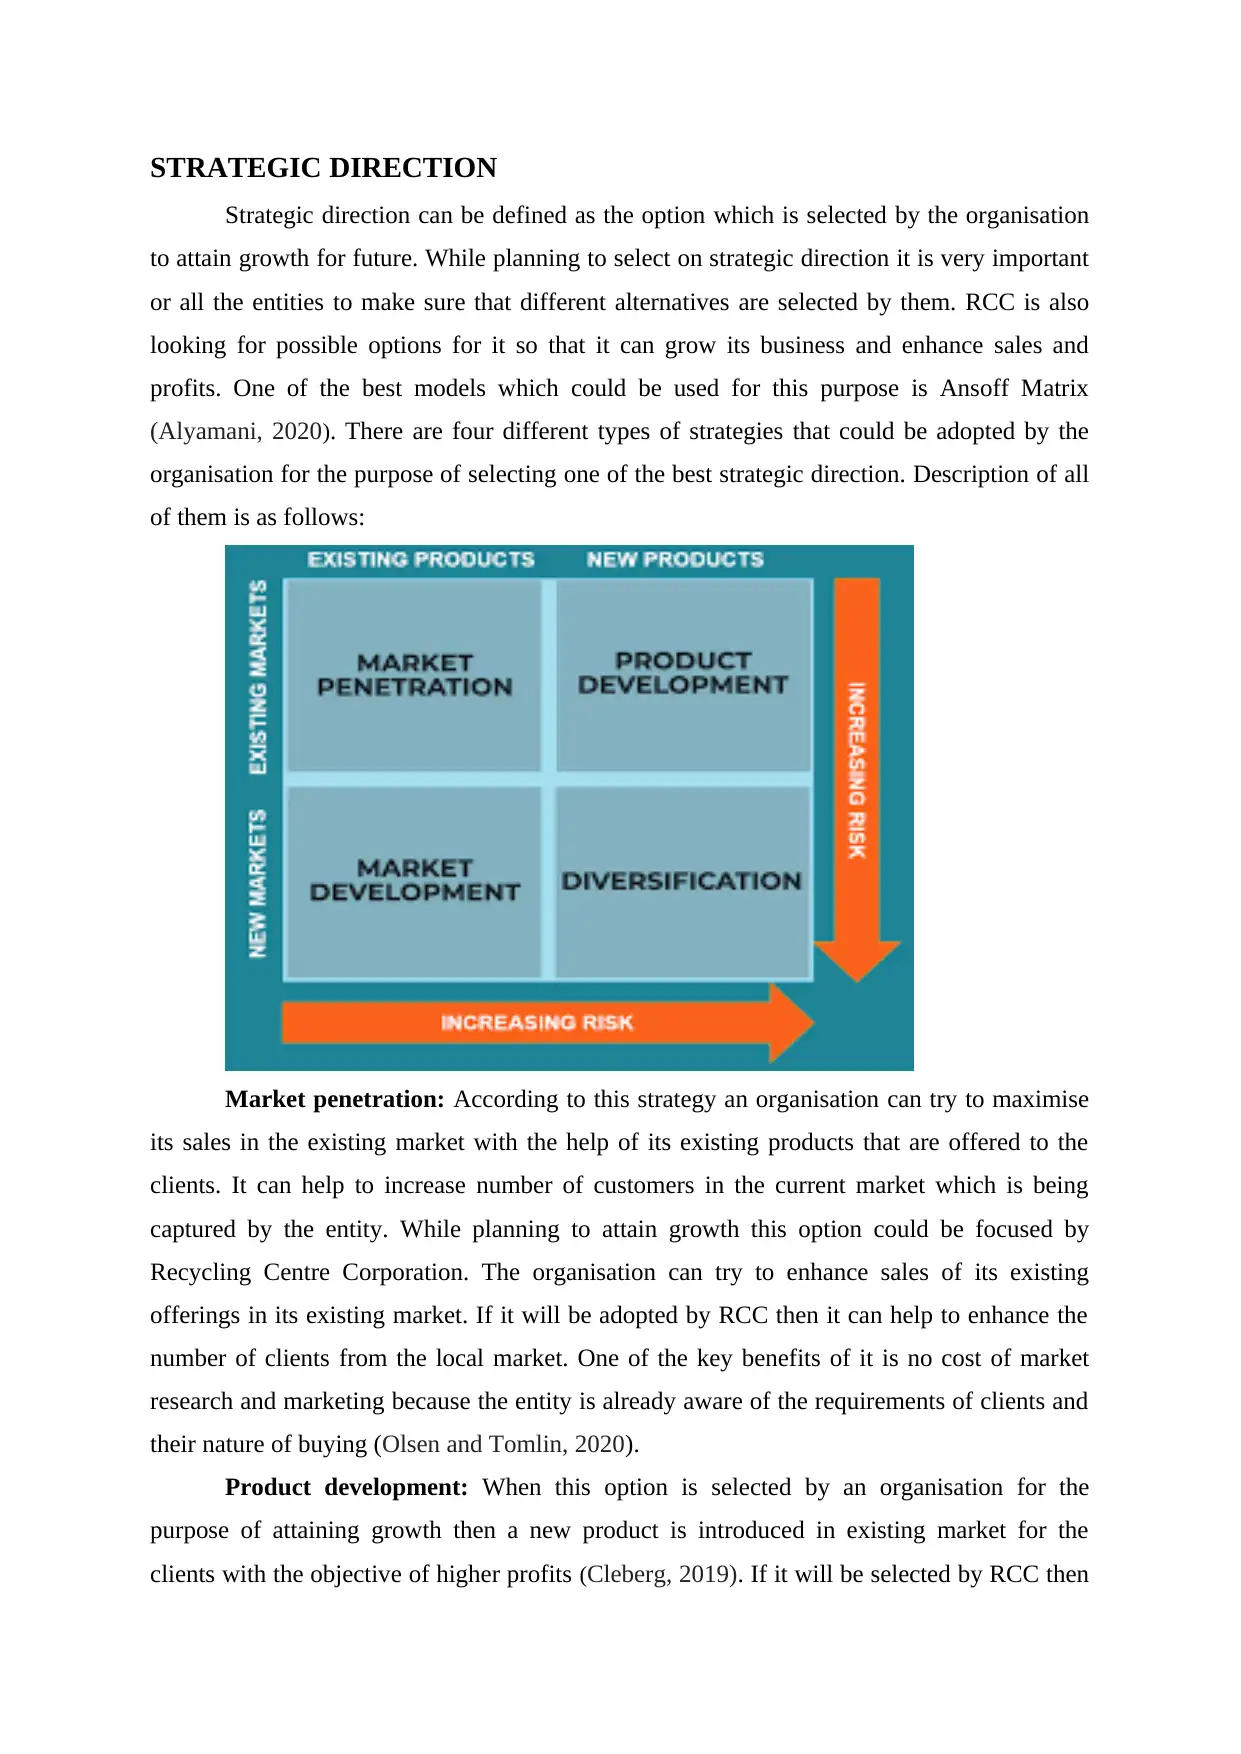
(Alyamani, 2020). There are four different types of strategies that could be adopted by the
organisation for the purpose of selecting one of the best strategic direction. Description of all
of them is as follows:
Market penetration: According to this strategy an organisation can try to maximise
its sales in the existing market with the help of its existing products that are offered to the
clients. It can help to increase number of customers in the current market which is being
captured by the entity. While planning to attain growth this option could be focused by
Recycling Centre Corporation. The organisation can try to enhance sales of its existing
offerings in its existing market. If it will be adopted by RCC then it can help to enhance the
number of clients from the local market. One of the key benefits of it is no cost of market
research and marketing because the entity is already aware of the requirements of clients and
their nature of buying (Olsen and Tomlin, 2020).
Product development: When this option is selected by an organisation for the
purpose of attaining growth then a new product is introduced in existing market for the
clients with the objective of higher profits (Cleberg, 2019). If it will be selected by RCC then
Strategic direction can be defined as the option which is selected by the organisation
to attain growth for future. While planning to select on strategic direction it is very important
or all the entities to make sure that different alternatives are selected by them. RCC is also
looking for possible options for it so that it can grow its business and enhance sales and
profits. One of the best models which could be used for this purpose is Ansoff Matrix
(Alyamani, 2020). There are four different types of strategies that could be adopted by the
organisation for the purpose of selecting one of the best strategic direction. Description of all
of them is as follows:
Market penetration: According to this strategy an organisation can try to maximise
its sales in the existing market with the help of its existing products that are offered to the
clients. It can help to increase number of customers in the current market which is being
captured by the entity. While planning to attain growth this option could be focused by
Recycling Centre Corporation. The organisation can try to enhance sales of its existing
offerings in its existing market. If it will be adopted by RCC then it can help to enhance the
number of clients from the local market. One of the key benefits of it is no cost of market
research and marketing because the entity is already aware of the requirements of clients and
their nature of buying (Olsen and Tomlin, 2020).
Product development: When this option is selected by an organisation for the
purpose of attaining growth then a new product is introduced in existing market for the
clients with the objective of higher profits (Cleberg, 2019). If it will be selected by RCC then
Paraphrase This Document
Need a fresh take? Get an instant paraphrase of this document with our AI Paraphraser
the management can launch a new recycled item in the market which will help to attract more
and more new clients and attain growth for business. The cost of market research will also be
very low if this option will be selected by RCC because it will be having information about
preferences of clients in advance.
Market development: Under this option of Ansoff Matrix the entity can launch its
existing product in a new market for the purpose of expanding the business. With the help of
it, market share could be enhanced. While planning to attain growth it could be selected by
RCC because the managers can introduce its existing products in a new location. It will be
beneficial for the organisation to capture a larger market area and attain growth. If this
strategy will be adopted by the entity then the management will have to spend monetary
resource of market research of the new market. With the help of it, information regarding
taste and preferences of all the targeted audience could be gathered and decisions regarding
launching the products could eb taken (Qi and Shen, 2019).
Diversification: It is the last strategic direction which is available to RCC which is
mainly focused with introduction of a new product in a new market. The risk associated with
it is very high as it is not possible to estimate that the new clients will adopt the product or
not. If it will be selected by the organisation then it will be very important or it to make sure
that it is able to spend funding on different activities such as market research and production.
The level of risk with this option is very high so it is essential for the organisation to make
sure that it is ready to take risks and deal with all of the properly (Reid and Sanders, 2019).
There are various options available for RCC in order to select the strategic direction.
The best suitable option for it will be the product development which will help it to launch a
new recycled item in its existing market share because is this option will be adopted by
Recycling Centre Corporation then the enterprise can use the food waste to make biogas
which can help to produce electricity for light bulbs. According to Marie Louise who is the
newly hired communications manager, 1kg of food waste could be used to make bio gas
which can produce electricity for a 1 light bulb (Thomé, Scavarda and Scavarda, 2016).
This idea could be introduced by the organisation in the market which will help it to
enhance its sales and increase the number of customers from the local market. If it will be
selected by the enterprise then no additional cost of market research will take place as the
managers will having detailed information of preferences of customers. This product
development option will help RCC to attain higher profits and attract new customers to
achieve sustainability for business (Yin, 2016). With the help of this strategy of Ansoff
matrix the entity will be able to meet its capacity related goals and maintain profits for future.
MANAGEMENT DECISIONS
There are various types of managerial actions will be required to be taken by the
managers of Recycling Centre Corporation for the betterment of business. All of them could
be understood with the help of following discussion:
The managers are required to take control over logistic activities so that the supply
chain could be managed systematically and business could be carried out in
systematic manner (Van Aken, Chandrasekaran and Halman, 2016).
One of the main managerial decisions will be managing the quality because it is
required to meet organisational objectives such as higher customer engagement and
profits.
The managers are also required to take actions regarding plant maintenance as it is
required to meet expectation of all the customers.
While planning to focus upon the strategy of product development it will be essential
for the managers to make sure that they are making efforts for introducing the new
product properly. It will help to attract more and more customers from the existing
market.
The managers will also be responsible to take action regarding assessment of
requirements of customers so that resources to fulfil them could be acquired. For this
purpose, proper analysis or mapping for clients could be conducted as it will facilitate
the decision making of product delivery.
The managers should take action for measuring performance of business on regular
basis. For this purpose, different types of performance measures could be used. These
are benchmarking, KPI etc. With the help of KPI success and failure of business
decisions could be measured which can facilitate the analysis of that the strategy
should be implemented or not. Benchmarking could be used to compare the policies
of business with the competitors so that it could be determined that the company will
be able to sustain in the market or not.
The managers of RCC should pay attention towards all the above described
managerial actions because with the help of all of them they will be able to find solution for
all the issues of business. Apart from this, these actions are also required to be taken for the
purpose of implementing the strategy of product development properly because the managers
are required to make sure that they should not make any type of mistake while selecting
strategic direction.
⊘ This is a preview!⊘
Do you want full access?
Subscribe today to unlock all pages.
Trusted by 1+ million students worldwide
1 out of 15
Related Documents


Your All-in-One AI-Powered Toolkit for Academic Success.
+13062052269
info@desklib.com
Available 24*7 on WhatsApp / Email
![[object Object]](/_next/static/media/star-bottom.7253800d.svg)
Unlock your academic potential
Copyright © 2020–2026 A2Z Services. All Rights Reserved. Developed and managed by ZUCOL.