Operations Performance and Management Report - WIUT - 5MNST001C
VerifiedAdded on 2022/09/09
|16
|3683
|17
Report
AI Summary
This report analyzes the operations performance and management of a protective clothing manufacturing company, addressing challenges and opportunities arising from increased demand during the COVID-19 pandemic. The report examines changes in utilization rates, capacity planning strategies, and sequencing rules for production, including the application of the shortest operating schedule. It delves into inventory management using material requirements planning and economic order quantity calculations to optimize costs. Furthermore, the report explores supply chain management, covering material planning, procurement, warehouse operations, and distribution. The analysis also includes operational performance objectives such as speed and quality, with recommendations for improvement. The assignment uses real-world data and examples to illustrate key concepts, providing a practical understanding of operations management principles.

Operations Performance and Management 1
Operations Performance and Management
By [Name]
Course
Lecturer’s Name
Institution
Location Of Institution
Date
Operations Performance and Management
By [Name]
Course
Lecturer’s Name
Institution
Location Of Institution
Date
Paraphrase This Document
Need a fresh take? Get an instant paraphrase of this document with our AI Paraphraser

Operations Performance and Management 2
Contents
Introduction..........................................................................................................................3
1 Change In Utilisation Rates...........................................................................................3
2 Capacity planning strategy............................................................................................4
3 Sequencing rule for production plan.............................................................................5
3.1 Table 1: sequencing rule application.....................................................................6
Table 2: solution to the applied sequencing rule..............................................................6
4 Inventory management analysis....................................................................................6
5 Economic Order Quantity.............................................................................................7
6 Managing the Supply Chain..........................................................................................8
6.1 Figure 1: supply chain management....................................................................10
7 Variation of operation processes based on the 4Vs.....................................................11
8 Conclusion...................................................................................................................12
9 References...................................................................................................................13

Operations Performance and Management 3
Introduction
Protective clothing has had little usage in the past, preferably used in hospitals by health
personnel attending to their clients suffering from various illnesses. This has always led to lower
production of these items due to low demand. With the outbreak, Covid-19, demand for
disposable clothing increased. An increase in demand calls for increased production. Production
of these clothing has thus increased.
PART 1
1 Change In Utilisation Rates
Disposable clothing was not required in large numbers prior to the pandemic. The
demand was constant but low. The customers of these were mostly medical staff and persons
working in hazardous environments. The producing company used to produce an average of
200000 packets per month which was quite low compared to optimum production when the
producing plants are efficiently utilised. Efficient utilisation implies 100% efficiency of the
machines (Fredendall and Hill, 2016). Time wasted in the whole production process and when
repairing the machine is also minimised. At maximum efficiency, the company can produce
500,000 packets in a month. Since the disease outbreak, demand rose making the company to
produce 450,000 packets in a month. The utilisation rate is obtained as calculated below (Gogia
et al., 2015; Yu et al., 2016). The production values are approximated in consideration of Top
Glove which manufactures gloves with a capacity of 73.4 billion gloves annually (Tho, 2020).
Which translates to 6 billion gloves a month. The time taken to manufacture 1 pair of gloves is
approximately 200times less than the time required to manufacture a complete set of protective
⊘ This is a preview!⊘
Do you want full access?
Subscribe today to unlock all pages.
Trusted by 1+ million students worldwide

Operations Performance and Management 4
clothing (coverall, head cap, gloves, and masks) this means that if the company was
manufacturing complete sets it would manufacture 6/200 sets (30000000). Assuming the
Uzbekistan plant is 10 times smaller and each unit consists of 6sets,the company bears a capacity
of 500,000 units.
Utilization rate = actual production
¿ maximum production * 100%
Previous utilization rate = 200000
500000 * 100% = 40%
Current utilization rate = 450,000
500000 * 100% =90%
2 Capacity planning strategy
The current utilisation is at 90% less 10% for the available packets that can be produced.
As the disease continues to spread, there are chances that demand will outweigh the production.
Strategies that need to be implemented to ensure that this does not occur includes:
Creation of additional capacity. The company must invest in growing its capacity as a
manufacturer. Given the rate which Covid-19 is spreading across the globe, the demand will
soon surpass the company’s current capacity. The increase in capacity will equip the company
with the ability to produce more (Carvalho, Menasce and Brasileiro, 2017).
The company can set out a sequential productivity increment plan. Using the chase
strategy, the company can increase the capacity at a rate proportional to the increase in demand.
Such a policy will ensure the company does not overproduce and remains relevant to the market.
The plan will also mean that the capacity will be an increase in steps, for example, a monthly
capacity increase of a percentage equal to the percentage increase in demand (Choi, Chiu and
Chan, 2016).
Paraphrase This Document
Need a fresh take? Get an instant paraphrase of this document with our AI Paraphraser

Operations Performance and Management 5
The company can employ the adjustment strategy whereby it increases the capacity in
large amounts like 1,000,000 from 500,000 packets, an interval of 500,000 packages. Therefore,
when the demand reaches that capacity, the capacity is increased within the specified range
(Slack and Brandon-Jones, 2018).
The company should increase the frequency of demand forecasting analysis to weekly.
The infection figures are increasing exponentially, and the company cannot continue operating
based on annual forecasts. Failure to increase the frequency of demand analysis might get the
company caught up in a demand-supply dilemma (Amutabi, 2017).
3 Sequencing rule for production plan.
A sequencing rule provides guidelines on how customer orders are going to be served
upon arrival. These rules include:
First come, first served rule. It is where the service of customers is based on arrival time.
The order which arrives first is served in that sequence until the last bone is served.
Shortest operating schedule whereby orders are arranged in terms of the minimum time
that can be taken to serve. Time taken for completion of an order depends on that taken to serve
those orders that come before it plus its term of service.
Earliest due date first is a rule which enables to be served in terms of deadline dates.
Those whose deadline dates come early are served first, and the one with the latest due date
served last (Haider, Mirza and Ahmad, 2015).
Slack time remaining first states that an order is served concerning available time before
its due date is reached.

Operations Performance and Management 6
There is a high demand for protective clothing as everyone tries to save his/her life from
this pandemic. Sequencing rule adopted in this situation is the shortest operating schedule rule
(Hugos, 2018). Below is an illustration;
Order (in terms of
arrival time)
Quantity(packets) Time taken to
process(days)
Deadline
dates(days)
A 150000 10 18
B 210000 14 30
C 75000 5 8
D 30000 2 5
E 195000 13 25
3.1 Table 1: sequencing rule application
The shortest operating schedule analysis is as follows
Order (in terms
of arrival time)
Quantity(packets) Time taken to
process(days)
Deadline
dates(days)
Flow
time(days)
D 30000 2 5 2
C 75000 5 8 7
A 150000 10 18 17
E 195000 13 25 30
B 210000 14 30 44
Table 2: solution to the applied sequencing rule.
⊘ This is a preview!⊘
Do you want full access?
Subscribe today to unlock all pages.
Trusted by 1+ million students worldwide

Operations Performance and Management 7
Shortest operating time reduces the waiting time for those requiring protective clothes in
small quantities. They don't have to wait until the long-chain consisting of orders required in
bulk.
PART 2
4 Inventory management analysis
The best option is to introduce the material requirements planning. In this method, the
materials are sourced after forecasting the demand. Using real time data in the market,
management could determine the expected demand. Using the figures, the manager will order the
raw materials required to produce the demand at hand.
Using the case of the virtual company in discussion;
Assuming the weakly demand is equivalent to the production capacity of 500000 units.
2 square meters of cotton cloth is required to make one unit of the product
1.6 square meters of linen are required to make one unit of the product
0.2 square meters of sponge required to make one unit of the product.
Using the forecast demand of 500, 000 units, the raw material order will be as follows
500000 * 2 = 1,000,000 square meters of cloth
500000 * 1.6 = 800, 000 square meters of linen
500000 * 0.2 = 100000 square meters of sponge
These means that the orders made on raw materials will be determined weekly by
computing the required amount of each specific item on the raw material list by multiplying the
unit requirements with the number of units in demand.
Paraphrase This Document
Need a fresh take? Get an instant paraphrase of this document with our AI Paraphraser

Operations Performance and Management 8
5 Economic Order Quantity
The economic order quantity is advantageous that it reduces material carrying costs and
eliminates excess inventory. In the said company, the cost of material for making a unit of
protective clothing is 35 dollars. The cost of setting up order is 100 dollars. With a weakly
demand of 500, 000 and holding fee of 2 dollars a week.
Q= √ 2 DS
H = √ 2 ×500000 ×100
2 = 7072
The ordering cost therefore is 7072 * 100 = 707200$
Converting to UZS = 707200 * 9600 = 6,789,120,000UZS
The economic order quantity will depend on the forecast demand and will ultimately
eliminate unnecessary inventory (Kazemi et al., 2018).
6 Managing the Supply Chain
i. Material planning – raw materials will be obtained from local suppliers. Previously some
raw materials were being imported from China and Japan. Given the situation of the
nation, the country is on lockdown. The procurement department will identify and engage
potential local suppliers for a partnership in the supply of raw materials in this period.
The company will also attempt to buy in bulk from any individuals or companies that
might have surplus stock in their warehouse as they close business. Given that the
companies have mostly closed down in an attempt to self-quarantine, most of them will
be willing to give away their stock at any reasonable price. Additionally, the company’s
warehouses will have to be temporarily expanded. This will be done through the erection
of tents and temporary structures within the company’s premises (Gyulai, K'ad'ar and
Monosotori, 2015).
Operations Performance and Management 9
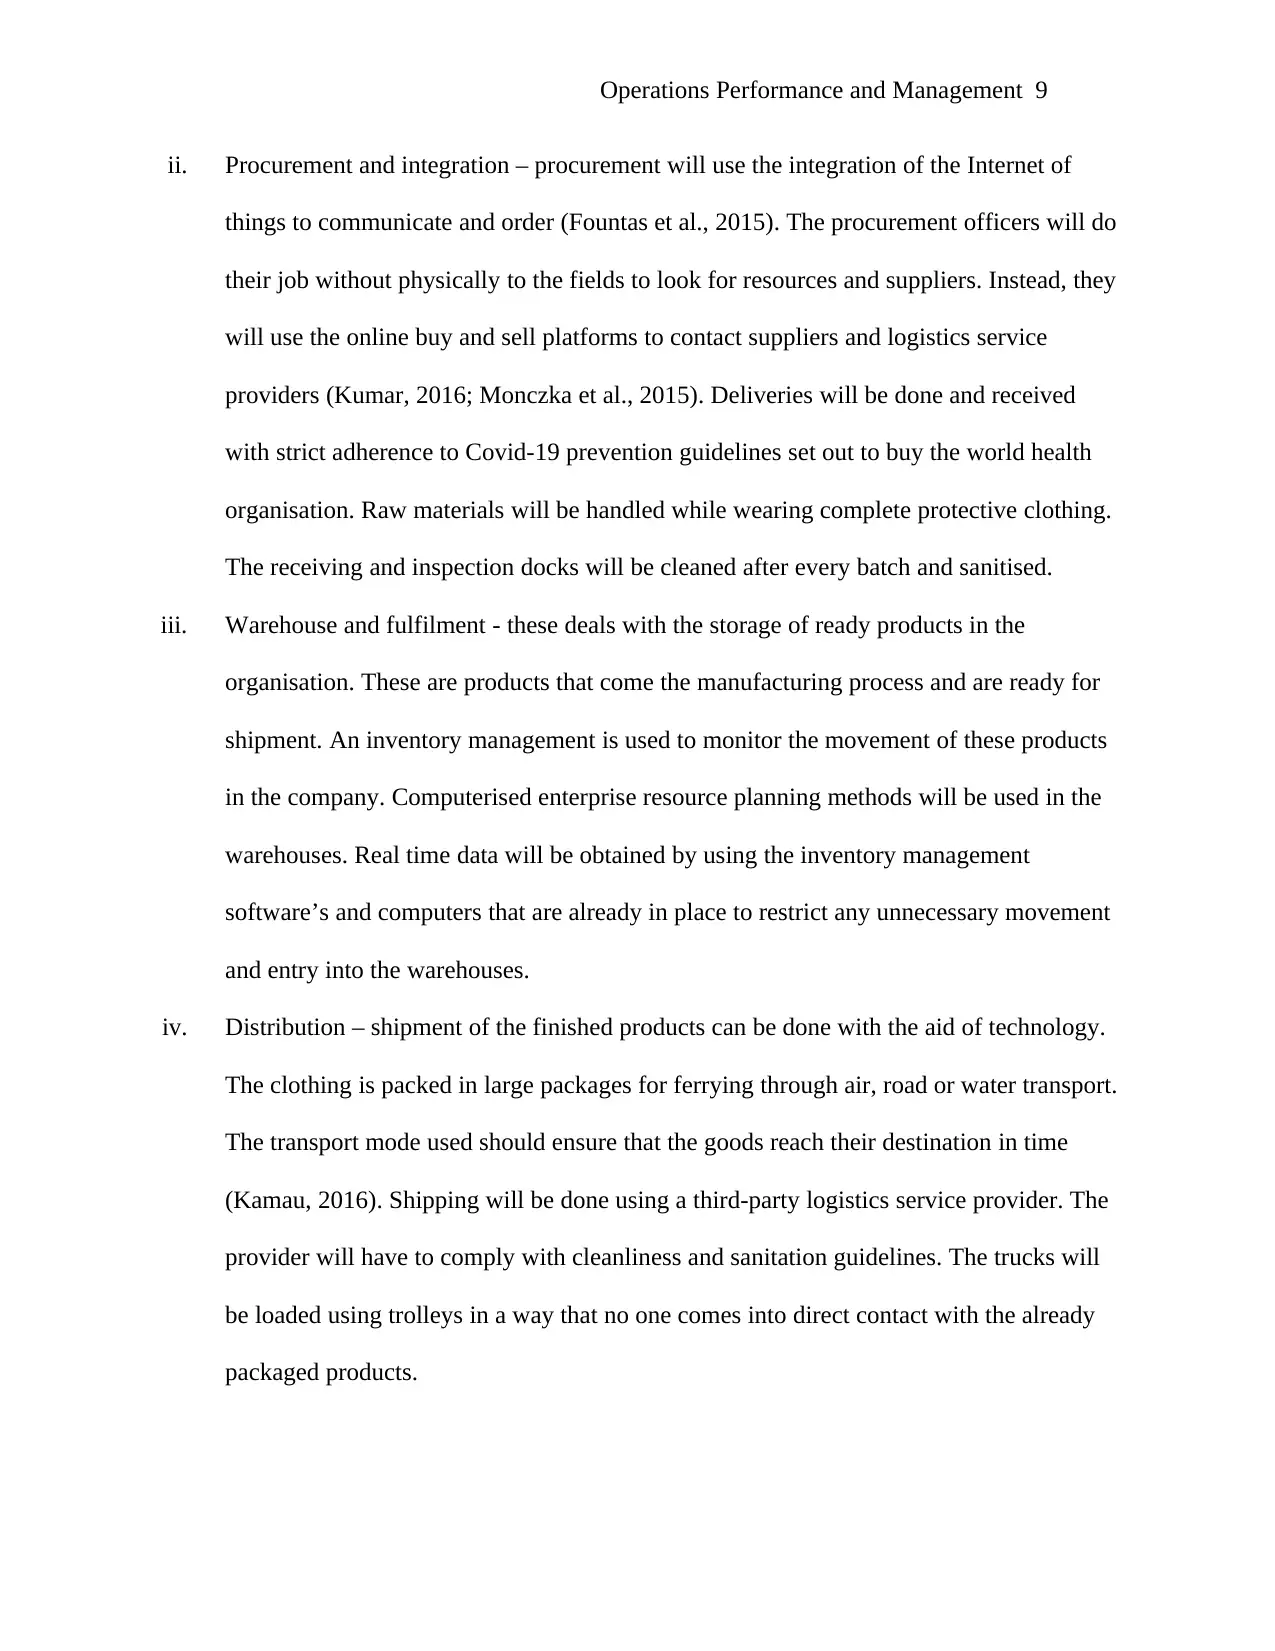
ii. Procurement and integration – procurement will use the integration of the Internet of
things to communicate and order (Fountas et al., 2015). The procurement officers will do
their job without physically to the fields to look for resources and suppliers. Instead, they
will use the online buy and sell platforms to contact suppliers and logistics service
providers (Kumar, 2016; Monczka et al., 2015). Deliveries will be done and received
with strict adherence to Covid-19 prevention guidelines set out to buy the world health
organisation. Raw materials will be handled while wearing complete protective clothing.
The receiving and inspection docks will be cleaned after every batch and sanitised.
iii. Warehouse and fulfilment - these deals with the storage of ready products in the
organisation. These are products that come the manufacturing process and are ready for
shipment. An inventory management is used to monitor the movement of these products
in the company. Computerised enterprise resource planning methods will be used in the
warehouses. Real time data will be obtained by using the inventory management
software’s and computers that are already in place to restrict any unnecessary movement
and entry into the warehouses.
iv. Distribution – shipment of the finished products can be done with the aid of technology.
The clothing is packed in large packages for ferrying through air, road or water transport.
The transport mode used should ensure that the goods reach their destination in time
(Kamau, 2016). Shipping will be done using a third-party logistics service provider. The
provider will have to comply with cleanliness and sanitation guidelines. The trucks will
be loaded using trolleys in a way that no one comes into direct contact with the already
packaged products.
⊘ This is a preview!⊘
Do you want full access?
Subscribe today to unlock all pages.
Trusted by 1+ million students worldwide

Operations Performance and Management 10
v. Repairs and returns – there is provision for compensation and repair of clothing that may
go into waste during transportation before they are delivered to customers. In this period
of high demand, the company will accept no return policies considering the presence of
Covid_19 and the fears that any returned products could be contaminated with the virus.
6.1 Figure 1: supply chain management
7. Operations performance objectives
Operational performance objectives are areas of operational performance that the
company ne in which the company needs to improve to meet its corporate strategy. These factors
include quality, dependability, speed, cost and flexibility (Taticchi et al., 2015).
Speed objective – this monitor how fast the manufacturing process can be achieved, thus
having the final product. It also deals with the time taken to deliver any item to the customer.
The company should, therefore, have a fast delivery of protective clothing to save lives. The
company will operate a 24-hour delivery policy. To realise this, it will hire more personnel who
will work in shifts to ensure that no order takes more than 24hours before it is delivered. It
should also have a faster production of the items and reduce delays that may lower customer
satisfaction (Fredendall and Hill, 2016).
Paraphrase This Document
Need a fresh take? Get an instant paraphrase of this document with our AI Paraphraser

Operations Performance and Management 11
Quality of products – high quality and quantity production of products leading to
customer satisfaction and meeting the rising demand for the products. For efficiency in
production, high quality and relatively low-cost raw materials should be used. Given the severity
of the condition of the disease, the company will implement a zero-error policy in protective
clothing. This is considering that any minor error could cost the life of an entire facility. Products
found with any percentage of defect at the inspection stage will be returned to the line of for
reprocessing or to salvage the material thereof for use in producing another component.
Cost – cost is another objective for operational performance. The company should
produce protective clothing of relatively low cost to enable the less vulnerable societies to
purchase the item, thus saving their lives. When produced cheaply, the final seller will also sell it
at a lower price easing the burden of high rates that are always imposed on buyers. Small cost
production is achieved through obtaining the raw materials at a cheaper price (Carvalho,
Menasce and Brasileiro, 2017). To realise such an objective, the plant will have to purchase raw
materials at relatively less expensive costs and make maximum use of any capacity created using
capital.
Dependability – it’s where the company’s produced products can serve the existing
market without going to a shortage. This achieved through the continuous production of the
items and constant supply of raw materials to run the manufacturing process.
Flexibility – the whole production process should positively respond to the organisational
changes and change in the entire market without causing shortage to customers due to
insufficient supply (Slack, 2018).
Operations Performance and Management 12
7 Variation of operation processes based on the 4Vs
The 4Vs in the operation processes are volume, visibility, variety and variation. They
affect the operation process as discussed below:
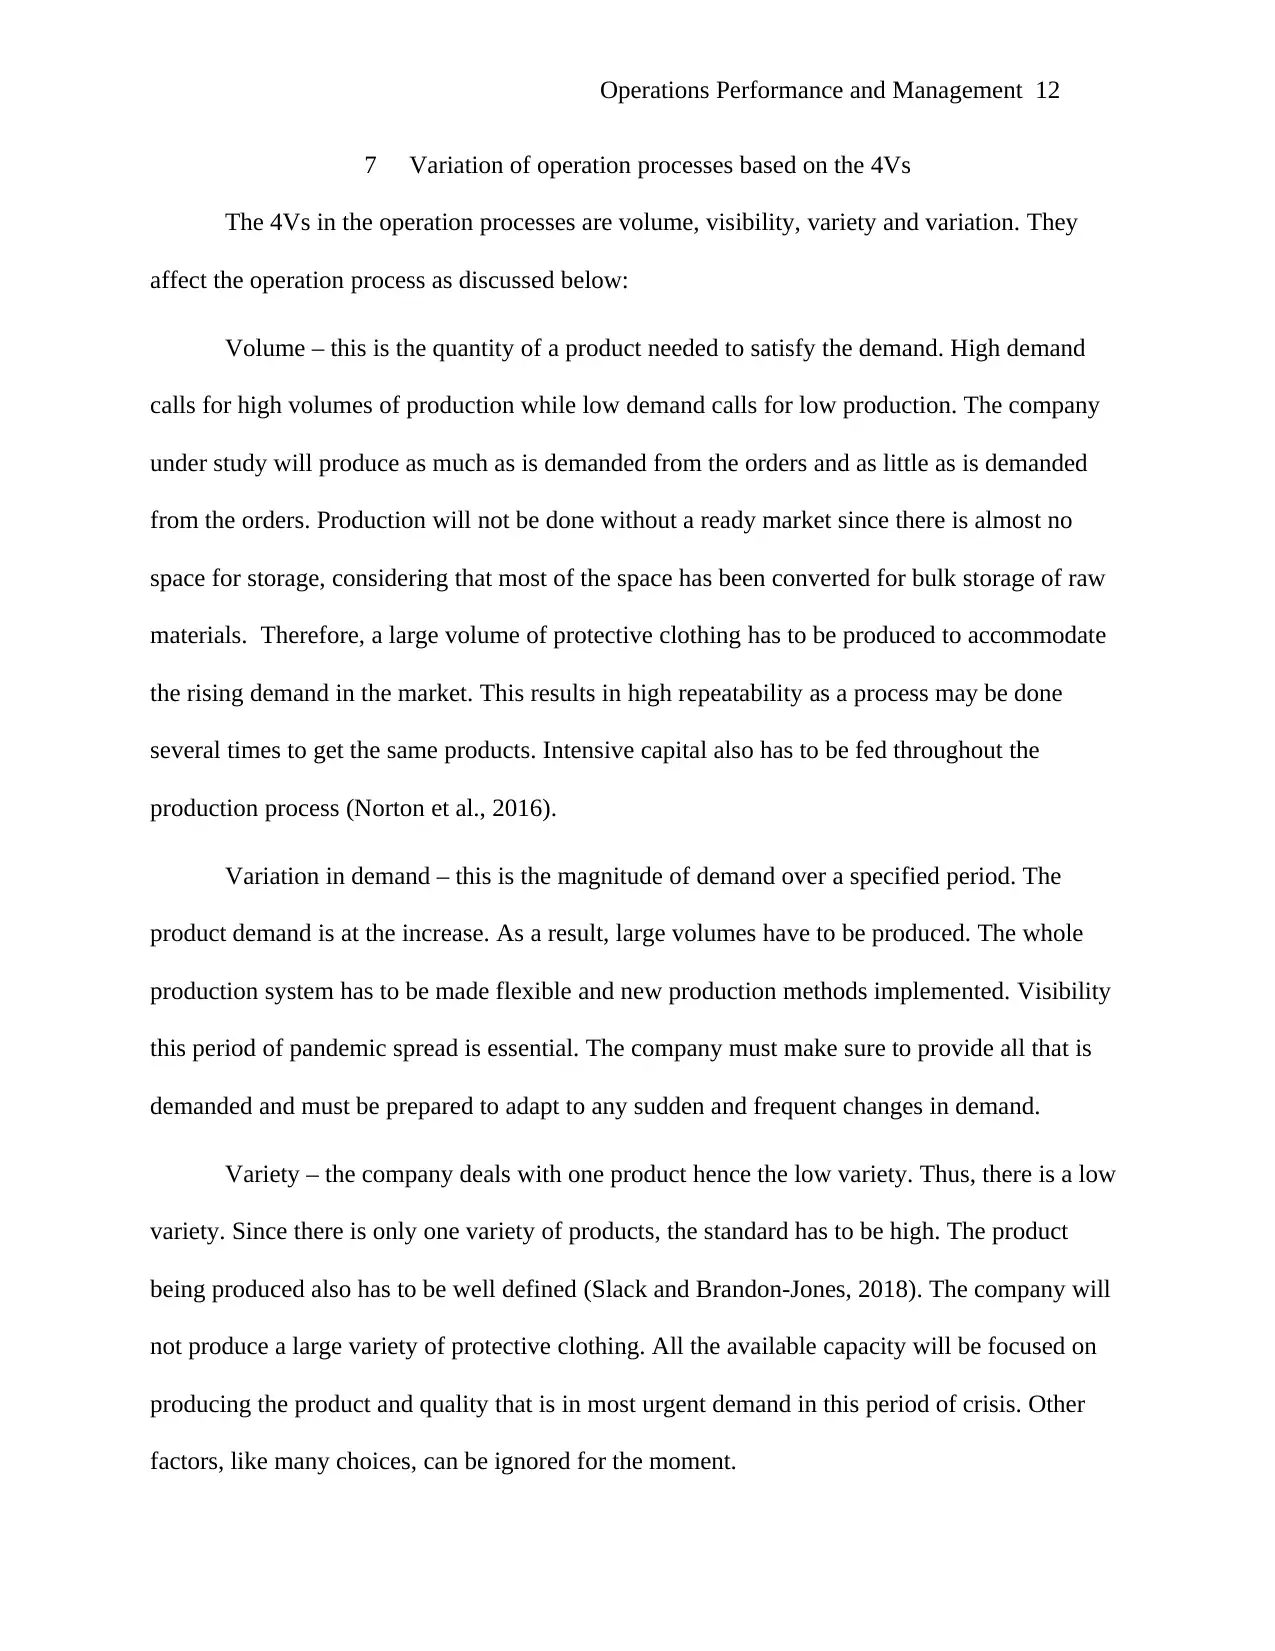
Volume – this is the quantity of a product needed to satisfy the demand. High demand
calls for high volumes of production while low demand calls for low production. The company
under study will produce as much as is demanded from the orders and as little as is demanded
from the orders. Production will not be done without a ready market since there is almost no
space for storage, considering that most of the space has been converted for bulk storage of raw
materials. Therefore, a large volume of protective clothing has to be produced to accommodate
the rising demand in the market. This results in high repeatability as a process may be done
several times to get the same products. Intensive capital also has to be fed throughout the
production process (Norton et al., 2016).
Variation in demand – this is the magnitude of demand over a specified period. The
product demand is at the increase. As a result, large volumes have to be produced. The whole
production system has to be made flexible and new production methods implemented. Visibility
this period of pandemic spread is essential. The company must make sure to provide all that is
demanded and must be prepared to adapt to any sudden and frequent changes in demand.
Variety – the company deals with one product hence the low variety. Thus, there is a low
variety. Since there is only one variety of products, the standard has to be high. The product
being produced also has to be well defined (Slack and Brandon-Jones, 2018). The company will
not produce a large variety of protective clothing. All the available capacity will be focused on
producing the product and quality that is in most urgent demand in this period of crisis. Other
factors, like many choices, can be ignored for the moment.
7 Variation of operation processes based on the 4Vs
The 4Vs in the operation processes are volume, visibility, variety and variation. They
affect the operation process as discussed below:
Volume – this is the quantity of a product needed to satisfy the demand. High demand
calls for high volumes of production while low demand calls for low production. The company
under study will produce as much as is demanded from the orders and as little as is demanded
from the orders. Production will not be done without a ready market since there is almost no
space for storage, considering that most of the space has been converted for bulk storage of raw
materials. Therefore, a large volume of protective clothing has to be produced to accommodate
the rising demand in the market. This results in high repeatability as a process may be done
several times to get the same products. Intensive capital also has to be fed throughout the
production process (Norton et al., 2016).
Variation in demand – this is the magnitude of demand over a specified period. The
product demand is at the increase. As a result, large volumes have to be produced. The whole
production system has to be made flexible and new production methods implemented. Visibility
this period of pandemic spread is essential. The company must make sure to provide all that is
demanded and must be prepared to adapt to any sudden and frequent changes in demand.
Variety – the company deals with one product hence the low variety. Thus, there is a low
variety. Since there is only one variety of products, the standard has to be high. The product
being produced also has to be well defined (Slack and Brandon-Jones, 2018). The company will
not produce a large variety of protective clothing. All the available capacity will be focused on
producing the product and quality that is in most urgent demand in this period of crisis. Other
factors, like many choices, can be ignored for the moment.
⊘ This is a preview!⊘
Do you want full access?
Subscribe today to unlock all pages.
Trusted by 1+ million students worldwide
1 out of 16
Related Documents


Your All-in-One AI-Powered Toolkit for Academic Success.
+13062052269
info@desklib.com
Available 24*7 on WhatsApp / Email
![[object Object]](/_next/static/media/star-bottom.7253800d.svg)
Unlock your academic potential
Copyright © 2020–2026 A2Z Services. All Rights Reserved. Developed and managed by ZUCOL.