Investments: Portfolio Analysis, CAPM and Fama-French Report

Verified

Added on  2022/09/28

|6
|1070
|24
Report
AI Summary
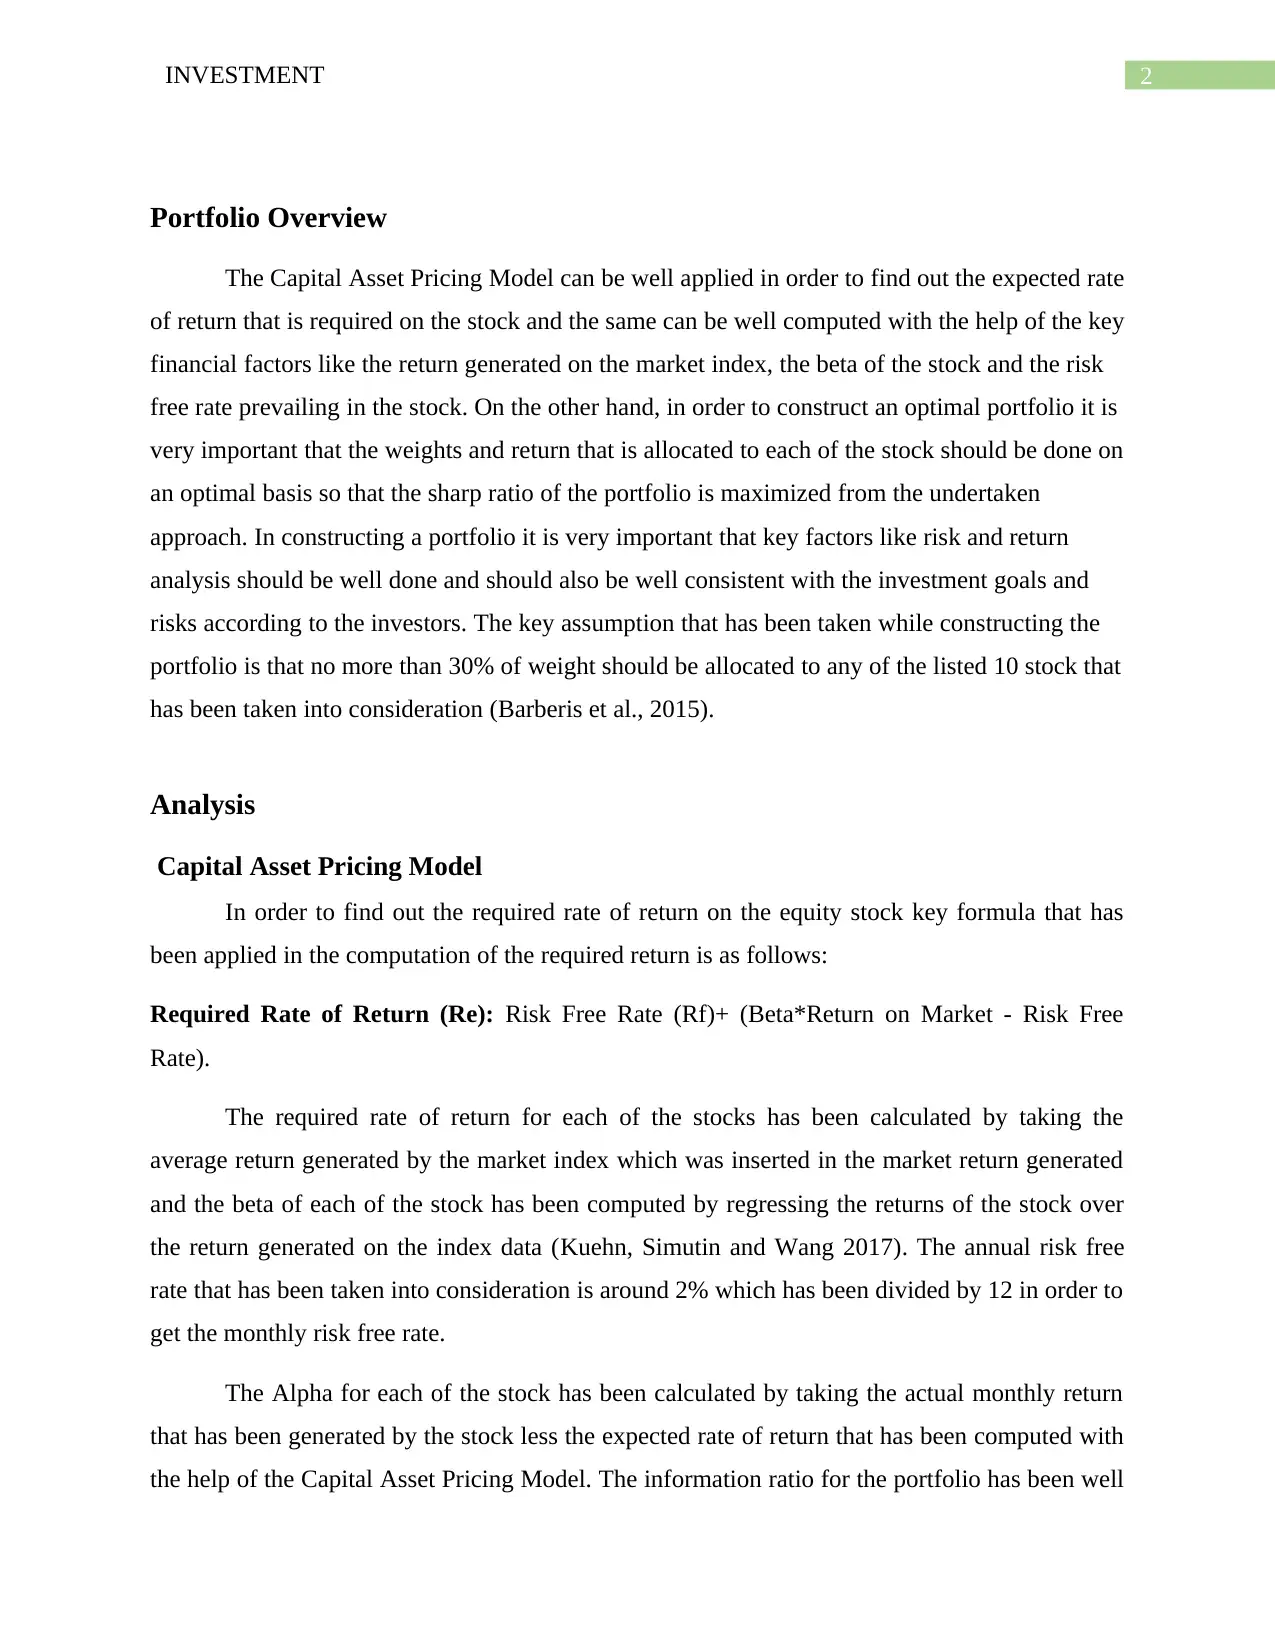
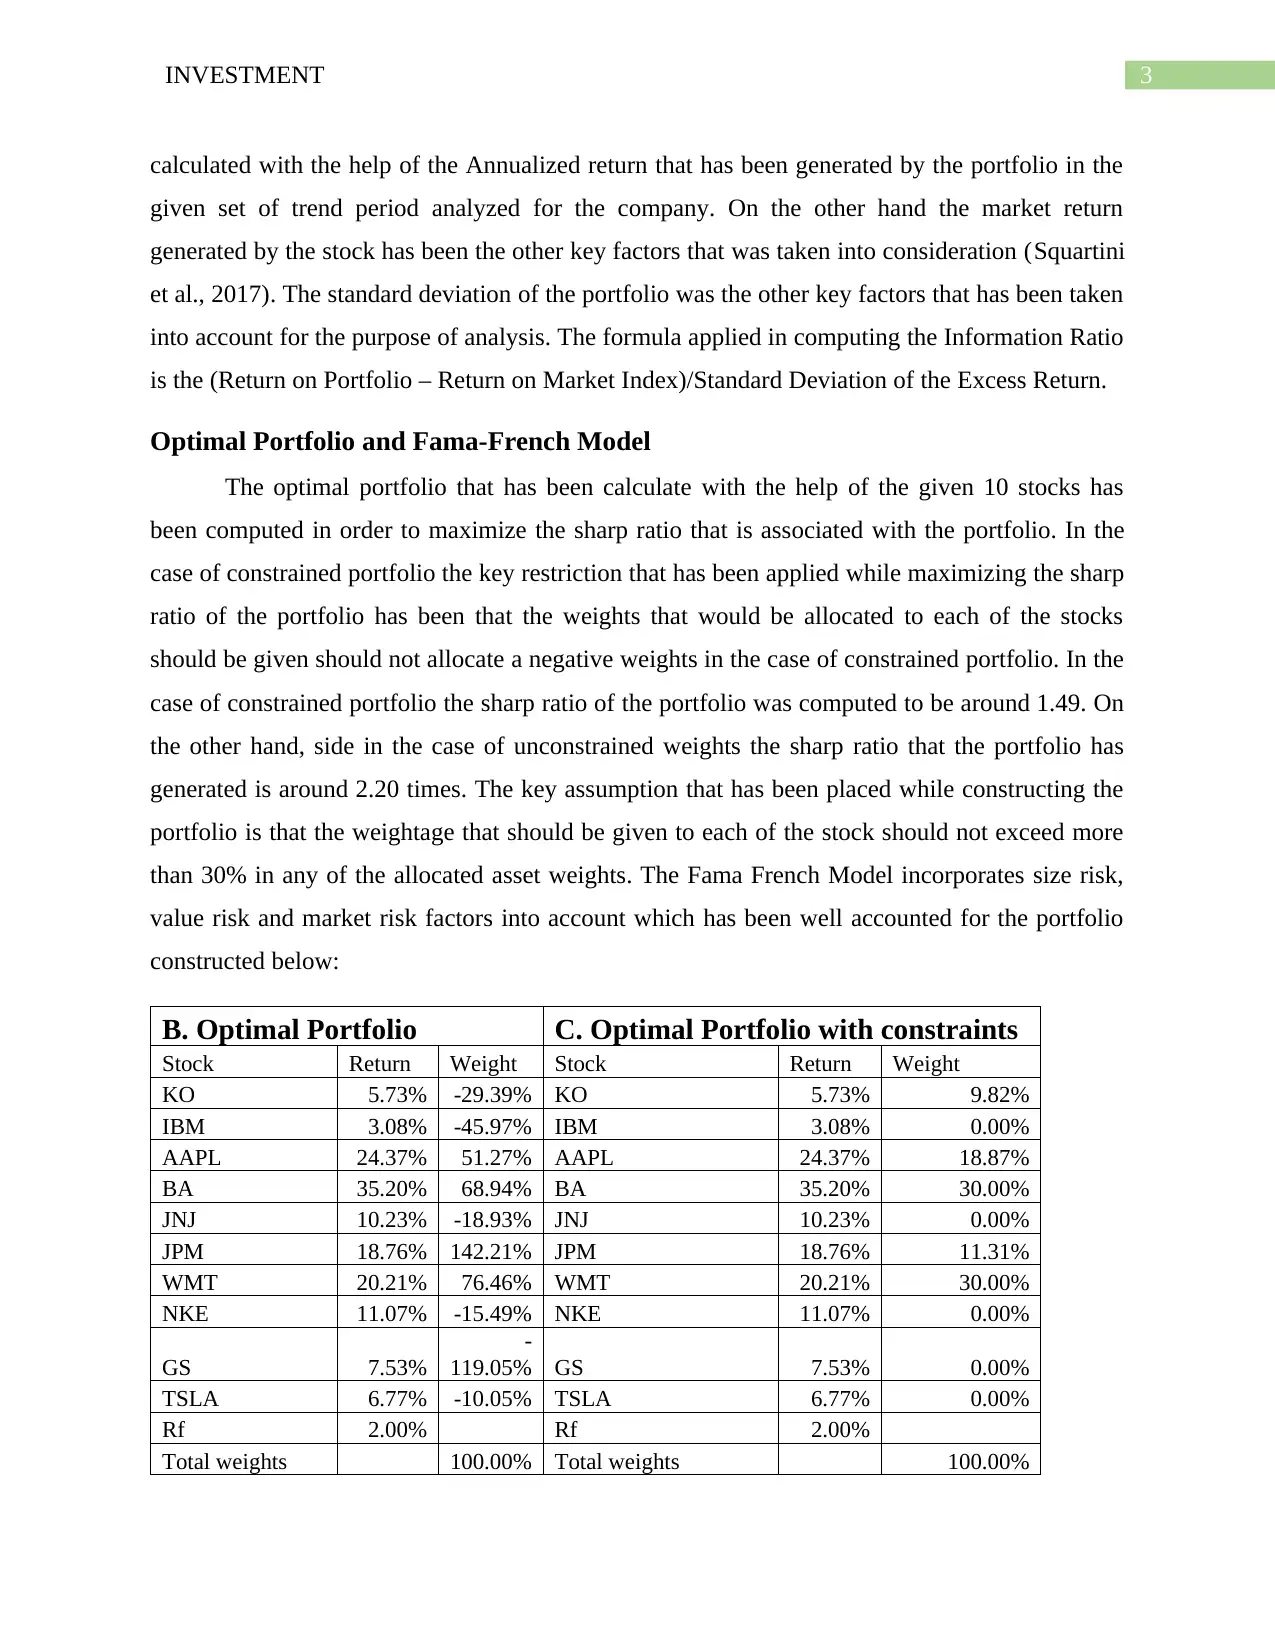
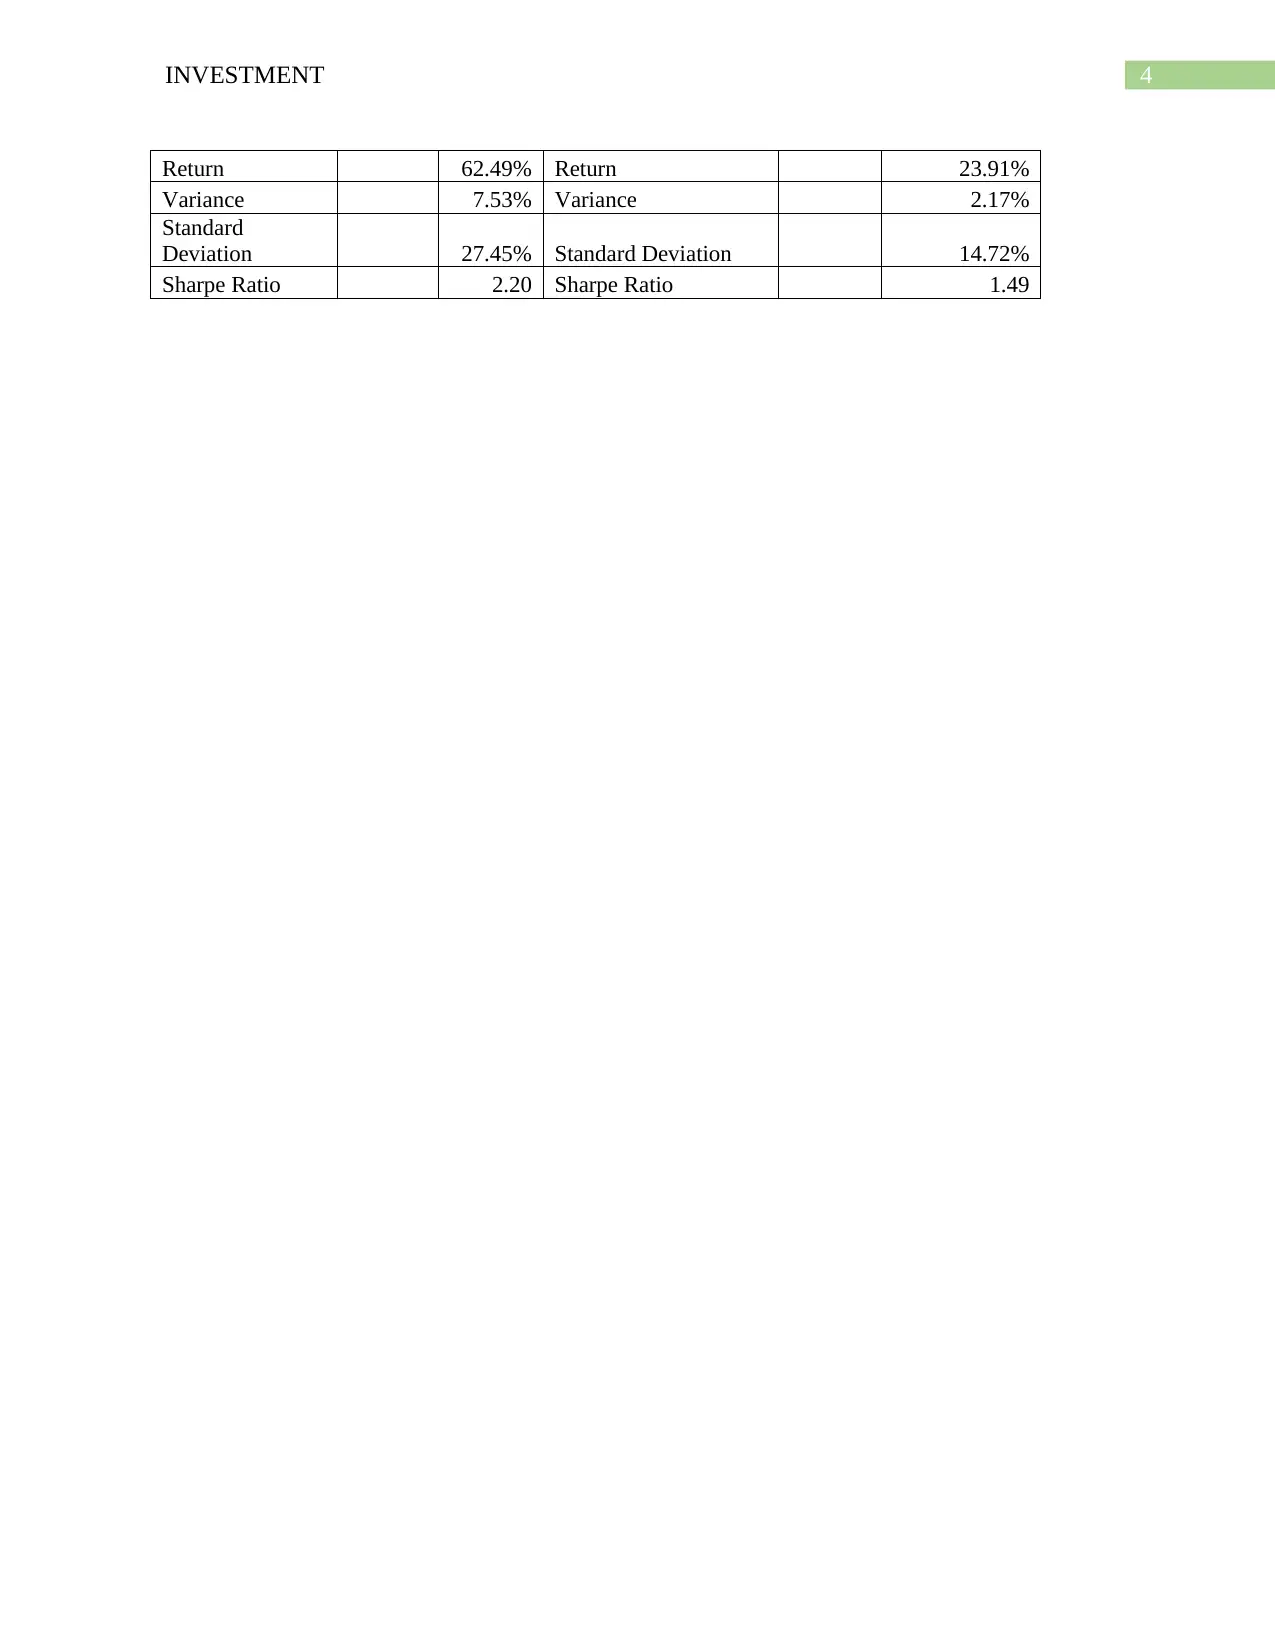
This report provides a comprehensive analysis of an investment portfolio, addressing the key aspects of portfolio construction and optimization. It begins with an overview of the Capital Asset Pricing Model (CAPM) and its application in determining the expected rate of return for stocks. The report then delves into the construction of an optimal portfolio, emphasizing the importance of weight allocation and the maximization of the Sharpe ratio. The analysis includes the construction of portfolios with and without constraints, considering factors such as risk and return, and incorporating the Fama-French model to account for size, value, and market risk factors. The report presents the optimal portfolio weights and returns, along with a comparative analysis of constrained and unconstrained portfolios, providing valuable insights into investment strategies and portfolio management.
Document Page
Running head: INVESTMENTS
Investments
Name of the Student:
Name of the University:
Author’s Note:
tabler-icon-diamond-filled.svg

Paraphrase This Document

Need a fresh take? Get an instant paraphrase of this document with our AI Paraphraser
Document Page
1INVESTMENT
Table of Contents
Portfolio Overview..........................................................................................................................2
Analysis...........................................................................................................................................2
Capital Asset Pricing Model........................................................................................................2
Optimal Portfolio and Fama-French Model................................................................................3
References........................................................................................................................................5
Document Page
2INVESTMENT
Portfolio Overview
The Capital Asset Pricing Model can be well applied in order to find out the expected rate
of return that is required on the stock and the same can be well computed with the help of the key
financial factors like the return generated on the market index, the beta of the stock and the risk
free rate prevailing in the stock. On the other hand, in order to construct an optimal portfolio it is
very important that the weights and return that is allocated to each of the stock should be done on
an optimal basis so that the sharp ratio of the portfolio is maximized from the undertaken
approach. In constructing a portfolio it is very important that key factors like risk and return
analysis should be well done and should also be well consistent with the investment goals and
risks according to the investors. The key assumption that has been taken while constructing the
portfolio is that no more than 30% of weight should be allocated to any of the listed 10 stock that
has been taken into consideration (Barberis et al., 2015).
Analysis
Capital Asset Pricing Model
In order to find out the required rate of return on the equity stock key formula that has
been applied in the computation of the required return is as follows:
Required Rate of Return (Re): Risk Free Rate (Rf)+ (Beta*Return on Market - Risk Free
Rate).
The required rate of return for each of the stocks has been calculated by taking the
average return generated by the market index which was inserted in the market return generated
and the beta of each of the stock has been computed by regressing the returns of the stock over
the return generated on the index data (Kuehn, Simutin and Wang 2017). The annual risk free
rate that has been taken into consideration is around 2% which has been divided by 12 in order to
get the monthly risk free rate.
The Alpha for each of the stock has been calculated by taking the actual monthly return
that has been generated by the stock less the expected rate of return that has been computed with
the help of the Capital Asset Pricing Model. The information ratio for the portfolio has been well
Document Page
3INVESTMENT
calculated with the help of the Annualized return that has been generated by the portfolio in the
given set of trend period analyzed for the company. On the other hand the market return
generated by the stock has been the other key factors that was taken into consideration (Squartini
et al., 2017). The standard deviation of the portfolio was the other key factors that has been taken
into account for the purpose of analysis. The formula applied in computing the Information Ratio
is the (Return on Portfolio – Return on Market Index)/Standard Deviation of the Excess Return.
Optimal Portfolio and Fama-French Model
The optimal portfolio that has been calculate with the help of the given 10 stocks has
been computed in order to maximize the sharp ratio that is associated with the portfolio. In the
case of constrained portfolio the key restriction that has been applied while maximizing the sharp
ratio of the portfolio has been that the weights that would be allocated to each of the stocks
should be given should not allocate a negative weights in the case of constrained portfolio. In the
case of constrained portfolio the sharp ratio of the portfolio was computed to be around 1.49. On
the other hand, side in the case of unconstrained weights the sharp ratio that the portfolio has
generated is around 2.20 times. The key assumption that has been placed while constructing the
portfolio is that the weightage that should be given to each of the stock should not exceed more
than 30% in any of the allocated asset weights. The Fama French Model incorporates size risk,
value risk and market risk factors into account which has been well accounted for the portfolio
constructed below:
B. Optimal Portfolio C. Optimal Portfolio with constraints
Stock Return Weight Stock Return Weight
KO 5.73% -29.39% KO 5.73% 9.82%
IBM 3.08% -45.97% IBM 3.08% 0.00%
AAPL 24.37% 51.27% AAPL 24.37% 18.87%
BA 35.20% 68.94% BA 35.20% 30.00%
JNJ 10.23% -18.93% JNJ 10.23% 0.00%
JPM 18.76% 142.21% JPM 18.76% 11.31%
WMT 20.21% 76.46% WMT 20.21% 30.00%
NKE 11.07% -15.49% NKE 11.07% 0.00%
GS 7.53%
-
119.05% GS 7.53% 0.00%
TSLA 6.77% -10.05% TSLA 6.77% 0.00%
Rf 2.00% Rf 2.00%
Total weights 100.00% Total weights 100.00%
tabler-icon-diamond-filled.svg

Paraphrase This Document

Need a fresh take? Get an instant paraphrase of this document with our AI Paraphraser
Document Page
4INVESTMENT
Return 62.49% Return 23.91%
Variance 7.53% Variance 2.17%
Standard
Deviation 27.45% Standard Deviation 14.72%
Sharpe Ratio 2.20 Sharpe Ratio 1.49
Document Page
5INVESTMENT
References
Barberis, N., Greenwood, R., Jin, L. and Shleifer, A., 2015. X-CAPM: An extrapolative capital
asset pricing model. Journal of financial economics, 115(1), pp.1-24.
Gustafsson, F. and Gustavsson, R., 2019. Testing the Performance of the Capital Asset Pricing
Model and the Fama-French Three-Factor Model-A study on the Swedish Stock Market between
2014-2019.
Kuehn, L.A., Simutin, M. and Wang, J.J., 2017. A labor capital asset pricing model. The Journal
of Finance, 72(5), pp.2131-2178.
Squartini, T., Almog, A., Caldarelli, G., Van Lelyveld, I., Garlaschelli, D. and Cimini, G., 2017.
Enhanced capital-asset pricing model for the reconstruction of bipartite financial
networks. Physical Review E, 96(3), p.032315.
chevron_up_icon
1 out of 6
circle_padding
hide_on_mobile
zoom_out_icon