Validity and Reliability of the Myers-Briggs Personality Type Indicator: A Systematic Review and Meta-analysis
VerifiedAdded on 2022/12/30
|28
|12353
|44
AI Summary
This comprehensive literature search identified 221 potential studies, of which seven met our inclusion criteria. Results indicate that the Extravert-Introvert, Sensing-Intuition, and Judging-Perceiving Subscales have satisfactory reliabilities of .75 or higher and that the Thinking-Feeling subscale has a reliability of .61.
Contribute Materials
Your contribution can guide someone’s learning journey. Share your
documents today.
J Best Pract Health Prof Divers (Spring, 2017), 10(1), 1–27.
ISSN: 2745-2843 © Winston-Salem State University
ORIGINAL RESEARCH
Validity and Reliability of the
Myers-Briggs Personality Type Indicator
A Systematic Review and Meta-analysis
Ken Randall,1 PhD, MHR, PT; Mary Isaacson,1 EdD;
Carrie Ciro,1 PhD, OTR/L, FAOTA
Author Affiliations:1Department of Rehabilitation Sciences, University of Oklahoma Health
Sciences Center, Tulsa and Oklahoma City, Oklahoma
Corresponding Author: Ken Randall, Department of Rehabilitation Sciences, University
of Oklahoma Schusterman Center, 4502 East 41st Street, Room 2H20, Tulsa, OK 74135
(Ken-Randall@ouhsc.edu)
ABSTRACT
The Myers-Briggs Type Indicator is frequently used by health professions and educationa
programs to address the diversity of personalities that exist. No systematic review of the
ture or meta-analysis of its validity and reliability has occurred. This comprehensive liter
search identified 221 potential studies, of which seven met our inclusion criteria. Four of
studies examined construct validity, but their varying methods did not permit pooling fo
meta-analysis. These studies agree that the instrument has reasonable construct validity
three studies of test-retest reliability did allow a meta-analysis to be performed, albeit w
tion due to substantial heterogeneity. Results indicate that the Extravert-Introvert, Sens
Intuition, and Judging-Perceiving Subscales have satisfactory reliabilities of .75 or higher
that the Thinking-Feeling subscale has a reliability of .61. The majority of studies were co
ducted on college-age students; thus, the evidence to support the tool’s utility applies m
to this group, and careful thought should be given when applying it to other individuals.
Keywordsn Myers-Briggs Type Indicatorn Personalityn Reliabilityn Validity
Secure Best Marks with AI Grader
Need help grading? Try our AI Grader for instant feedback on your assignments.
2 J Best Pract Health Prof Divers:Vol. 10, No. 1, Spring 2017
INTRODUCTION
Personality is a commonly used term with a meaning that most of us readily comprehe
yet it is an elusive concept to fully describe or quantify. Broadly defined, it is the comb
of an individual’s cognitive, emotional, attitudinal, and behavioral response patterns (A
2009; McAdams, 2009). It has been studied since antiquity, with Hippocrates being am
the first to describe personality by grouping individuals into temperaments that relate
particular characteristics or types (Hippocrates 1923). Since then, countless theo
instruments have attempted to explicate and measure differences in personality more
Included in these instruments is the Myers-Briggs Type Indicator (MBTI), which is repo
to be one of the most widely used instruments in the world for understanding persona
differences (Briggs Myers, 1998; Jackson, Parker, & Dipboye, 1996; Lorr, 1991; Saggin
Kline, 1996; Salter, Evans, & Forney, 2006; Tzeng, Outcalt, Boyer, Ware, & Landis, 198
Zumbo & Taylor, 1993).
The MBTI is used extensively in human resource management and is one of the mo
commonly used instruments in higher education research and counseling (Hojat, Erdm
& Gonnella, 2013). Its application in medical education is quite varied and includes stu
of how certain preferences affect decision making (Pretz & Folse, 2011) and how know
of an individual’s type can enhance communication (Eksteen & Basson, 2015). Moreov
addressing the differences in type and preferences between instructors and students m
mize negative outcomes in both academic and clinical settings (Bell et al., 2011). In th
thors’ experience, we use the MBTI as both an educational and an academic adviseme
Our occupational therapy and physical therapy students learn about the 16 MBTI types
about how differing preferences can influence interactions with members of the health
team and with patients and their loved ones. We also provide academic advisors and c
instructors with information about individual student types that includes tips grounded
the MBTI literature on how to enhance their learning, communication, and feedback ba
on each student’s preference. Although we pay attention to the preferences of all stud
we also examine the preferences of learners from diverse backgrounds to determine i
trends exist in personality type. In an ongoing effort to use the best evidence to inform
educational program, we wanted to understand the psychometric properties of the MB
determine whether we should continue to use it with our students.
Since its inception in the 1940s, numerous studies have examined various aspects
MBTI, including many related to validity and reliability. Over the past 35 years, a numb
of relatively thorough reviews of the literature regarding these features of the MBTI ha
peared (Carlson, 1985; Carlyn, 1977; Gardner & Martinko, 1996; Murray, 1990; Pitteng
1993), including a compendium of research by the publishers of the tool itself (Thorne
Gough, 1999). However, none of these reviews was systematic in nature, nor did any a
Myers-Briggs Personality Type Indicator 3
the guidelines of the Cochrane Collaboration (2016), considered the standard for comp
hensive literature searches (Sampson et al., 2006) and quality appraisal. In 2002, Cap
and Capraro conducted a meta-analytic reliability generalization study of articles inves
a number of the psychometric properties of the MBTI; however, the scope of the study
limited to articles published between 1998 and 2001. To date, we could find no compl
systematic review of the literature or in-depth meta-analysis of studies that meet the
suggested by the Cochrane Collaboration to assess the psychometric properties of the
THE MYERS BRIGGS TYPE INDICATOR
The MBTI measures the degree to which an individual prefers to operate from four dic
mous type pairs using a series of forced-choice questions that represent behavioral pr
ences. In accord with Jung’s theory of types, it proposes that everyone has a natural p
for one of the two opposites on each of four scales, emphasizing that one preference i
better than another. According to supporters of the MBTI, this distinguishes it from mo
psychological assessments, which quantify personality traits, many of which consider
of the scale to be more positive and the other more negative (Schaubhut, Herk, & Tho
2009, p. 4). The MBTI emphasizes the word preference and uses single letters of the a
to denote its eight preferences. The definitions for each MBTI preference show a distin
with Jung’s original definitions:
Extraversion (E) is the tendency to focus on the outer world of people and
external events. People who prefer extraversion direct their energy and at-
tention outward and receive energy from external events, experiences, and
interactions.
Introversion (I) is the preference to focus on the inner world of ideas and ex-
periences. Individuals direct their energy and attention inward and receive
energy from their internal thoughts, feelings, reflections, and time alone.
Sensing (S) is the preference to take information in through the eyes, ears,
and other senses. People who are predominantly sensing are observant of
what is going on around them and are especially good at recognizing the
practical realities of a situation.
Intuition (N) is the ability to take in information by seeing the big picture,
focusing on relationships and connections between facts. People who prefer
intuition tend to grasp patterns and are especially adept at seeing new pos-
sibilities and different perspectives.
4 J Best Pract Health Prof Divers:Vol. 10, No. 1, Spring 2017
Thinking (T) is the preference in decision making to look at the logical con-
sequences of a choice or action. People who prefer this type try to mentally
remove themselves from a situation to examine it objectively and analyze
cause and effect.
Feeling (F) is the use of emotion in decision making, and people with this
preference tend to consider what is important to them and to other people.
They mentally place themselves in a situation and identify with the people
involved so that they can make decisions based on person-centered values.
Judging (J) is the preference to organize life in a planned, orderly way, with
a desire to regulate and control it. People who prefer judging make deci-
sions, achieve closure, and appreciate an environment that is structured
and organized.
Perceiving (P) is the tendency to live in a flexible, spontaneous way, seeking
to experience and understand life rather than control it. People who are
perceiving prefer to be open to experience and last-minute options. They
enjoy and trust their resourcefulness and ability to adapt to the demands of
a situation (Briggs-Myers, 1993; Hall & Nordby, 1973).
The MBTI treats each preference equally, so there are no principal functions or sub
ordinate functions as described by Jung. Given four sets of dichotomous preferences th
can occur in any combination, the MBTI proposes that there are sixteen different perso
types. With the MBTI, four letters represent each type, which indicate the four domina
preference areas. For example, ENFP is Extraversion Intuitive Feeling Perceiving, whic
its own set of characteristics, some like and some different from the other fifteen type
lar to Jung’s work in Psychological Types (1923), the MBTI addresses various combinat
each type, such as introverted-sensing or intuitive-thinking-perceiving. The MBTI allow
user to describe two people with the exact four-letter combination of preferences in ge
ties similar to both, yet accounts for the individual differences produced by variation o
extent (or strength) of each person’s preference. This echoes Jung’s belief that his typ
be used to describe groups of people as well as individuals (Jung, 1921/1923).
According to the companion manual to the MBTI, Introduction to Type (Briggs Myer
1998; Myers, Kirby, & Briggs Meyers, 2015), which was first published in 1970 and is c
in its seventh edition, the goal of the instrument is to foster self-understanding, enhan
learning and communication, assist with conflict management, and enhance relationsh
is a tool “with intent not to stereotype, but to allow understanding of individual prefere
(Jessup, 2002, p. 503). Between 1943 and 1975, the MBTI evolved through a number o
tions, spanning Forms A through F. In 1975 Consulting Psychologist Press acquired the
Secure Best Marks with AI Grader
Need help grading? Try our AI Grader for instant feedback on your assignments.
Myers-Briggs Personality Type Indicator 5
to sell the MBTI as a proprietary instrument (Pittenger, 1993), and it became readily a
for widespread use as Form G (McCaulley, 1990). In 1998, Form G underwent revision
was published as Form M, which can be administered by the publisher, by computer, o
using a self-scorable version. Additionally, two MBTI instruments that explore type mo
deeply are the Step II (first published as Form K in 1989 and subsequently revised as F
in 2001) and Step III (published in 2009). Step II explores differences within the same
and Step III is administered only by counselors specifically trained in the tool in one-on
sessions (Myers, McCaulley, Quenk, & Mitchell, 2009). There are currently four distinct
forms of the MBTI, each differing in its use and scoring: Form M and Form M self-scora
Step II Form Q, and Step III. The MBTI has a European version and has been translated
21 languages, including Chinese, German, Italian, Japanese, Norwegian, and Spanish (
& Briggs Foundation, 2016).
Most criticisms of the MBTI relate to the dichotomous nature of the instrument, its
translation of continuous scale scores into nominal categories of preference, and whet
reflects the theory on which it is based (Barbuto, 1997; Daisly, 2011; Pittenger, 1993;
1992). The forced-choice nature of the MBTI does not allow respondents to select a me
or neutral response (Barbuto, 1997); they must choose a response that places them in
preference or the other (either Extraversion or Introversion, Sensing or iNtuition, Think
or Feeling, Judging or Perceiving). Scoring for the MBTI reflects the most frequently se
side of the four dichotomies, which determines preference, reflected in the four-letter
bination that expresses overall type. Barbuto (1997) suggests that this nominal
the MBTI results deviates from Jung’s original theory. These observations lead to ques
regarding the validity and reliability of the MBTI (Zemke, 1992).
Key properties of an assessment tool such as the MBTI are validity and reliability. T
relate to aspects of its construction, evaluation, and documentation as described by th
dards for Educational and Psychological Testing (American Educational Research Asso
tion, American Psychological Association, & National Council on Measurement in Educa
tion, 2014). Validity is the degree to which evidence and theory support the interpreta
of scores for the proposed uses of the test. Construct validity refers to the extent to w
actually measures what the theory says it does. Reliability is the degree to which scor
individual or group are consistent over repeated administrations of the same test. Tes
reliability assesses the degree to which test scores are consistent from one test admin
to the next. Internal consistency reliability assesses the stability of results across item
test (American Educational Research Association, American Psychological Association,
National Council on Measurement in Education, 2014, chaps. 1, 2).
At present, no complete study has investigated the breadth of articles published ab
the MBTI or performed an in-depth analysis of the psychometric properties of the instr
ment as a whole or its various forms. This systematic review/meta-analysis seeks to in
our research question: in the adult population, is the MBTI a useful test in terms of con
6 J Best Pract Health Prof Divers:Vol. 10, No. 1, Spring 2017
validity, test-retest reliability, and/or internal consistency reliability in determining per
ity preference in the areas of inward or outward focus (extraversion/introversion), info
tion processing (sensing/intuition), decision making (thinking/feeling), and organiz
(judging/perceiving)?
METHODS
Rationale for Methods
This systematic review of the key psychometric properties of the MBTI adhered
Cochrane guidelines and consisted of a priori identification of inclusion criteria,
determined our search strategy, followed by a two-phase process of critical appraisal o
cluded studies with the intent to extract data for analysis. Inclusion criteria for this rev
incorporated the Cochrane Collaboration guidelines (Cochrane Collaboration Diagnosti
Test Accuracy Working Group 2011; Deeks, Wisniewski, & Davenport, 2013; Higgins et
2011) and contained questions extracted from its tool for assessing risk of bias (Higgin
man, 2008), as well as strategies for systematic reviews proposed by Meline (2006) an
(1986). Some Cochrane criteria, such as those pertaining to randomized controlled tria
multiple-group designs, were not applicable and thus not used. Other recommended c
were incorporated into the rubric we applied to assess each article’s quality.
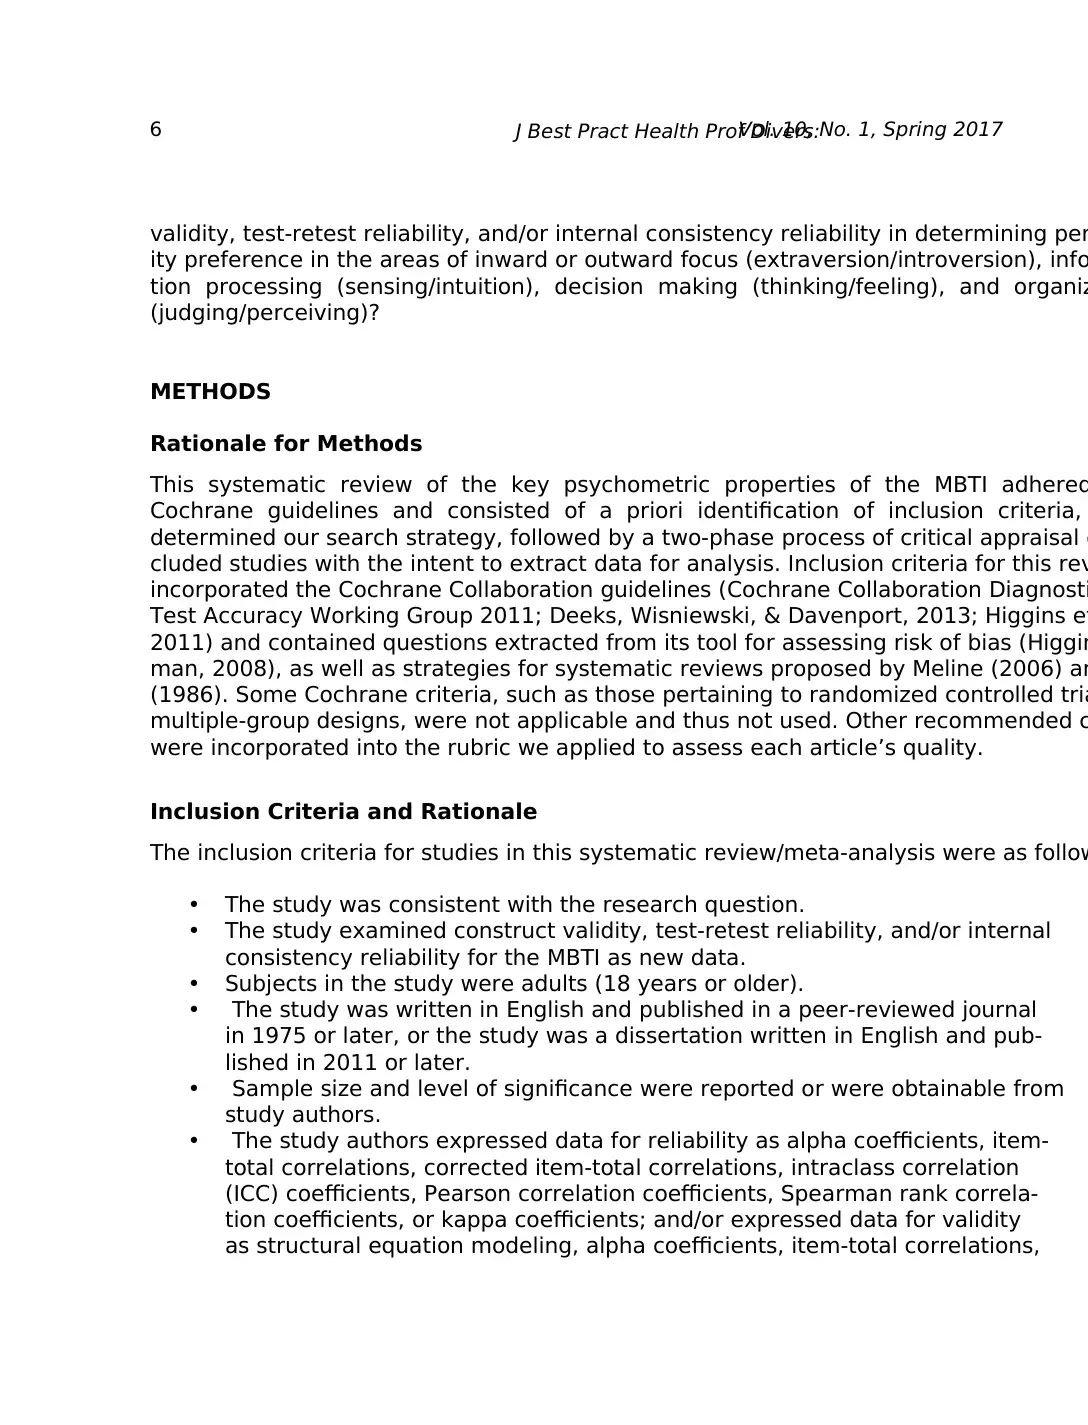
Inclusion Criteria and Rationale
The inclusion criteria for studies in this systematic review/meta-analysis were as follow
• The study was consistent with the research question.
• The study examined construct validity, test-retest reliability, and/or internal
consistency reliability for the MBTI as new data.
• Subjects in the study were adults (18 years or older).
• The study was written in English and published in a peer-reviewed journal
in 1975 or later, or the study was a dissertation written in English and pub-
lished in 2011 or later.
• Sample size and level of significance were reported or were obtainable from
study authors.
• The study authors expressed data for reliability as alpha coefficients, item-
total correlations, corrected item-total correlations, intraclass correlation
(ICC) coefficients, Pearson correlation coefficients, Spearman rank correla-
tion coefficients, or kappa coefficients; and/or expressed data for validity
as structural equation modeling, alpha coefficients, item-total correlations,
validity, test-retest reliability, and/or internal consistency reliability in determining per
ity preference in the areas of inward or outward focus (extraversion/introversion), info
tion processing (sensing/intuition), decision making (thinking/feeling), and organiz
(judging/perceiving)?
METHODS
Rationale for Methods
This systematic review of the key psychometric properties of the MBTI adhered
Cochrane guidelines and consisted of a priori identification of inclusion criteria,
determined our search strategy, followed by a two-phase process of critical appraisal o
cluded studies with the intent to extract data for analysis. Inclusion criteria for this rev
incorporated the Cochrane Collaboration guidelines (Cochrane Collaboration Diagnosti
Test Accuracy Working Group 2011; Deeks, Wisniewski, & Davenport, 2013; Higgins et
2011) and contained questions extracted from its tool for assessing risk of bias (Higgin
man, 2008), as well as strategies for systematic reviews proposed by Meline (2006) an
(1986). Some Cochrane criteria, such as those pertaining to randomized controlled tria
multiple-group designs, were not applicable and thus not used. Other recommended c
were incorporated into the rubric we applied to assess each article’s quality.
Inclusion Criteria and Rationale
The inclusion criteria for studies in this systematic review/meta-analysis were as follow
• The study was consistent with the research question.
• The study examined construct validity, test-retest reliability, and/or internal
consistency reliability for the MBTI as new data.
• Subjects in the study were adults (18 years or older).
• The study was written in English and published in a peer-reviewed journal
in 1975 or later, or the study was a dissertation written in English and pub-
lished in 2011 or later.
• Sample size and level of significance were reported or were obtainable from
study authors.
• The study authors expressed data for reliability as alpha coefficients, item-
total correlations, corrected item-total correlations, intraclass correlation
(ICC) coefficients, Pearson correlation coefficients, Spearman rank correla-
tion coefficients, or kappa coefficients; and/or expressed data for validity
as structural equation modeling, alpha coefficients, item-total correlations,
Myers-Briggs Personality Type Indicator 7
corrected-item total correlations, ICCs, Pearson r, Spearman r, kappa, or
item-level ICCs or factor analysis.
The publication date of 1975 or later was selected based on the assertion by McCa
ley (1990) that in 1975 the MBTI was readily accessible for use. We elected to study a
the three forms of the MBTI (Form F, G, or M) that were in use from 1975 to the presen
day, since they all measure the same theoretical construct and are simply refinements
instrument. We did not use any articles related to the MBTI Step II or Step III instrume
because these are different versions of the MBTI that are scored only through the pub
or by a certified MBTI counselor, and more pragmatically, no studies were found when
conducted our literature search. Given the potential time lapse between completing a
sertation and submitting it for publication, we selected five years as sufficient time to
dissertation that was completed longer than five years ago likely will not have been ac
for publication due to failure to meet certain quality thresholds (Meline, 2006). If a stu
not report its level of significance (alpha) and we could not confirm it with study autho
excluded it from analysis.
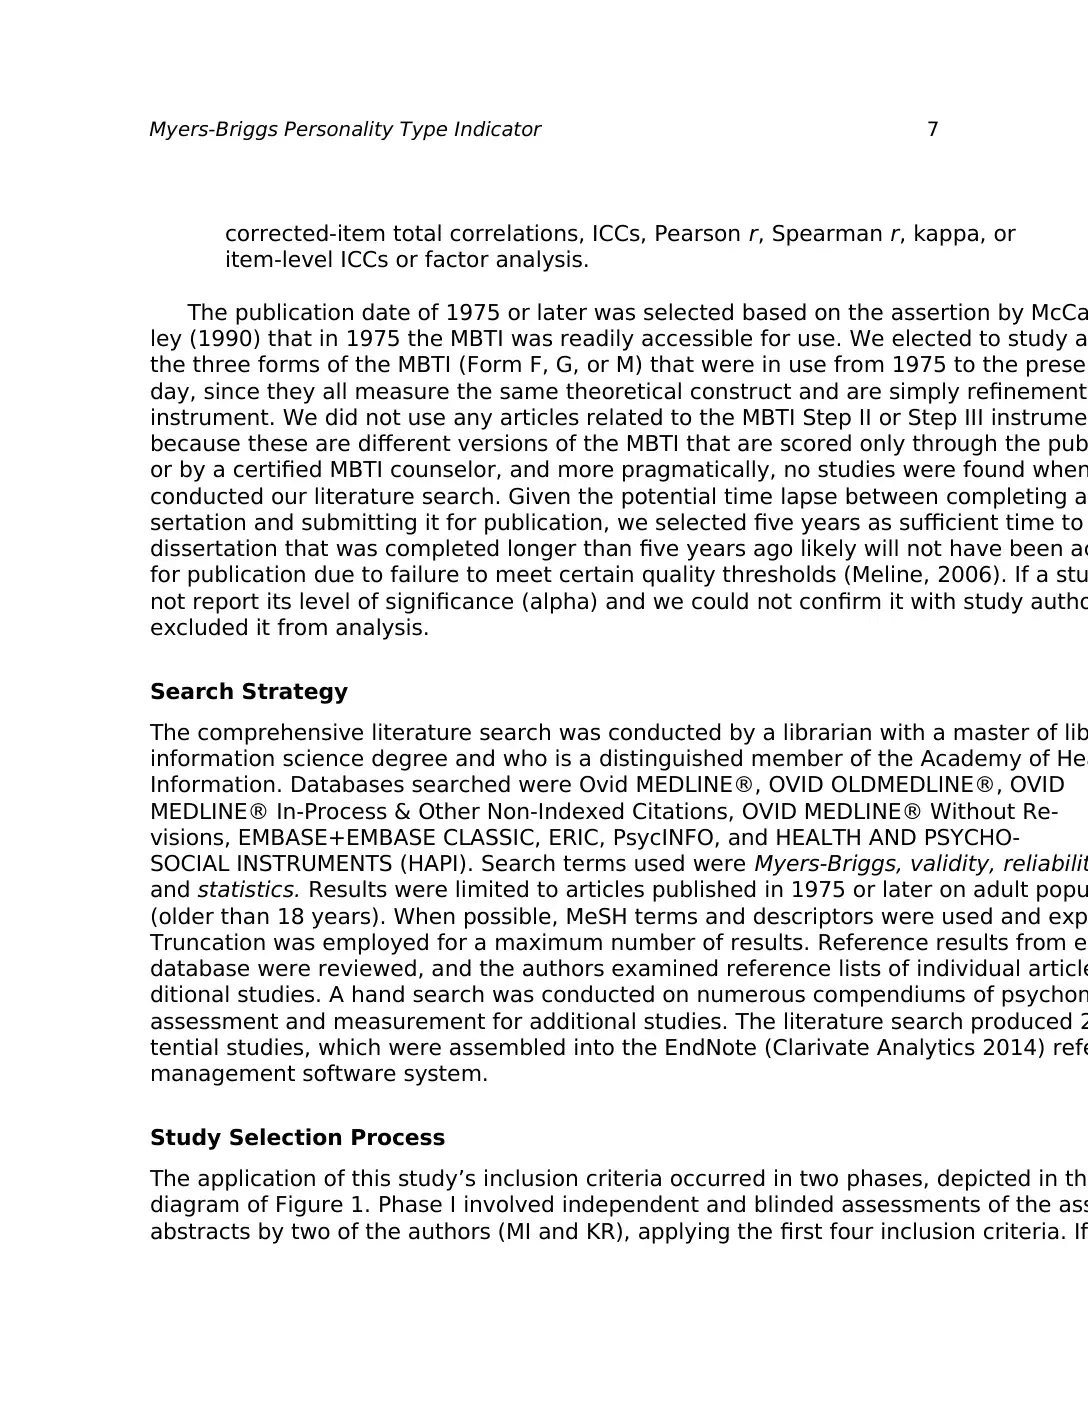
Search Strategy
The comprehensive literature search was conducted by a librarian with a master of lib
information science degree and who is a distinguished member of the Academy of Hea
Information. Databases searched were Ovid MEDLINE®, OVID OLDMEDLINE®, OVID
MEDLINE® In-Process & Other Non-Indexed Citations, OVID MEDLINE® Without Re-
visions, EMBASE+EMBASE CLASSIC, ERIC, PsycINFO, and HEALTH AND PSYCHO-
SOCIAL INSTRUMENTS (HAPI). Search terms used were Myers-Briggs, validity, reliabilit
and statistics. Results were limited to articles published in 1975 or later on adult popu
(older than 18 years). When possible, MeSH terms and descriptors were used and exp
Truncation was employed for a maximum number of results. Reference results from ea
database were reviewed, and the authors examined reference lists of individual article
ditional studies. A hand search was conducted on numerous compendiums of psychom
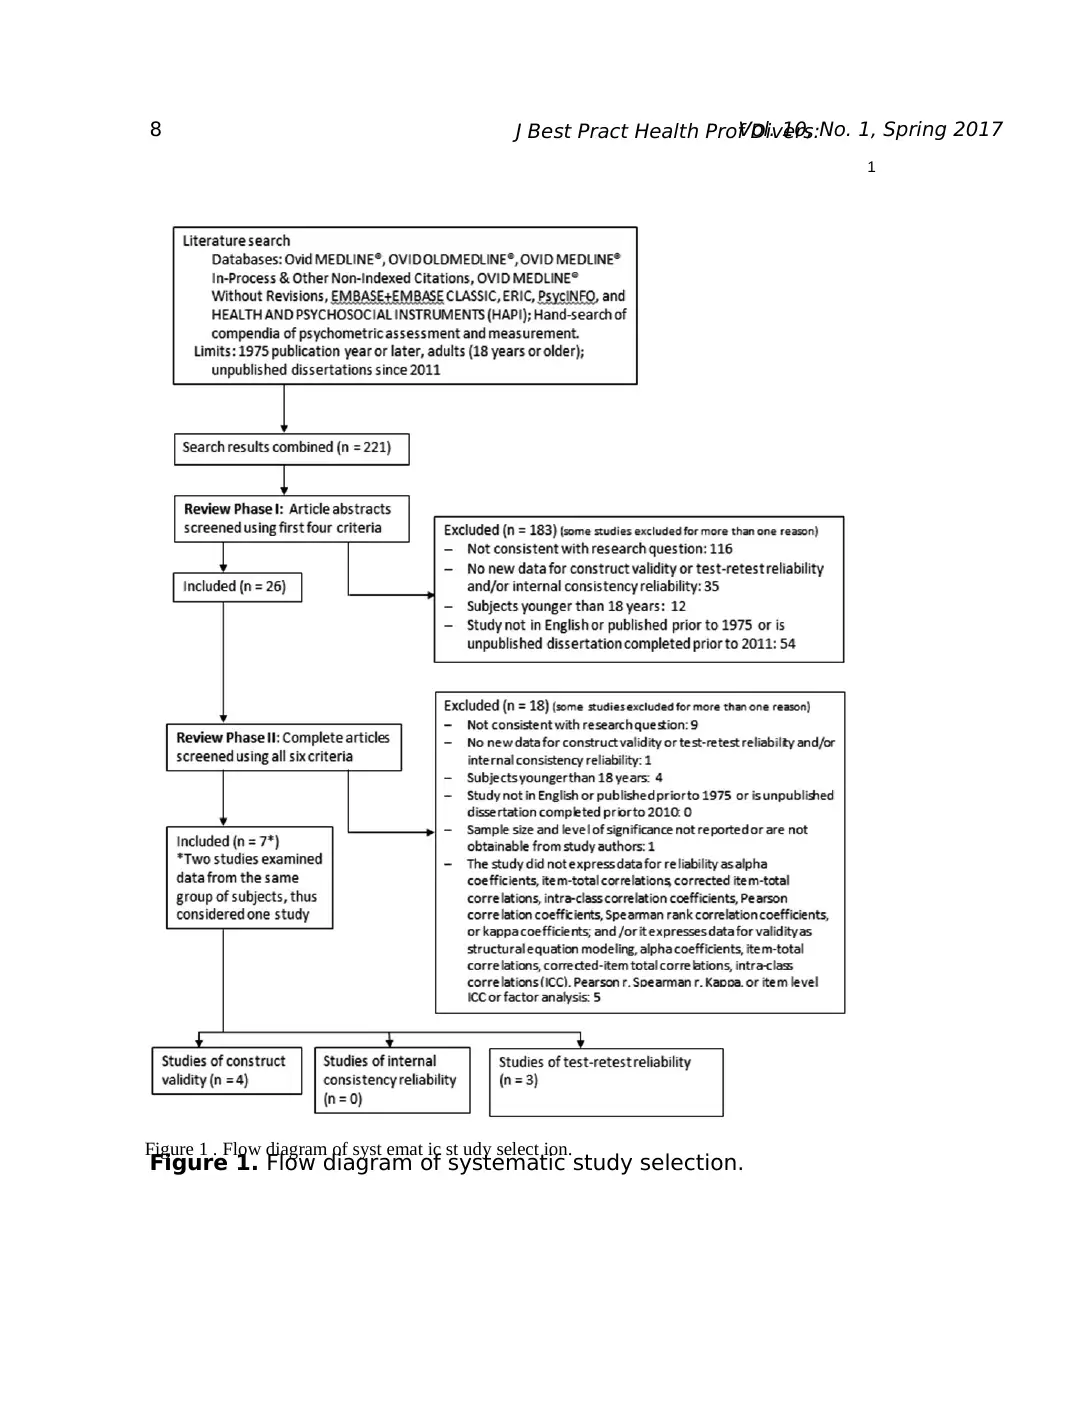
assessment and measurement for additional studies. The literature search produced 2
tential studies, which were assembled into the EndNote (Clarivate Analytics 2014) refe
management software system.
Study Selection Process
The application of this study’s inclusion criteria occurred in two phases, depicted in the
diagram of Figure 1. Phase I involved independent and blinded assessments of the ass
abstracts by two of the authors (MI and KR), applying the first four inclusion criteria. If
corrected-item total correlations, ICCs, Pearson r, Spearman r, kappa, or
item-level ICCs or factor analysis.
The publication date of 1975 or later was selected based on the assertion by McCa
ley (1990) that in 1975 the MBTI was readily accessible for use. We elected to study a
the three forms of the MBTI (Form F, G, or M) that were in use from 1975 to the presen
day, since they all measure the same theoretical construct and are simply refinements
instrument. We did not use any articles related to the MBTI Step II or Step III instrume
because these are different versions of the MBTI that are scored only through the pub
or by a certified MBTI counselor, and more pragmatically, no studies were found when
conducted our literature search. Given the potential time lapse between completing a
sertation and submitting it for publication, we selected five years as sufficient time to
dissertation that was completed longer than five years ago likely will not have been ac
for publication due to failure to meet certain quality thresholds (Meline, 2006). If a stu
not report its level of significance (alpha) and we could not confirm it with study autho
excluded it from analysis.
Search Strategy
The comprehensive literature search was conducted by a librarian with a master of lib
information science degree and who is a distinguished member of the Academy of Hea
Information. Databases searched were Ovid MEDLINE®, OVID OLDMEDLINE®, OVID
MEDLINE® In-Process & Other Non-Indexed Citations, OVID MEDLINE® Without Re-
visions, EMBASE+EMBASE CLASSIC, ERIC, PsycINFO, and HEALTH AND PSYCHO-
SOCIAL INSTRUMENTS (HAPI). Search terms used were Myers-Briggs, validity, reliabilit
and statistics. Results were limited to articles published in 1975 or later on adult popu
(older than 18 years). When possible, MeSH terms and descriptors were used and exp
Truncation was employed for a maximum number of results. Reference results from ea
database were reviewed, and the authors examined reference lists of individual article
ditional studies. A hand search was conducted on numerous compendiums of psychom
assessment and measurement for additional studies. The literature search produced 2
tential studies, which were assembled into the EndNote (Clarivate Analytics 2014) refe
management software system.
Study Selection Process
The application of this study’s inclusion criteria occurred in two phases, depicted in the
diagram of Figure 1. Phase I involved independent and blinded assessments of the ass
abstracts by two of the authors (MI and KR), applying the first four inclusion criteria. If
Paraphrase This Document
Need a fresh take? Get an instant paraphrase of this document with our AI Paraphraser
8 J Best Pract Health Prof Divers:Vol. 10, No. 1, Spring 2017
Figure 1. Flow diagram of systematic study selection.
1
Figure 1 . Flow diagram of syst emat ic st udy select ion.
Figure 1. Flow diagram of systematic study selection.
1
Figure 1 . Flow diagram of syst emat ic st udy select ion.
Myers-Briggs Personality Type Indicator 9
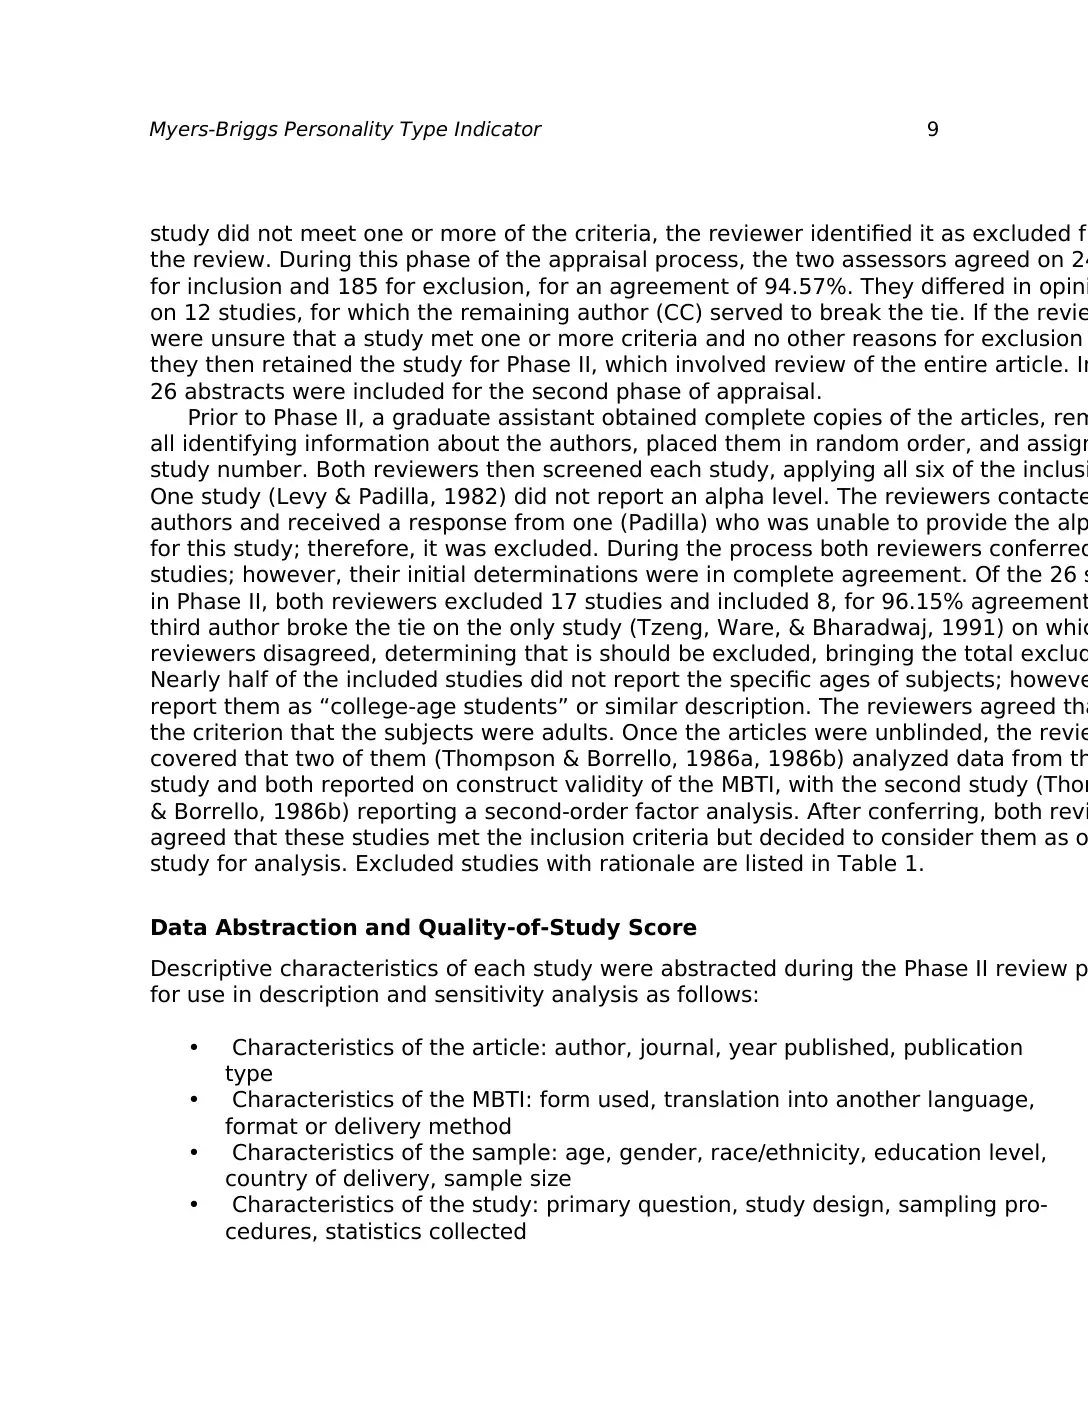
study did not meet one or more of the criteria, the reviewer identified it as excluded fr
the review. During this phase of the appraisal process, the two assessors agreed on 24
for inclusion and 185 for exclusion, for an agreement of 94.57%. They differed in opini
on 12 studies, for which the remaining author (CC) served to break the tie. If the revie
were unsure that a study met one or more criteria and no other reasons for exclusion
they then retained the study for Phase II, which involved review of the entire article. In
26 abstracts were included for the second phase of appraisal.
Prior to Phase II, a graduate assistant obtained complete copies of the articles, rem
all identifying information about the authors, placed them in random order, and assign
study number. Both reviewers then screened each study, applying all six of the inclusi
One study (Levy & Padilla, 1982) did not report an alpha level. The reviewers contacte
authors and received a response from one (Padilla) who was unable to provide the alp
for this study; therefore, it was excluded. During the process both reviewers conferred
studies; however, their initial determinations were in complete agreement. Of the 26 s
in Phase II, both reviewers excluded 17 studies and included 8, for 96.15% agreement
third author broke the tie on the only study (Tzeng, Ware, & Bharadwaj, 1991) on whic
reviewers disagreed, determining that is should be excluded, bringing the total exclud
Nearly half of the included studies did not report the specific ages of subjects; howeve
report them as “college-age students” or similar description. The reviewers agreed tha
the criterion that the subjects were adults. Once the articles were unblinded, the revie
covered that two of them (Thompson & Borrello, 1986a, 1986b) analyzed data from th
study and both reported on construct validity of the MBTI, with the second study (Thom
& Borrello, 1986b) reporting a second-order factor analysis. After conferring, both revi
agreed that these studies met the inclusion criteria but decided to consider them as o
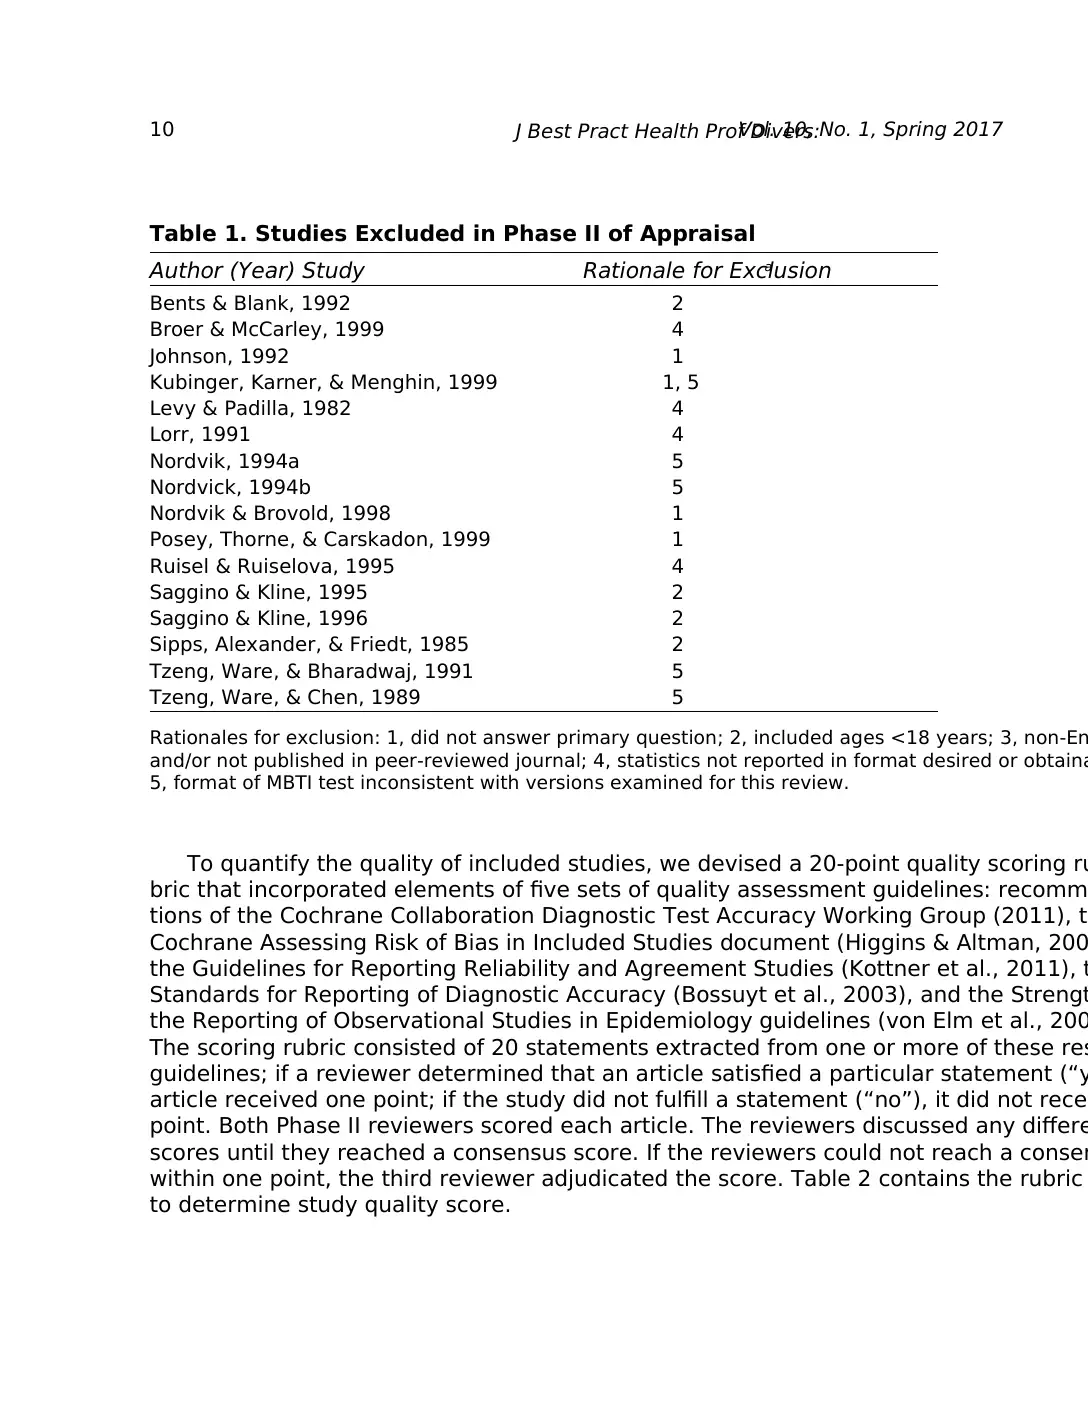
study for analysis. Excluded studies with rationale are listed in Table 1.
Data Abstraction and Quality-of-Study Score
Descriptive characteristics of each study were abstracted during the Phase II review p
for use in description and sensitivity analysis as follows:
• Characteristics of the article: author, journal, year published, publication
type
• Characteristics of the MBTI: form used, translation into another language,
format or delivery method
• Characteristics of the sample: age, gender, race/ethnicity, education level,
country of delivery, sample size
• Characteristics of the study: primary question, study design, sampling pro-
cedures, statistics collected
study did not meet one or more of the criteria, the reviewer identified it as excluded fr
the review. During this phase of the appraisal process, the two assessors agreed on 24
for inclusion and 185 for exclusion, for an agreement of 94.57%. They differed in opini
on 12 studies, for which the remaining author (CC) served to break the tie. If the revie
were unsure that a study met one or more criteria and no other reasons for exclusion
they then retained the study for Phase II, which involved review of the entire article. In
26 abstracts were included for the second phase of appraisal.
Prior to Phase II, a graduate assistant obtained complete copies of the articles, rem
all identifying information about the authors, placed them in random order, and assign
study number. Both reviewers then screened each study, applying all six of the inclusi
One study (Levy & Padilla, 1982) did not report an alpha level. The reviewers contacte
authors and received a response from one (Padilla) who was unable to provide the alp
for this study; therefore, it was excluded. During the process both reviewers conferred
studies; however, their initial determinations were in complete agreement. Of the 26 s
in Phase II, both reviewers excluded 17 studies and included 8, for 96.15% agreement
third author broke the tie on the only study (Tzeng, Ware, & Bharadwaj, 1991) on whic
reviewers disagreed, determining that is should be excluded, bringing the total exclud
Nearly half of the included studies did not report the specific ages of subjects; howeve
report them as “college-age students” or similar description. The reviewers agreed tha
the criterion that the subjects were adults. Once the articles were unblinded, the revie
covered that two of them (Thompson & Borrello, 1986a, 1986b) analyzed data from th
study and both reported on construct validity of the MBTI, with the second study (Thom
& Borrello, 1986b) reporting a second-order factor analysis. After conferring, both revi
agreed that these studies met the inclusion criteria but decided to consider them as o
study for analysis. Excluded studies with rationale are listed in Table 1.
Data Abstraction and Quality-of-Study Score
Descriptive characteristics of each study were abstracted during the Phase II review p
for use in description and sensitivity analysis as follows:
• Characteristics of the article: author, journal, year published, publication
type
• Characteristics of the MBTI: form used, translation into another language,
format or delivery method
• Characteristics of the sample: age, gender, race/ethnicity, education level,
country of delivery, sample size
• Characteristics of the study: primary question, study design, sampling pro-
cedures, statistics collected
10 J Best Pract Health Prof Divers:Vol. 10, No. 1, Spring 2017
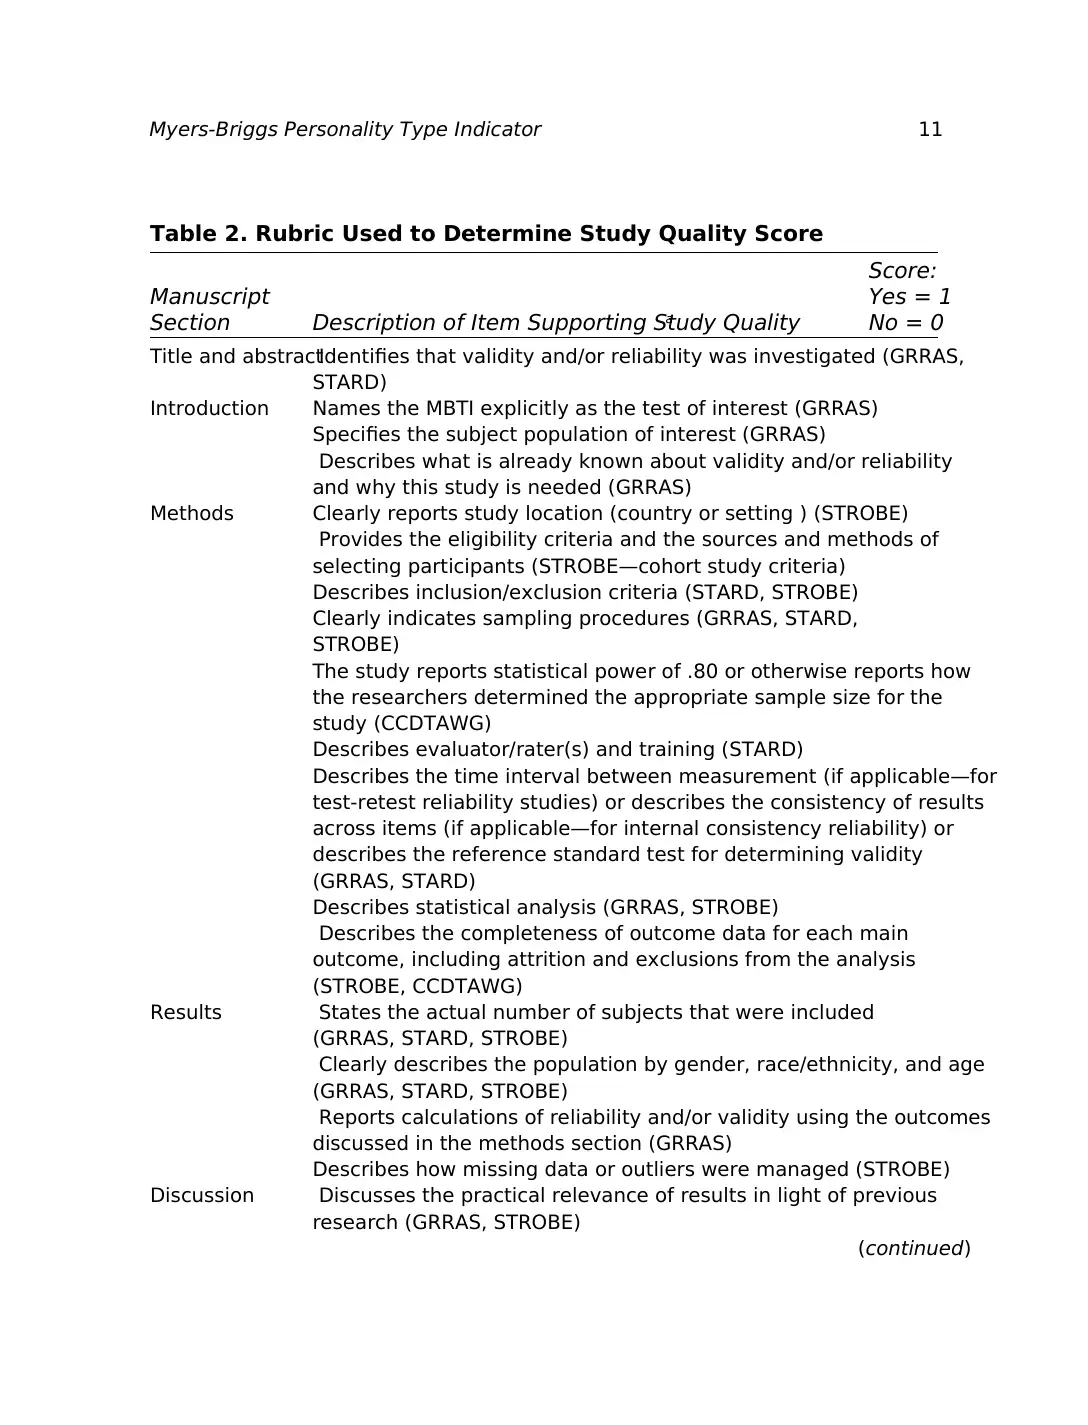
To quantify the quality of included studies, we devised a 20-point quality scoring ru
bric that incorporated elements of five sets of quality assessment guidelines: recomm
tions of the Cochrane Collaboration Diagnostic Test Accuracy Working Group (2011), th
Cochrane Assessing Risk of Bias in Included Studies document (Higgins & Altman, 200
the Guidelines for Reporting Reliability and Agreement Studies (Kottner et al., 2011), t
Standards for Reporting of Diagnostic Accuracy (Bossuyt et al., 2003), and the Strengt
the Reporting of Observational Studies in Epidemiology guidelines (von Elm et al., 200
The scoring rubric consisted of 20 statements extracted from one or more of these res
guidelines; if a reviewer determined that an article satisfied a particular statement (“y
article received one point; if the study did not fulfill a statement (“no”), it did not recei
point. Both Phase II reviewers scored each article. The reviewers discussed any differe
scores until they reached a consensus score. If the reviewers could not reach a consen
within one point, the third reviewer adjudicated the score. Table 2 contains the rubric
to determine study quality score.
Table 1. Studies Excluded in Phase II of Appraisal
Author (Year) Study Rationale for Exclusiona
Bents & Blank, 1992 2
Broer & McCarley, 1999 4
Johnson, 1992 1
Kubinger, Karner, & Menghin, 1999 1, 5
Levy & Padilla, 1982 4
Lorr, 1991 4
Nordvik, 1994a 5
Nordvick, 1994b 5
Nordvik & Brovold, 1998 1
Posey, Thorne, & Carskadon, 1999 1
Ruisel & Ruiselova, 1995 4
Saggino & Kline, 1995 2
Saggino & Kline, 1996 2
Sipps, Alexander, & Friedt, 1985 2
Tzeng, Ware, & Bharadwaj, 1991 5
Tzeng, Ware, & Chen, 1989 5
Rationales for exclusion: 1, did not answer primary question; 2, included ages <18 years; 3, non-En
and/or not published in peer-reviewed journal; 4, statistics not reported in format desired or obtaina
5, format of MBTI test inconsistent with versions examined for this review.
Secure Best Marks with AI Grader
Need help grading? Try our AI Grader for instant feedback on your assignments.
Myers-Briggs Personality Type Indicator 11
Table 2. Rubric Used to Determine Study Quality Score
Score:
Manuscript Yes = 1
Section Description of Item Supporting Study Qualitya No = 0
Title and abstractIdentifies that validity and/or reliability was investigated (GRRAS,
STARD)
Introduction Names the MBTI explicitly as the test of interest (GRRAS)
Specifies the subject population of interest (GRRAS)
Describes what is already known about validity and/or reliability
and why this study is needed (GRRAS)
Methods Clearly reports study location (country or setting ) (STROBE)
Provides the eligibility criteria and the sources and methods of
selecting participants (STROBE—cohort study criteria)
Describes inclusion/exclusion criteria (STARD, STROBE)
Clearly indicates sampling procedures (GRRAS, STARD,
STROBE)
The study reports statistical power of .80 or otherwise reports how
the researchers determined the appropriate sample size for the
study (CCDTAWG)
Describes evaluator/rater(s) and training (STARD)
Describes the time interval between measurement (if applicable—for
test-retest reliability studies) or describes the consistency of results
across items (if applicable—for internal consistency reliability) or
describes the reference standard test for determining validity
(GRRAS, STARD)
Describes statistical analysis (GRRAS, STROBE)
Describes the completeness of outcome data for each main
outcome, including attrition and exclusions from the analysis
(STROBE, CCDTAWG)
Results States the actual number of subjects that were included
(GRRAS, STARD, STROBE)
Clearly describes the population by gender, race/ethnicity, and age
(GRRAS, STARD, STROBE)
Reports calculations of reliability and/or validity using the outcomes
discussed in the methods section (GRRAS)
Describes how missing data or outliers were managed (STROBE)
Discussion Discusses the practical relevance of results in light of previous
research (GRRAS, STROBE)
(continued)
12 J Best Pract Health Prof Divers:Vol. 10, No. 1, Spring 2017
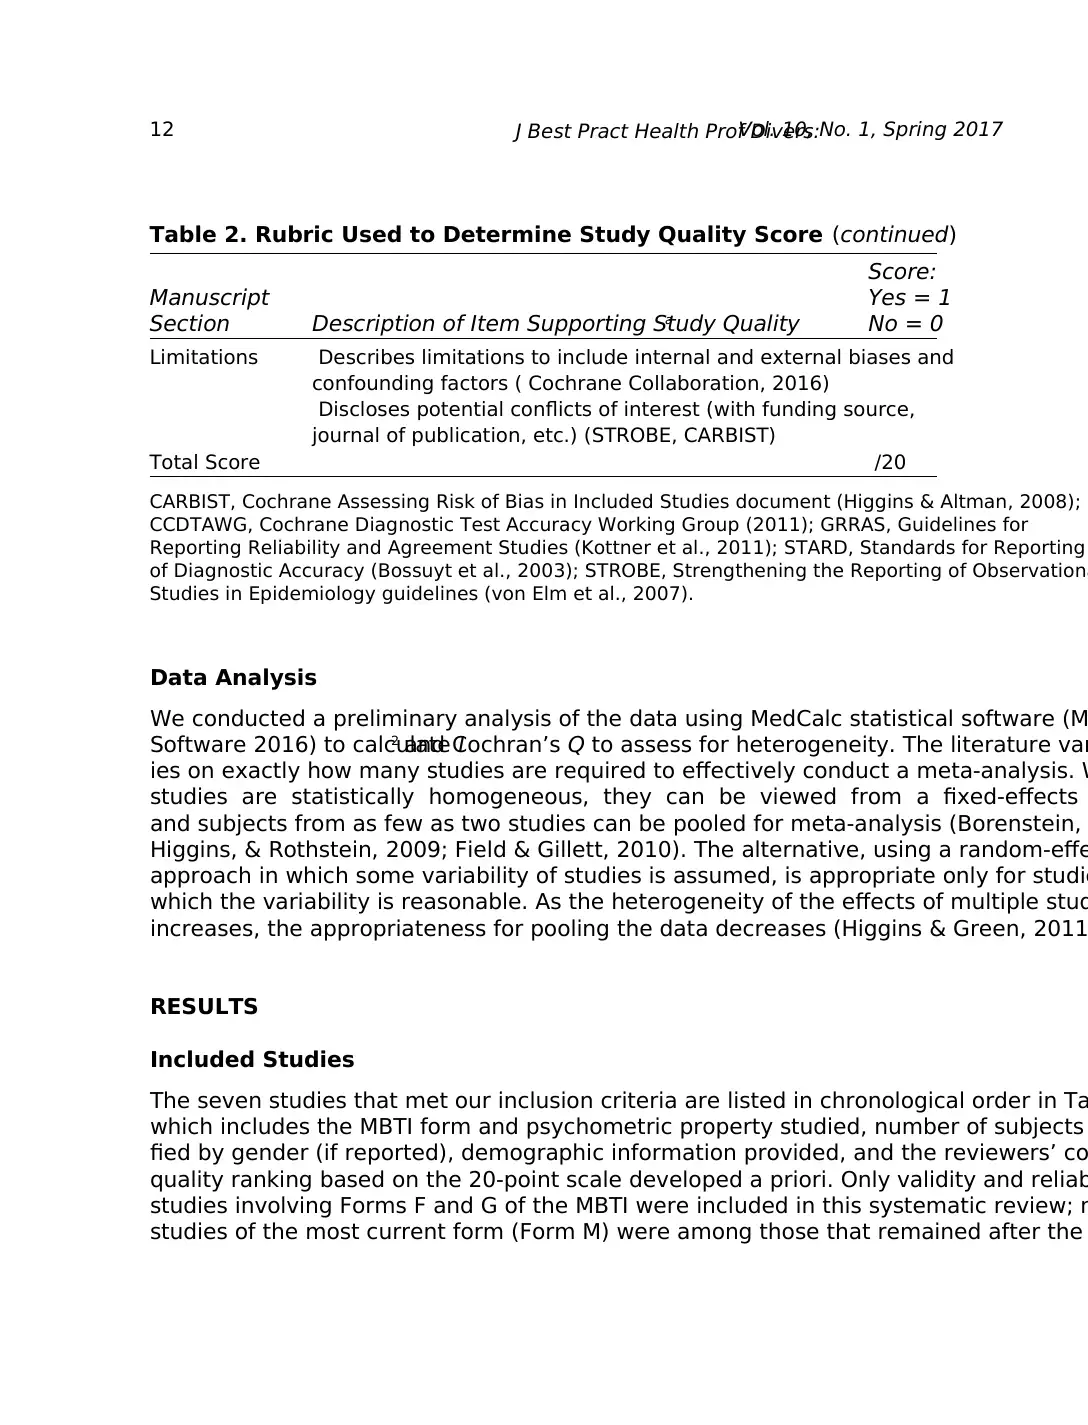
Data Analysis
We conducted a preliminary analysis of the data using MedCalc statistical software (M
Software 2016) to calculate I2 and Cochran’s Q to assess for heterogeneity. The literature var
ies on exactly how many studies are required to effectively conduct a meta-analysis. W
studies are statistically homogeneous, they can be viewed from a fixed-effects
and subjects from as few as two studies can be pooled for meta-analysis (Borenstein,
Higgins, & Rothstein, 2009; Field & Gillett, 2010). The alternative, using a random-effe
approach in which some variability of studies is assumed, is appropriate only for studie
which the variability is reasonable. As the heterogeneity of the effects of multiple stud
increases, the appropriateness for pooling the data decreases (Higgins & Green, 2011
RESULTS
Included Studies
The seven studies that met our inclusion criteria are listed in chronological order in Ta
which includes the MBTI form and psychometric property studied, number of subjects
fied by gender (if reported), demographic information provided, and the reviewers’ co
quality ranking based on the 20-point scale developed a priori. Only validity and reliab
studies involving Forms F and G of the MBTI were included in this systematic review; n
studies of the most current form (Form M) were among those that remained after the
Table 2. Rubric Used to Determine Study Quality Score (continued)
Score:
Manuscript Yes = 1
Section Description of Item Supporting Study Qualitya No = 0
Limitations Describes limitations to include internal and external biases and
confounding factors ( Cochrane Collaboration, 2016)
Discloses potential conflicts of interest (with funding source,
journal of publication, etc.) (STROBE, CARBIST)
Total Score /20
CARBIST, Cochrane Assessing Risk of Bias in Included Studies document (Higgins & Altman, 2008);
CCDTAWG, Cochrane Diagnostic Test Accuracy Working Group (2011); GRRAS, Guidelines for
Reporting Reliability and Agreement Studies (Kottner et al., 2011); STARD, Standards for Reporting
of Diagnostic Accuracy (Bossuyt et al., 2003); STROBE, Strengthening the Reporting of Observationa
Studies in Epidemiology guidelines (von Elm et al., 2007).
Myers-Briggs Personality Type Indicator 13
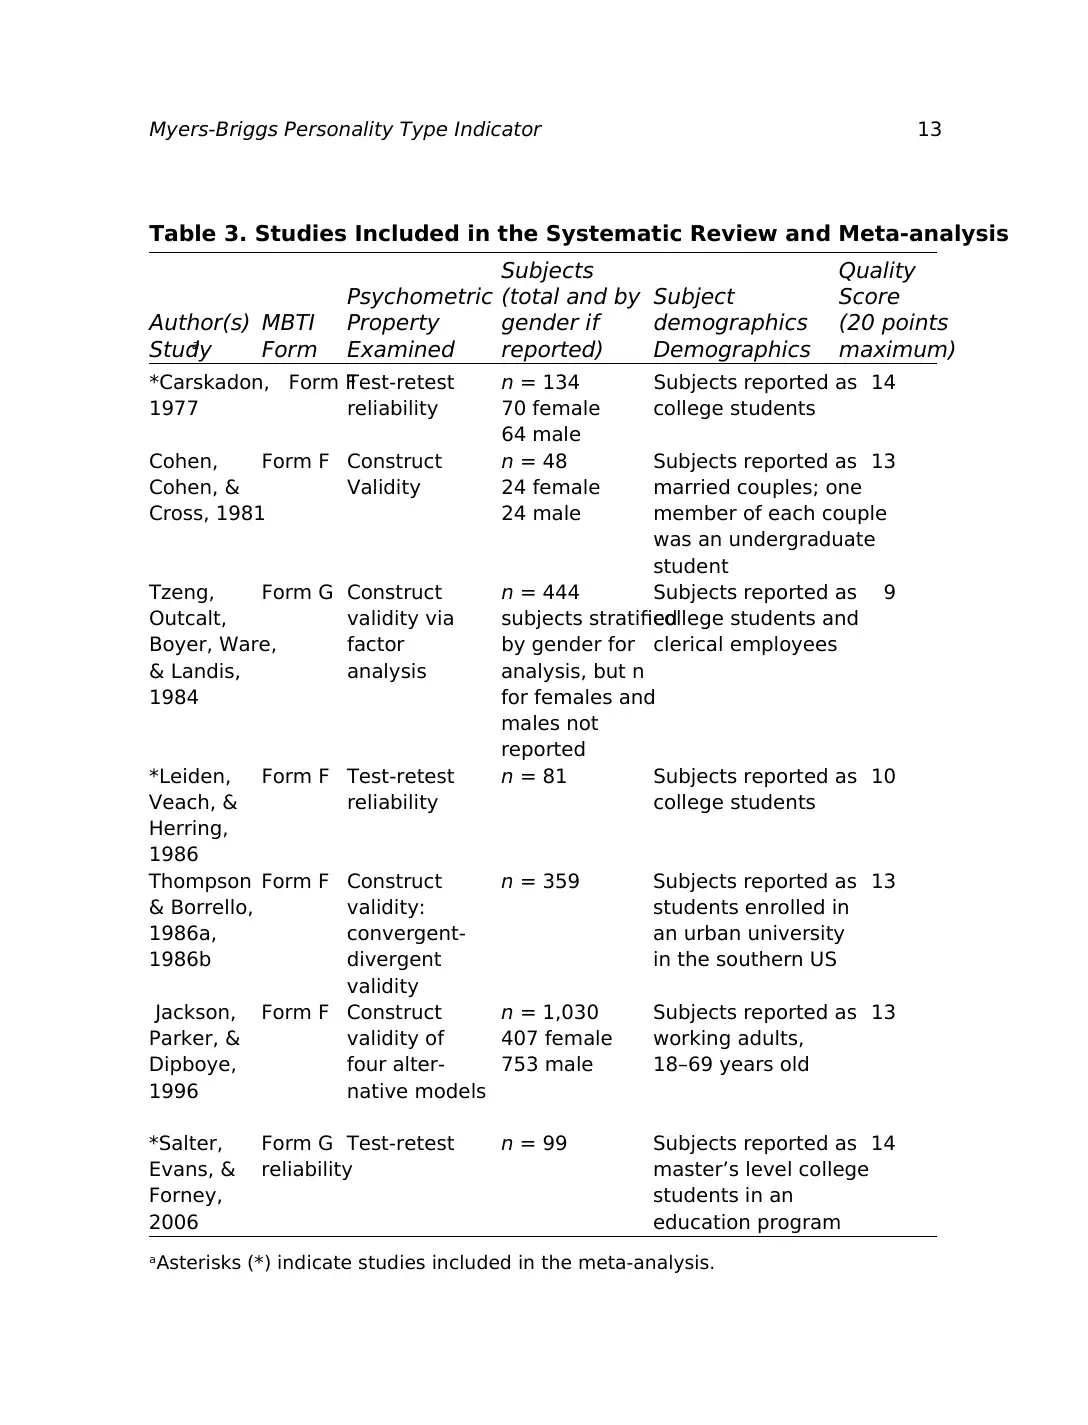
Table 3. Studies Included in the Systematic Review and Meta-analysis
Subjects Quality
Psychometric (total and by Subject Score
Author(s) MBTI Property gender if demographics (20 points
Studya Form Examined reported) Demographics maximum)
*Carskadon, Form FTest-retest n = 134 Subjects reported as 14
1977 reliability 70 female college students
64 male
Cohen, Form F Construct n = 48 Subjects reported as 13
Cohen, & Validity 24 female married couples; one
Cross, 1981 24 male member of each couple
was an undergraduate
student
Tzeng, Form G Construct n = 444 Subjects reported as 9
Outcalt, validity via subjects stratifiedcollege students and
Boyer, Ware, factor by gender for clerical employees
& Landis, analysis analysis, but n
1984 for females and
males not
reported
*Leiden, Form F Test-retest n = 81 Subjects reported as 10
Veach, & reliability college students
Herring,
1986
Thompson Form F Construct n = 359 Subjects reported as 13
& Borrello, validity: students enrolled in
1986a, convergent- an urban university
1986b divergent in the southern US
validity
Jackson, Form F Construct n = 1,030 Subjects reported as 13
Parker, & validity of 407 female working adults,
Dipboye, four alter- 753 male 18–69 years old
1996 native models
*Salter, Form G Test-retest n = 99 Subjects reported as 14
Evans, & reliability master’s level college
Forney, students in an
2006 education program
a Asterisks (*) indicate studies included in the meta-analysis.
Paraphrase This Document
Need a fresh take? Get an instant paraphrase of this document with our AI Paraphraser
14 J Best Pract Health Prof Divers:Vol. 10, No. 1, Spring 2017
phases of review. Of the included studies, four examined the construct validity of the M
and three investigated test-retest reliability. No study that met the inclusion criteria in
gated internal consistency reliability.
Quality scores of the included studies ranged from 9 to 14 out of a possible 20. The
most frequent missing information that resulted in decreased quality scores for the inc
studies were description of missing data or management of outliers, disclosure of pote
conflicts of interest, rationale supporting the choice of sample size, description of eval
training, and description of criteria used to include or exclude participants.
Studies of MBTI Construct Validity
Meta-analysis of the four studies of construct validity as a pooled group was not possib
cause they examined different aspects of construct validity or differed in method of an
(American Educational Research Association, American Psychological Association, & N
tional Council on Measurement in Education, 2014). Because we were unable to pool d
for meta-analysis, we can only summarize the findings of these individual studies.
Cohen, Cohen, and Cross (1981) examined convergence of the MBTI Form F with
the Behavioral Styles Inventory, which supported the construct validity of the Extraver
Introversion, Sensing-iNtuition, and Thinking-Feeling scales. The study did not confirm
Judging-Perceiving scale. Subjects were married couples, with at least one member of
couple being an undergraduate college student. The remaining three studies applied d
types of factor analysis to examine validity of the MBTI. Jackson et al. (1996) used con
tory factor analysis of a sample of 1,030 working adults (407 female, 753 male) 18–69
of age to compare the MBTI Form F to the Five Factor Model (McCrae & Costa, 1989)
and two models suggested by Sipps, Alexander, and Friedt (1985). The results of this s
supported a “four-factor structure similar to the original Jungian structure” (Jackson et
1996, p. 111) and also concluded that there were no significant differences in scores o
MBTI between genders. Factor analysis on intercorrelations conducted on Form G by T
et al. (1984) yielded four “clear simple structures with the resultant empirical factors b
matched almost perfectly with the theoretical scales of the MBTI” (p. 255). They also f
no differences between males and females; however, they did not report the exact nu
each in their study. Further, correlations of subjects’ raw scores of the eight preferenc
of the MBTI scales indicated strong negative relationships (r < –.84) between the dicho
mous poles of each MBTI dimension. Finally, the studies by Thompson and Borello (198
1986b) conducted first-order and second-order factor analyses of the MBTI Form F sco
359 university students. The authors reported “consistent supportive evidence regard
construct validity of the Myers-Briggs Type Indicator” (1986a, p. 750) and that use of b
first-order and second-order methods with a single data set “allowed a determination
structure of the MBTI is both generalizable and accurate” (p. 751).
Myers-Briggs Personality Type Indicator 15
Studies of MBTI Test-Retest Reliability
The three studies that examined test-retest reliability and met our inclusion criteria al
ported Pearson product-moment correlation coefficients for each of the MBTI su
allowing for pooling of the data for meta-analysis.
Sample Characteristics.The pooled number of subjects from the three studies of test-
retest reliability of the MBTI totaled 314, which included 70 females and 64 males, wit
remaining 180 subjects from two studies that did not report subject gender. All three s
occurred in the United States. The subjects in all of the studies were college-age stude
differing only by education level: some were in medical school, others were seeking m
degrees, and others were enrolled in a psychology course.
Test and Study Characteristics.Two hundred and fifteen of the subjects completed
print versions in English of Form F, and 99 completed print versions in English of Form
The time frames between administration of the MBTI were seven weeks (Carskadon, 1
9 months and 21 months (Leiden, Veach, & Herring, 1986), and 24 months (Salter, Eva
& Forney, 2006), for a mean of 13.93 months. The samples were drawn from the stude
populations of the academic institutions affiliated with one or more of the authors from
of the three studies.
Results of Meta-analysis and Sensitivity Analysis.Because Carskadon (1977) strati-
fied test-retest correlations by gender and did not report combined correlations, we in
data separately for males and females. I2 values for the four subscales of the MBTI ranged
from 57.37% to 73.35%, which the Cochrane Collaboration considers “substantial” het
geneity (Higgins & Green, 2011, section 9.5.2). Cochran’s Q for the subscales produce
p-values, again indicating a moderate degree of heterogeneity of studies (Hatala, Keit
& Guyatt, 2005).
The literature abundantly reflects the quandary researchers and statisticians face a
whether to proceed with a meta-analysis when heterogeneity is present. The Cochrane
laboration acknowledges the argument that methodological diversity will always occur
meta-analyses and that heterogeneity is inevitable (Higgins & Green, 2011). Borenste
(2009) reflect this challenge as well, which they report is magnified when few studies
examined. Further, they propose that “people have the almost irresistible tendency to
some summary conclusions” and suggest that a statistical summary with known but p
suboptimal properties such as high uncertainty may be preferred to inviting an ad hoc
mary with unknown properties (chap. 40). With this in mind, we decided to conduct th
meta-analysis, albeit with caution.
The total random effects correlations of the four subscales of the MBTI produced by
16 J Best Pract Health Prof Divers:Vol. 10, No. 1, Spring 2017
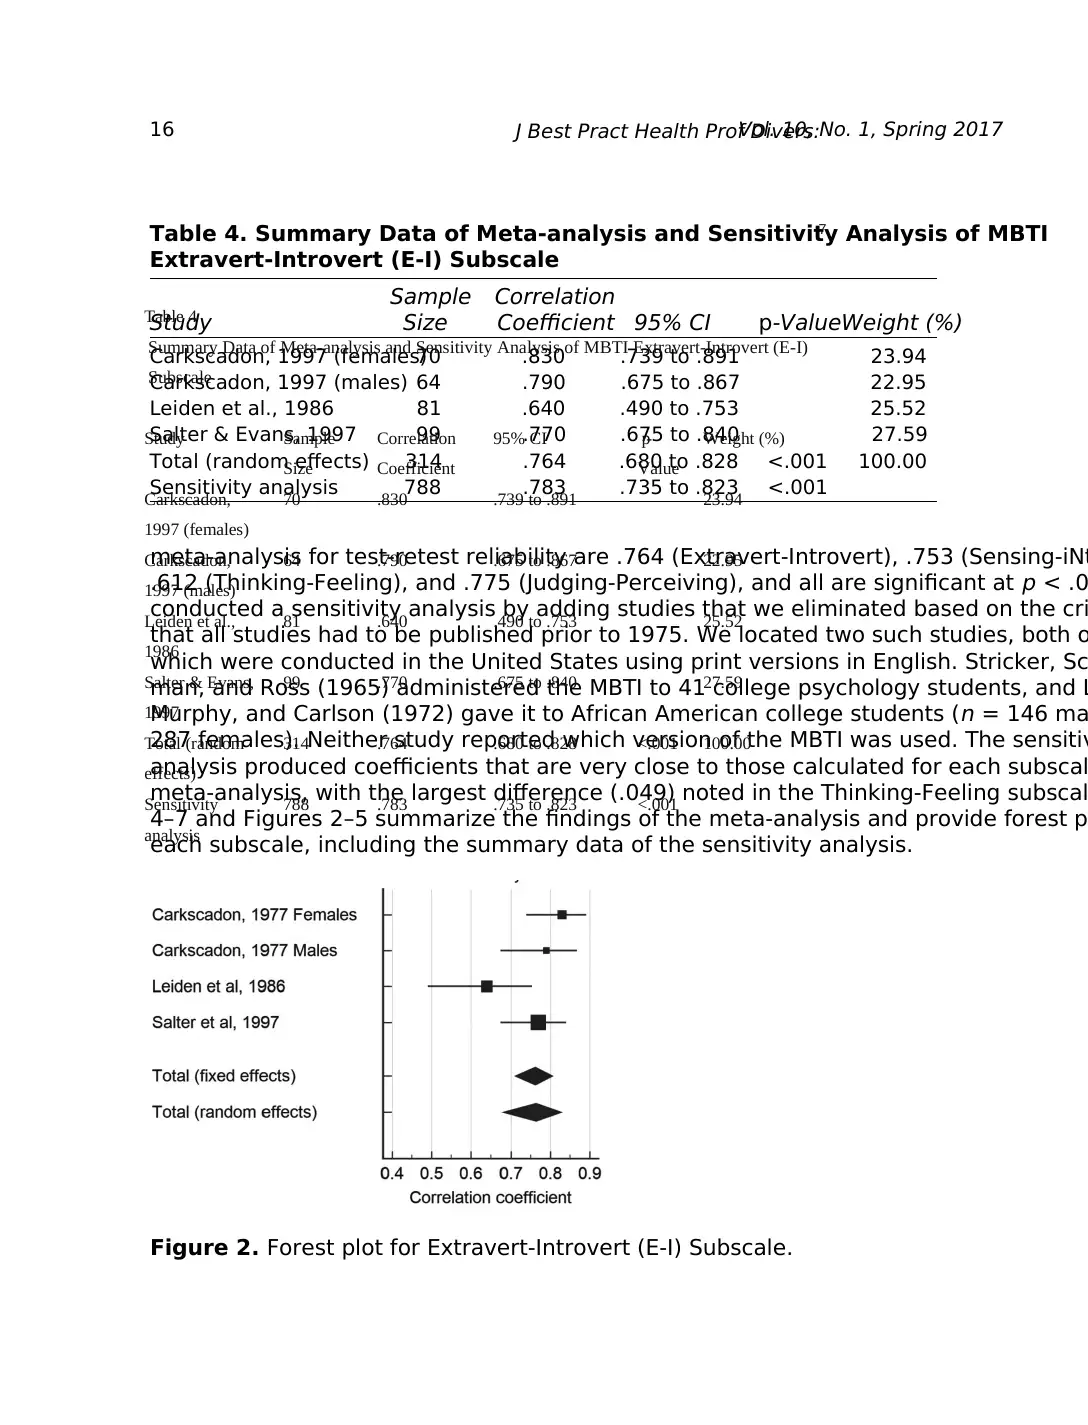
meta-analysis for test-retest reliability are .764 (Extravert-Introvert), .753 (Sensing-iNt
.612 (Thinking-Feeling), and .775 (Judging-Perceiving), and all are significant at p < .0
conducted a sensitivity analysis by adding studies that we eliminated based on the cri
that all studies had to be published prior to 1975. We located two such studies, both o
which were conducted in the United States using print versions in English. Stricker, Sc
man, and Ross (1965) administered the MBTI to 41 college psychology students, and L
Murphy, and Carlson (1972) gave it to African American college students (n = 146 ma
287 females). Neither study reported which version of the MBTI was used. The sensitiv
analysis produced coefficients that are very close to those calculated for each subscal
meta-analysis, with the largest difference (.049) noted in the Thinking-Feeling subscal
4–7 and Figures 2–5 summarize the findings of the meta-analysis and provide forest p
each subscale, including the summary data of the sensitivity analysis.
Figure 2. Forest plot for Extravert-Introvert (E-I) Subscale.
Table 4. Summary Data of Meta-analysis and Sensitivity Analysis of MBTI
Extravert-Introvert (E-I) Subscale
Sample Correlation
Study Size Coefficient 95% CI p-ValueWeight (%)
Carkscadon, 1997 (females)70 .830 .739 to .891 23.94
Carkscadon, 1997 (males) 64 .790 .675 to .867 22.95
Leiden et al., 1986 81 .640 .490 to .753 25.52
Salter & Evans, 1997 99 .770 .675 to .840 27.59
Total (random effects) 314 .764 .680 to .828 <.001 100.00
Sensitivity analysis 788 .783 .735 to .823 <.001
7
Table 4
Summary Data of Meta-analysis and Sensitivity Analysis of MBTI Extravert-Introvert (E-I)
Subscale
Study Sample
Size
Correlation
Coefficient
95% CI p-
Value
Weight (%)
Carkscadon,
1997 (females)
70 .830 .739 to .891 23.94
Carkscadon,
1997 (males)
64 .790 .675 to .867 22.95
Leiden et al.,
1986
81 .640 .490 to .753 25.52
Salter & Evans,
1997
99 .770 .675 to .840 27.59
Total (random
effects)
314 .764 .680 to .828 <.001 100.00
Sensitivity
analysis
788 .783 .735 to .823 <.001
Secure Best Marks with AI Grader
Need help grading? Try our AI Grader for instant feedback on your assignments.
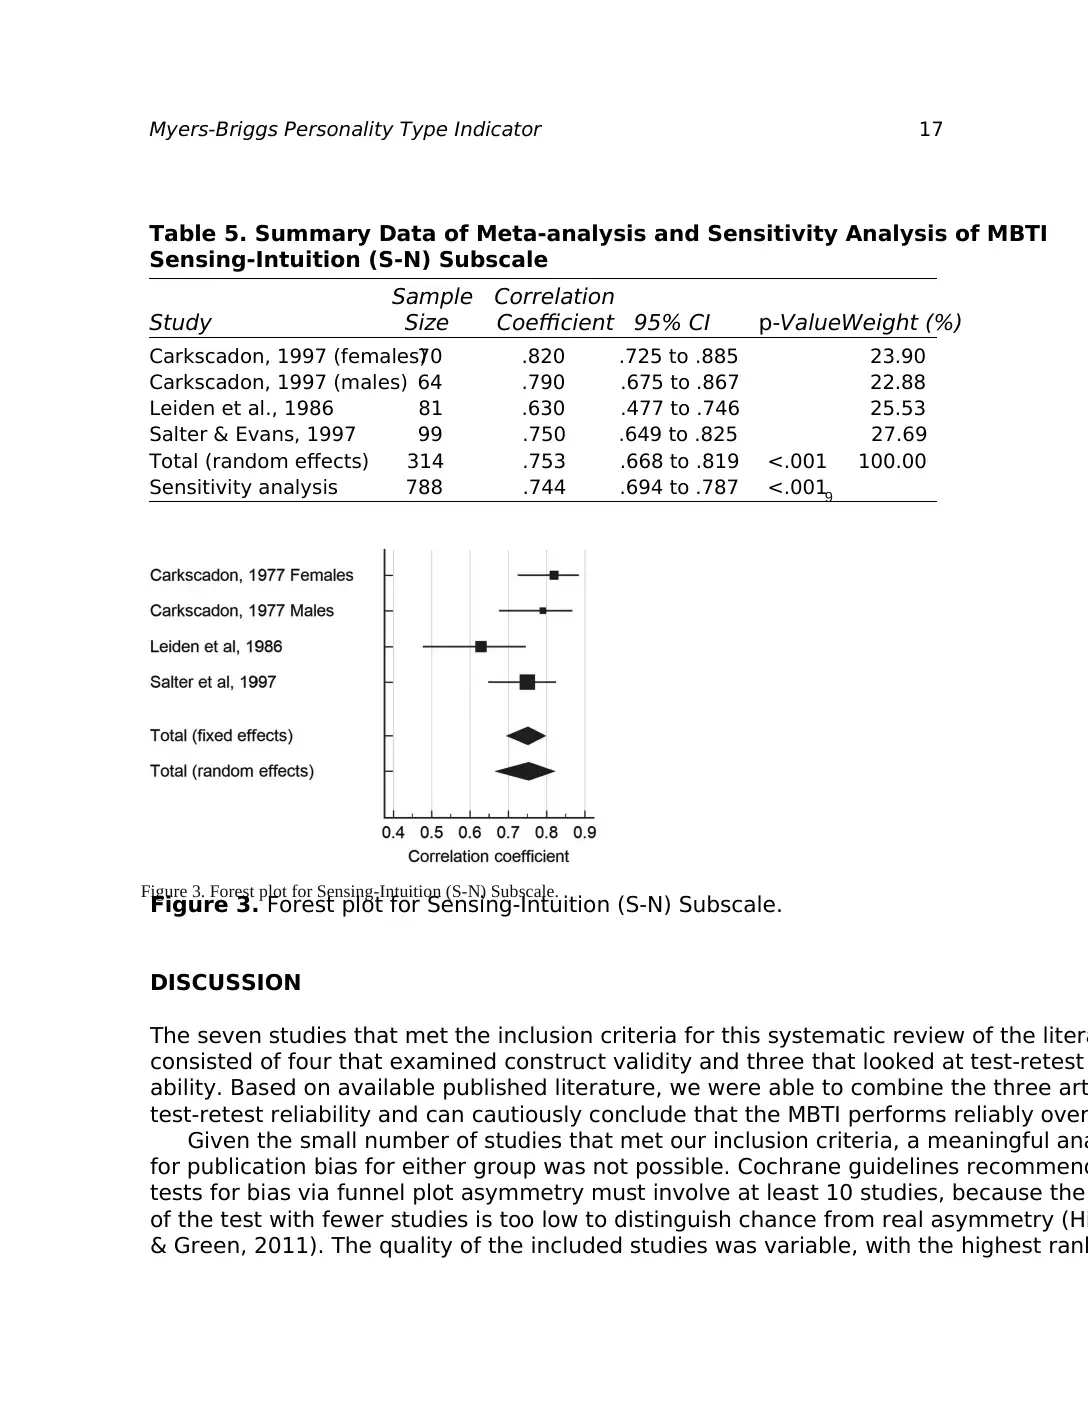
Myers-Briggs Personality Type Indicator 17
DISCUSSION
The seven studies that met the inclusion criteria for this systematic review of the litera
consisted of four that examined construct validity and three that looked at test-retest
ability. Based on available published literature, we were able to combine the three art
test-retest reliability and can cautiously conclude that the MBTI performs reliably over
Given the small number of studies that met our inclusion criteria, a meaningful ana
for publication bias for either group was not possible. Cochrane guidelines recommend
tests for bias via funnel plot asymmetry must involve at least 10 studies, because the
of the test with fewer studies is too low to distinguish chance from real asymmetry (Hi
& Green, 2011). The quality of the included studies was variable, with the highest rank
Table 5. Summary Data of Meta-analysis and Sensitivity Analysis of MBTI
Sensing-Intuition (S-N) Subscale
Sample Correlation
Study Size Coefficient 95% CI p-ValueWeight (%)
Carkscadon, 1997 (females)70 .820 .725 to .885 23.90
Carkscadon, 1997 (males) 64 .790 .675 to .867 22.88
Leiden et al., 1986 81 .630 .477 to .746 25.53
Salter & Evans, 1997 99 .750 .649 to .825 27.69
Total (random effects) 314 .753 .668 to .819 <.001 100.00
Sensitivity analysis 788 .744 .694 to .787 <.0019
Figure 3. Forest plot for Sensing-Intuition (S-N) Subscale.
Figure 3. Forest plot for Sensing-Intuition (S-N) Subscale.
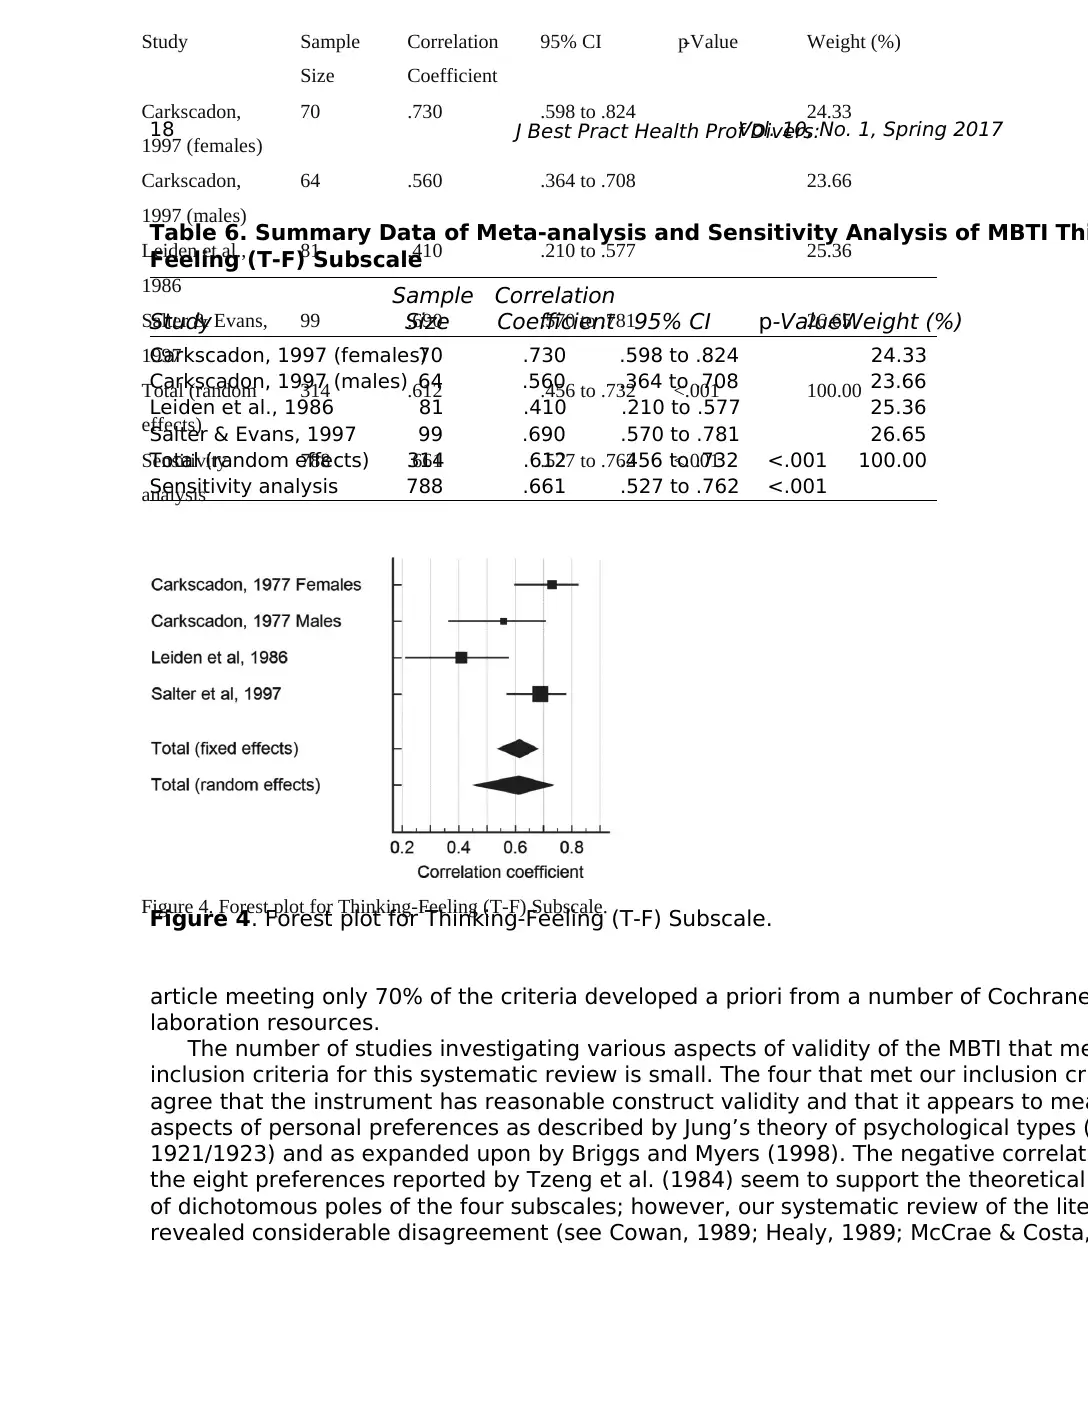
18 J Best Pract Health Prof Divers:Vol. 10, No. 1, Spring 2017
article meeting only 70% of the criteria developed a priori from a number of Cochrane
laboration resources.
The number of studies investigating various aspects of validity of the MBTI that me
inclusion criteria for this systematic review is small. The four that met our inclusion cri
agree that the instrument has reasonable construct validity and that it appears to mea
aspects of personal preferences as described by Jung’s theory of psychological types (
1921/1923) and as expanded upon by Briggs and Myers (1998). The negative correlati
the eight preferences reported by Tzeng et al. (1984) seem to support the theoretical
of dichotomous poles of the four subscales; however, our systematic review of the lite
revealed considerable disagreement (see Cowan, 1989; Healy, 1989; McCrae & Costa,
Table 6. Summary Data of Meta-analysis and Sensitivity Analysis of MBTI Thi
Feeling (T-F) Subscale
Sample Correlation
Study Size Coefficient 95% CI p-ValueWeight (%)
Carkscadon, 1997 (females)70 .730 .598 to .824 24.33
Carkscadon, 1997 (males) 64 .560 .364 to .708 23.66
Leiden et al., 1986 81 .410 .210 to .577 25.36
Salter & Evans, 1997 99 .690 .570 to .781 26.65
Total (random effects) 314 .612 .456 to .732 <.001 100.00
Sensitivity analysis 788 .661 .527 to .762 <.001
Study Sample
Size
Correlation
Coefficient
95% CI p-Value Weight (%)
Carkscadon,
1997 (females)
70 .730 .598 to .824 24.33
Carkscadon,
1997 (males)
64 .560 .364 to .708 23.66
Leiden et al.,
1986
81 .410 .210 to .577 25.36
Salter & Evans,
1997
99 .690 .570 to .781 26.65
Total (random
effects)
314 .612 .456 to .732 <.001 100.00
Sensitivity
analysis
788 .661 .527 to .762 <.001
Figure 4. Forest plot for Thinking-Feeling (T-F) Subscale.
Figure 4. Forest plot for Thinking-Feeling (T-F) Subscale.
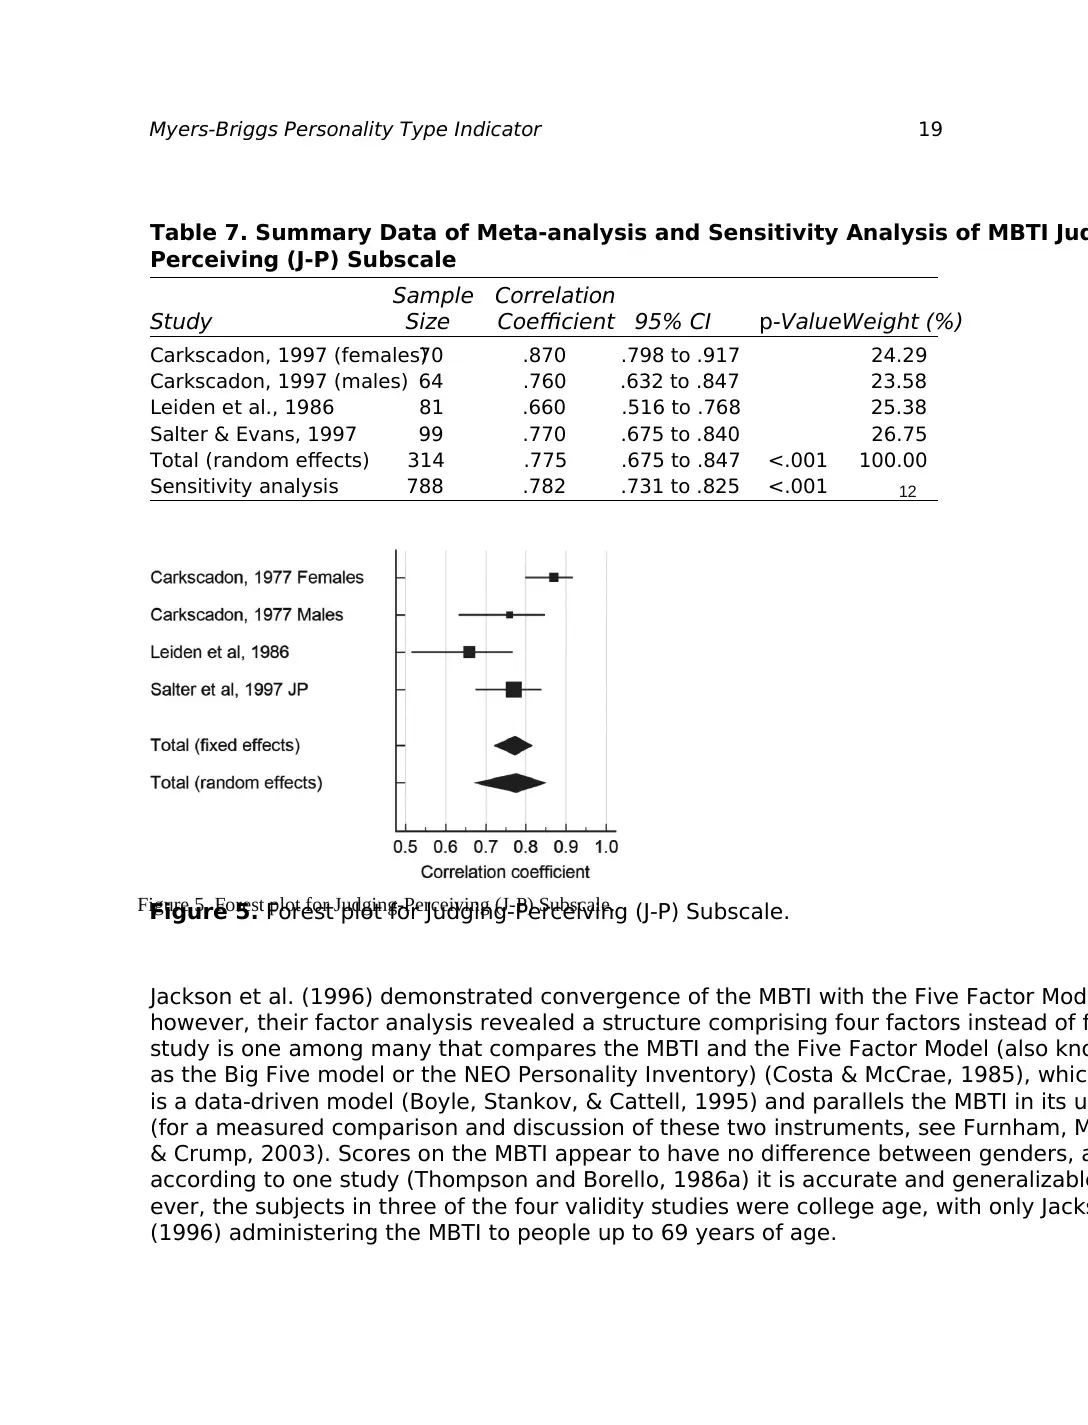
Myers-Briggs Personality Type Indicator 19
Jackson et al. (1996) demonstrated convergence of the MBTI with the Five Factor Mode
however, their factor analysis revealed a structure comprising four factors instead of fi
study is one among many that compares the MBTI and the Five Factor Model (also kno
as the Big Five model or the NEO Personality Inventory) (Costa & McCrae, 1985), which
is a data-driven model (Boyle, Stankov, & Cattell, 1995) and parallels the MBTI in its u
(for a measured comparison and discussion of these two instruments, see Furnham, M
& Crump, 2003). Scores on the MBTI appear to have no difference between genders, a
according to one study (Thompson and Borello, 1986a) it is accurate and generalizable
ever, the subjects in three of the four validity studies were college age, with only Jacks
(1996) administering the MBTI to people up to 69 years of age.
Table 7. Summary Data of Meta-analysis and Sensitivity Analysis of MBTI Jud
Perceiving (J-P) Subscale
Sample Correlation
Study Size Coefficient 95% CI p-ValueWeight (%)
Carkscadon, 1997 (females)70 .870 .798 to .917 24.29
Carkscadon, 1997 (males) 64 .760 .632 to .847 23.58
Leiden et al., 1986 81 .660 .516 to .768 25.38
Salter & Evans, 1997 99 .770 .675 to .840 26.75
Total (random effects) 314 .775 .675 to .847 <.001 100.00
Sensitivity analysis 788 .782 .731 to .825 <.001 12
Figure 5. Forest plot for Judging-Perceiving (J-P) Subscale.Figure 5. Forest plot for Judging-Perceiving (J-P) Subscale.
Paraphrase This Document
Need a fresh take? Get an instant paraphrase of this document with our AI Paraphraser
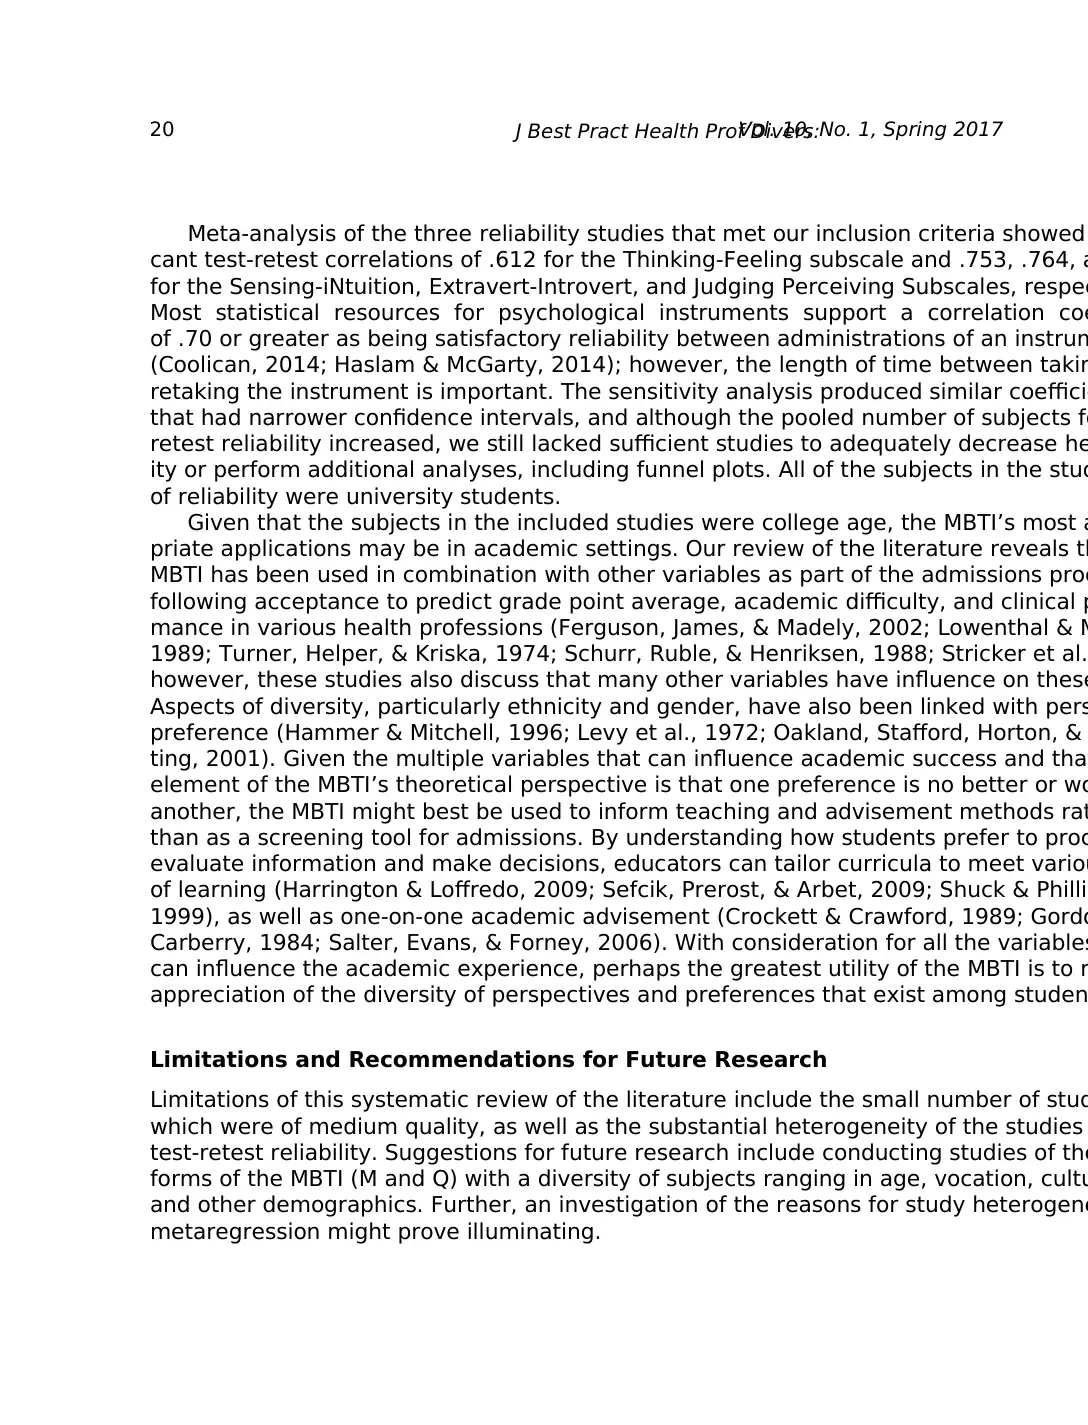
20 J Best Pract Health Prof Divers:Vol. 10, No. 1, Spring 2017
Meta-analysis of the three reliability studies that met our inclusion criteria showed
cant test-retest correlations of .612 for the Thinking-Feeling subscale and .753, .764, a
for the Sensing-iNtuition, Extravert-Introvert, and Judging Perceiving Subscales, respec
Most statistical resources for psychological instruments support a correlation coe
of .70 or greater as being satisfactory reliability between administrations of an instrum
(Coolican, 2014; Haslam & McGarty, 2014); however, the length of time between takin
retaking the instrument is important. The sensitivity analysis produced similar coefficie
that had narrower confidence intervals, and although the pooled number of subjects fo
retest reliability increased, we still lacked sufficient studies to adequately decrease he
ity or perform additional analyses, including funnel plots. All of the subjects in the stud
of reliability were university students.
Given that the subjects in the included studies were college age, the MBTI’s most a
priate applications may be in academic settings. Our review of the literature reveals th
MBTI has been used in combination with other variables as part of the admissions proc
following acceptance to predict grade point average, academic difficulty, and clinical p
mance in various health professions (Ferguson, James, & Madely, 2002; Lowenthal & M
1989; Turner, Helper, & Kriska, 1974; Schurr, Ruble, & Henriksen, 1988; Stricker et al.
however, these studies also discuss that many other variables have influence on these
Aspects of diversity, particularly ethnicity and gender, have also been linked with pers
preference (Hammer & Mitchell, 1996; Levy et al., 1972; Oakland, Stafford, Horton, &
ting, 2001). Given the multiple variables that can influence academic success and that
element of the MBTI’s theoretical perspective is that one preference is no better or wo
another, the MBTI might best be used to inform teaching and advisement methods rat
than as a screening tool for admissions. By understanding how students prefer to proc
evaluate information and make decisions, educators can tailor curricula to meet variou
of learning (Harrington & Loffredo, 2009; Sefcik, Prerost, & Arbet, 2009; Shuck & Phillip
1999), as well as one-on-one academic advisement (Crockett & Crawford, 1989; Gordo
Carberry, 1984; Salter, Evans, & Forney, 2006). With consideration for all the variables
can influence the academic experience, perhaps the greatest utility of the MBTI is to r
appreciation of the diversity of perspectives and preferences that exist among studen
Limitations and Recommendations for Future Research
Limitations of this systematic review of the literature include the small number of stud
which were of medium quality, as well as the substantial heterogeneity of the studies
test-retest reliability. Suggestions for future research include conducting studies of the
forms of the MBTI (M and Q) with a diversity of subjects ranging in age, vocation, cultu
and other demographics. Further, an investigation of the reasons for study heterogene
metaregression might prove illuminating.
Myers-Briggs Personality Type Indicator 21
Future research might address questions specific to how MBTI scoring is being use
the validity of results for these purposes. For example, if educators are using MBTI sco
provide context for individual and team member behavior, does knowledge of MBTI pr
ence improve performance or relations within teams? Another potential line of inquiry
relate to whether certain instructional strategies produce different outcomes based on
preference. The quantity of potential studies of the MBTI or similar such instruments a
their properties are as many and varied as their possible applications.
CONCLUSIONS
A small number of studies met our inclusion criteria to examine the validity and reliab
the MBTI. Published works were also limited to earlier versions of the instrument (Form
and G). The quality of the included studies was variable, with the highest ranked articl
ing only 70% of the criteria developed a priori from a number of Cochrane Collaboratio
resources. Four studies of construct validity individually lend support that the instrume
a valid representation of the theory of personality preferences on which it is based; ho
their disparate methodologies did not allow for meta-analysis. The three studies of tes
reliability of the subscales of the MBTI demonstrated strong heterogeneity, and
meta-analysis produced acceptable correlation coefficients for Extraversion-Introve
Sensing-iNtuition, and Perceiving-Judging, with weaker reliability for Thinking-Feeling.
populations in six of the seven studies were college-age students in various academic
grams; thus, interpretations of the tool are perhaps more applicable to this population
to others. Given this, we have a relatively good degree of confidence that we can gene
the findings from this systematic review of the literature in our university classrooms.
said, the paucity of good-quality studies that meet the rigor of the Cochrane Collabora
indicates that our effort to employ an evidence-informed curriculum by using a valid in
ment that reliably measures personality preferences is an ongoing task. The MBTI has
widely used for many years, and not unlike any other psychometric instrument, the ev
to support its validity and reliability—among other attributes—should be current and o
highest quality possible.
REFERENCES
American Educational Research Association, American Psychological Association, &
National Council on Measurement in Education. (2014). Standards for educational a
psychological testing. Washington, DC: American Educational Research Association
Angler, B. (2009). Personality theories (8th ed.). Belmont, CA: Wadsworth.
22 J Best Pract Health Prof Divers:Vol. 10, No. 1, Spring 2017
Barbuto, J. E. (1997). A critique of the Myers-Briggs Type Indicator and its operationaliz
tion of Carl Jung’s psychological types. Psychological Reports, 80, 611–625.
Bell, M. A., Wales, P. S., Torbeck, L. J., Kunzer, J. M., Thurston, V. C., & Brokaw, J. J.
(2011). Do personality differences between teachers and learners impact students
evaluations of a surgery clerkship? Journal of Surgical Education, 68(3), 190–193.
Bents, R., & Blank, R., (1992). The development of a personality assessment tool: The
Myers-Briggs Typenindicator. European Review of Applied Psychology/Revue
Europeenne de Psychologie Appliquee, 42, 1–9.
Borenstein, M. Hedges, L. V., Higgins, J. P. T., & Rothstein, H. R. (2009). Introduction to
meta-analysis. Chichester, UK: Wiley.
Bossuyt, P. M., Reitsma, J. B., Bruns, D. E., Gatsonis, C. A., Glasziou, P. P., Irwig, L. M.,
Lijmer, J. G. (2003). The STARD statement for reporting studies of diagnostic accu-
racy: Explanation and elaboration. Annals of Internal Medicine, 138, 1–12.
Boyle, C. J., Stankov, L., & Cattell, R. B. (1995). Measurement and statistical models in
study of personality and intelligence. In D. H. Saklofske & M. Zeidner (Eds.), Interna
tional handbook of personality and intelligence (pp. 431–433).
Briggs Myers, I. (1998). Introduction to type (6th ed.). Palo Alto, CA: Consulting Psycho
Press.
Broer, E., & McCarley, N. G. (1999). Using and validating the Myers-Briggs Type Indica
in mainland China. Journal of Psychological Type, 51, 5–21.
Capraro, R. M. & Capraro, M. M. (2002). Myers-Briggs Type Indicator score reliability
across studies: A meta-analytic reliability generalization study. Educational and Psy
cal Measurement, 62, 590–602.
Carlson, J. C. (1985). Recent assessments of the Myers-Briggs Type Indicator. Journal o
Personality Assessment, 49, 356–365.
Carlyn, M. (1977). An assessment of the Myers-Briggs Type Indicator. Journal of Person
Assessment, 41, 461–473.
Carskadon, T. G. (1977). Test-retest reliabilities of continuous scores on the Myers-Brig
Type Indicator. Psychological Reports, 41, 1011–1012.
Clarivate Analytics. (2014). EndNote (version 7.02) [computer software]. Retrieved fro
http://endnote.com/downloads/30-day-trial
Cochrane Collaboration (2016). Cochrane: Our vision, mission, and principles. Retrieve
http://www.cochrane.org/about-us/our-vision-mission-and-principles
Cochrane Collaboration Diagnostic Test Accuracy Working Group (2011). Cochrane han
book for systematic reviews of diagnostic test accuracy. Retrieved from http://srdta
.org/handbook-dta-reviews
Cohen, D., Cohen, M., & Cross, H. (1981). A construct validity study of the Myers-Brigg
Type Indicator. Educational and Psychological Measurement, 41, 883–891.
Coolican, H. (2014). Research methods and statistics in psychology (6th ed.). New Yor
ogy Press.
Secure Best Marks with AI Grader
Need help grading? Try our AI Grader for instant feedback on your assignments.
Myers-Briggs Personality Type Indicator 23
Costa, P., & McCrae, R. (1985). The NEO Personality Inventory manual. Odessa, FL:
Psychological Assessment Resources.
Cowan, D. A. (1989). An alternative to the dichotomous interpretation of Jung’s psycho
ical functions: Developing more sensitive measurement technology. Journal of Pers
Assessment, 53, 459–471.
Crockett, J. B., & Crawford, R. L. (1989). The relationship between the Myers-Briggs Ty
Indicator (MBTI) Scale scores and advising style preferences of college freshmen. J
nal of College Student Development, 30, 154–161.
Daisly, R. (2011). Considering personality type in adult learning: Using the Myers-Brigg
Type Indicator in instructor preparation at PricewaterhouseCoopers. Performance I
provement, 50, 15–24.
Deeks, J. J., Wisniewski, S., & Davenport, C. (2013). Guide to contents of a Cochrane
diagnostic test accuracy protocol. In J. J. Deeks, P. M. Bossuyt, & C. Gatsonis (Eds.),
Cochrane handbook for systematic reviews of diagnostic test accuracy, version 1.0
The Cochrane Collaboration. Retrieved from http://srdta.cochrane.org/
Eksteen, M. J., & Basson, M. J. (2015). Discovering the value of personality types in com
munication training for pharmacy students. African Journal of Health Professions Ed
tion, 7(1), 43–46.
Ferguson, E., James, D., & Madely, L. (2002). Factors associated with success in medic
school: Systematic review of the literature. British Medical Journal, 324, 952–957.
Field, A. P., & Gillett, R. (2010). How to do a meta-analysis. British Journal of Mathema
and Statistical Psychology, 63, 665–694.
Furnham, A., Moutafi, J., & Crump, J. (2003). The relationship between the revised NEO
Personality Inventory and the Myers-Briggs Type Indicator. Social Behavior and Per
ity, 31, 577–584.
Gardner, W.L., & Martinko, M.J. (1996). Using the Myers-Briggs Type Indicator to study
managers: A literature review and research agenda. Journal of Management, 22, 4
Gordon, V. N., & Carberry, J. D. (1984). The Myers-Briggs Type Indicator: A resource fo
developmental advising. NACADA Journal, 75–81.
Hall, C. S., & Nordby, V. C. (1973). A primer of Jungian psychology. New York: Mentor.
Hammer, A. L., & Mitchell, W. D. (1996). The distribution of the MBTI types in the US
by gender and ethnic group. Journal of Psychological Type, 37, 2–15.
Harrington, R., & Loffredo, D. A. (2009). MBTI personality type and other factors that
relate to preference for online versus face-to-face instruction. The Internet and Hig
Education, 13, 89–95.
Haslam, S. A., & McGarty, C. (2014). Research methods and statistics in psychology (2
Los Angeles: Sage.
Hatala, R., Keitz, S., Wyer, P., & Guyatt, G. (2005). Tips for learners of evidence-based
medicine: 4. Assessing heterogeneity of primary studies in systematic reviews and
whether to combine their results. Canadian Medical Association Journal, 5, 661–665
24 J Best Pract Health Prof Divers:Vol. 10, No. 1, Spring 2017
Healy, C. C. (1989). Negative: The MBTI not ready for routine use in counseling. Journa
Counseling Development, 67, 487–488.
Higgins, J. P. T., & Altman, D. G. (2008). Assessing risk of bias in included studies. In
J. P. T. Higgins & S. Green (Eds.), Cochrane handbook for systematic reviews of inte
(pp. 187–241). Hoboken, NJ: Wiley.
Higgins, J. P. T., Altman, D. G., Gotzsche, P. C., Juni, P., Moher, D., Oxman, A. D., . . .
Sterne, J. A. C. (2011). The Cochrane Collaboration’s tool for assessing risk of bias i
randomized trials. British Medical Journal, 343. doi:10.1136/bmj.d5928
Higgins, J., & Green, S. (Eds.). (2011). Cochrane handbook for systematic reviews of in
Retrieved from http://handbook.cochrane.org/front_page.htm
Hippocrates (1923). Hippocrates Collected Works (Vol. 1). W. H. S. Jones (Ed. and Tran
Cambridge, MA: Harvard University Press. Retrieved from https://archive.org/strea
/hippocrates01hippuoft/hippocrates01hippuoft_djvu.txt.
Hojat, M., Erdmann, J. B., & Gonnella, J. S. (2013). Personality assessments and outcom
in medical education and the practice of medicine: AMEE guide no. 79. Medical
Teacher, 35, e1267–e1301.
Jackson, S. L., Parker, C. P., & Dipboye, R. L. (1996). A comparison of competing mode
underlying responses to the Myers-Briggs Type Indicator. Journal of Career Assessm
99–115.
Jessup, C. M. (2002). Applying psychological type and “gifts differing” to organization
change. Journal of Organizational Change Management, 5, 502–511.
Johnson, D. A. (1992). Test-restest reliabilities of the Myers-Briggs Type Indicator and t
Type Differentiation Indicator over a 30-month period. Journal of Psychological Typ
54–58.
Jung, C. G. (1923). Psychological types. (H. G. Baynes, Trans.). London: Kegan Paul. (O
nal work published 1921)
Kottner, J., Audige, L., Brorson, S., Donner, A., Gajewski, B.J., Hrobjartsson, A. . . .
Streiner, D. L. (2011). Guidelines for reporting reliability and agreement studies
(GRRAS) were proposed. Journal of Clinical Epidemiology, 64, 96–106.
Kubinger, K. D., Karner, T., & Menghin, S. (1999). Multiple moderator effects on a teste
answer to personality questionnaire items. Review of Psychology, 6, 1–2.
Leiden, L. I., Veach, T. L., & Herring, M. W. (1986). Comparison of the abbreviated and
original versions of the Myers-Briggs Type Indicator personality inventory. Journal o
Medical Education, 61, 319–321.
Levy, N., Murphy, C., & Carlson, R. (1972). Personality types among Negro college stu-
dents. Educational and Psychological Measurement, 32, 641–653.
Levy, N. & Padilla, A. (1982). A Spanish translation of the Myers-Briggs Type Indicator
Form G. Psychological Reports, 51, 109–110.
Lorr, M. (1991). An empirical evaluation of the MBTI typology. Personality & Individual
ferences, 12, 1141–1145.
Myers-Briggs Personality Type Indicator 25
Lowenthal, W., & Meth, H. (1989). Myers-Briggs Type Inventory personality preference
and didactic performance. American Journal of Pharmacy Education, 54, 226–228.
McAdams, D. P. (2009). The person: A new introduction to personality psychology (5th
Hoboken, NJ: Wiley.
McCauley, M. H. (1990). The Myers-Briggs Type Indicator: A measure for individuals. M
surement and Evaluation in Counseling and Development, 22, 181–196.
McCrae, R. R., & Costa, P. T. (1989). Reinterpreting the Myers-Briggs Type Indicator fro
the perspective of the NEO-PI. Journal of Personality, 57, 17–40.
MedCalc Software. (2016). MedCalc (Version 16.4.3) [computer software]. Retrieved fr
https://www.medcalc.org/index.php
Meline, T. (2006). Selecting studies for systematic review: Inclusion and exclusion crite
Contemporary Issues in Communication Science and Disorders, 33, 21–27.
Murray, J. B. (1990). Review of the Myers-Briggs Type Indicator. Perceptual and Motor
70, 1187–1202.
Myers, K. D., Kirby, L. K., & Briggs Myers, I. (2015). Introduction to type: A guide to un
standing your results on the MBTI assessment (7th ed.). Palo Alto, CA: Consulting P
chologist Press.
Myers, I. B., McCaulley, M. H., Quenk, N. L., Hammer, A. L., & Mitchell, W. D. (2009).
MBTI® Step III manual: Exploring personality development using the Myers-Briggs
Indicator® instrument. Mountain View, CA: Consulting Psychologist Press.
Myers & Briggs Foundation. (2016). International use. Retrieved from http://www
.myersbriggs.org/more-about-personality-type/international-use/
Nordvik, H. (1994a). Two Norwegian versions of the MBTI, Form G: Scoring and interna
consistency. Journal of Psychological Type, 29, 24–31.
Nordvik, H. (1994b). Type, vocation, and self-report personality variables: A validity stu
Norwegian translation of the MBTI, Form G. Journal of Psychological Type, 29, 32–3
Nordvik, H., & Brovold, H. (1998). Personality traits in leadership tasks. Scandinavian J
nal of Psychology, 39, 61–64.
Oakland, T., Stafford, M. E., Horton, C. B., & Glutting, J. J. (2001). Temperament and
vocational preferences: Age, gender, and racial-ethnic comparisons using the stude
styles questionnaire. Journal of Career Assessment, 9, 297–314.
Pittenger, D. J. (1993). The utility of the Myers-Briggs Type Indicator. Review of Educat
Research, 63, 467–488.
Posey, A. M., Thorne, B., & Carskadon, T. G. (1999). Differential validity and comparati
type distributions of blacks and whites on the Myers-Briggs Type Indicator. Journal
Psychological Type, 48, 6–21.
Pretz, J. E., & Folse, V. N. (2011). Nursing experience and preference for intuition in de
sion making. Journal of Clinical Nursing, 20, 2878–2889.
Ruisel, I., & Ruiselova, Z. (1995). Validation of Slovak version of MBTI (preliminary stan
dardization results). Studia Psychologica, 37, 209–216.
Paraphrase This Document
Need a fresh take? Get an instant paraphrase of this document with our AI Paraphraser
26 J Best Pract Health Prof Divers:Vol. 10, No. 1, Spring 2017
Saggino, A., Cooper, C., & Kline, P. (2001). A confirmatory factor analysis of the Myers
Briggs Type Indicator. Personality & Individual Differences, 30, 3–9.
Saggino, A., & Kline, P. (1995). Item factor analysis of the Italian version of the Myers-
Briggs Type Indicator. Personality and Individual Differences, 19, 243–249.
Saggino, A., & Kline, P. (1996). The location of the Myers-Briggs Type Indicator in pers
ality factor space. Personality and Individual Differences, 21, 591–597.
Salter, D. W., & Evans, N. J. (1997). Test-retest of the Myers-Briggs Type Indicator: An
examination of dominant functioning. Educational and Psychological Measurement
590–597.
Salter, D. W., Evans, N. J., & Forney, D. S. (2006). A longitudinal study of learning style
preferences on the Myers-Briggs Type Indicator and Learning Style Inventory. Journ
College Student Development, 47, 173–184.
Sampson, M., Shang, L., Morrison, A. Barrowman, N. J., Clifford, T. J., Platt, R. W., . . .
Moher, D. (2006). An alternative to the hand searching gold standard: Validating
methodological search filters using relative recall. British Medical Research Method
1–9. doi:10.1186/1471-2288-6-33
Schaubhut, N., Herk, N. A., & Thompson, R. C. (2009). MBTI Form M manual suppleme
Retrieved from https://www.cpp.com/pdfs/MBTI_FormM_Supp.pdf
Schurr, K. T., Ruble, V. E., & Henriksen, L. W. (1988). Relationships of Myers-Briggs Typ
Indicator personality characteristics and self-reported academic problems and skill
ings with scholastic aptitude test scores. Educational and Psychological Measureme
187–196.
Sefcik, D. J., Prerost, F. J., & Arbet, S. E. (2009). Personality types and performance on
aptitude and achievement tests: Implications for osteopathic medical education. Jo
of the American Osteopathic Association, 109, 296–301.
Sipps, G. J., Alexander, R. A., & Friedt, L. (1985). Item analysis of the Myers-Briggs Typ
Indicator. Educational and Psychological Measurement, 45, 789–796.
Shuck, A. A., & Phillips, C. R. (1999). Assessing pharmacy students’ learning styles and
personality types: A ten-year analysis. American Journal of Pharmaceutical Educati
27–33.
Slavin, R. E. (1986). Best-evidence synthesis: An alternative to meta-analytic and tradi
reviews. Educational Researcher, 15(9), 5–11.
Stricker, L. J., Schiffman, H., & Ross, J. (1965). Prediction of college performance with t
Myers-Briggs Type Indicator. Educational and Psychological Measurement, 25, 108
Thompson, B., & Borrello, G. M. (1986a). Construct validity of the Myers-Briggs Type
Indicator. Educational and Psychological Measurement, 46, 745–752.
Thompson, B., & Borrello, G. M. (1986b). Second-order factor structure of the MBTI: A
construct validity assessment. Measurement and Evaluation in Counseling and Dev
18, 148–153.
Myers-Briggs Personality Type Indicator 27
Thorne, A., & Gough, H. (1999). Portrait of type an MBTI research compendium. Gaine
FL: Center for Applications of Psychological Type.
Turner, E. V., Helper, M. M., & Kriska, S. D. (1974). Predictors of clinical performance.
Journal of Medical Education, 49, 338–342.
Tzeng, O. C. S., Outcalt, D., Boyer, S. L., Ware, R., & Landis, D. (1984). Item validity of
the Myers-Briggs Type Indicator. Journal of Personality Assessment, 48, 255–256.
Tzeng, O. C. S., Ware, R. & Bharadwaj, N. (1991) Comparison between continuous bipo
lar and unipolar ratings of the Myers-Briggs Type Indicator. Educational and Psycho
Measurement, 51, 681–690.
Tzeng, O. C., Ware, R., & Chen, J. M. (1989). Measurement and utility of continuous
unipolar ratings for the Myers-Briggs Type Indicator, Journal of Personality Assessm
727–738.
von Elm, E., Altman, D. G., Egger, M., Pocock, S. J., Gotzsche, P. C. & Vandenbroucke,
J. P. (2007). The strengthening the reporting of observational studies in epidemiol-
ogy (STROBE) statement: Guidelines for reporting observational studies. Lancet, 37
1453–57.
Zemke, R. (1992). Second thoughts about the MBTI. Training, 29, 43–47.
Zumbo, B. D., & Taylor, S. V. (1993). The construct validity of the extraversion subscal
the Myers-Briggs Type Indicator. Canadian Journal of Behavioural Science/Revue Ca
dienne des Sciences du Comportement, 25, 590–604.

Reproduced with permission of copyright owner. Further
reproduction prohibited without permission.
reproduction prohibited without permission.
1 out of 28
Your All-in-One AI-Powered Toolkit for Academic Success.
+13062052269
info@desklib.com
Available 24*7 on WhatsApp / Email
![[object Object]](/_next/static/media/star-bottom.7253800d.svg)
Unlock your academic potential
© 2024 | Zucol Services PVT LTD | All rights reserved.